Mississippi Investment Properties for Sale
Browse homes for sale and investment properties in Mississippi. Refine your search by price, property type, or more.
Best cash flowing properties in Mississippi
Active
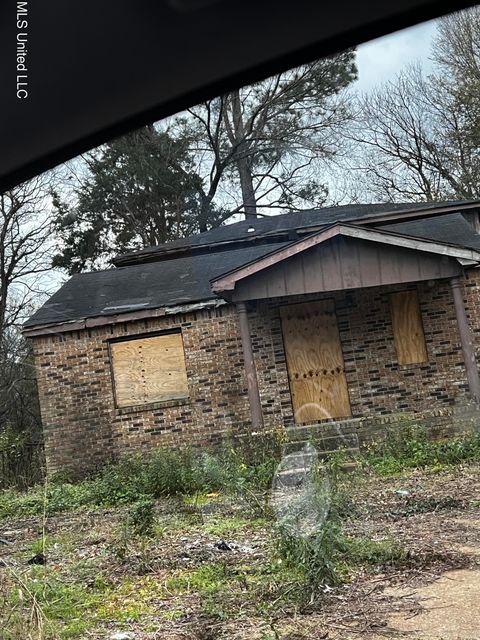
$8,500
3
bds
|
2
ba
|
0
sqft
|
built
1961
1323 W Mayes St, Jackson, MS 39213
$856
Cash flow
117.3%
Cash-on-Cash Return
120.8%
Cap rate
15.3%
Rent to Value Ratio

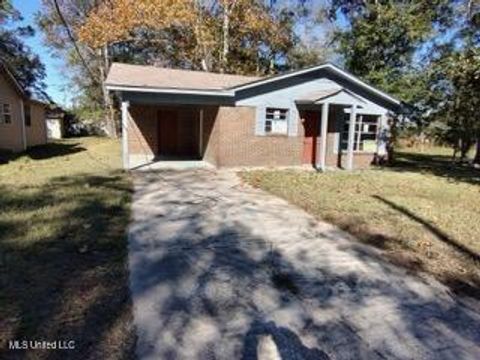
Active
$27,500
3
bds
|
1
ba
|
0
sqft
|
built
1960
425 Windsor Dr, Jackson, MS 39209
$761
Cash flow
32.2%
Cash-on-Cash Return
33.2%
Cap rate
4.4%
Rent to Value Ratio
2,679 out of 4,559 properties for sale in Mississippi
Limited Results Shown
Create a free account, or log in to reveal all property listings and enjoy the complete experience.
Active
$94,900
3
bds
|
1
ba
|
0
sqft
|
built
1970
5031 Community Ave, Moss Point, MS 39563
$195
Cash flow
10.7%
Cash-on-Cash Return
8.1%
Cap rate
1.1%
Rent to Value Ratio
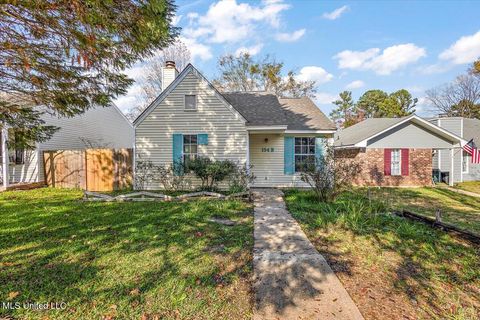
Active
$170,000
2
bds
|
1
ba
|
0
sqft
|
built
1987
154 Cumberland Rd, Brandon, MS 39047
$89
Cash flow
2.7%
Cash-on-Cash Return
6.3%
Cap rate
0.8%
Rent to Value Ratio

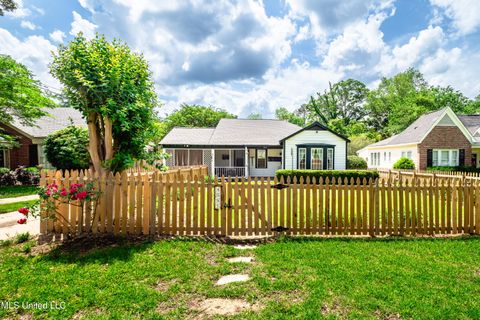
Active
$138,000
3
bds
|
3
ba
|
0
sqft
|
built
1946
109 Center St, Crystal Springs, MS 39059
$316
Cash flow
11.9%
Cash-on-Cash Return
8.4%
Cap rate
1.2%
Rent to Value Ratio

Active
$171,900
1
bds
|
1
ba
|
0
sqft
|
built
1965
1282 Beach Blvd, Biloxi, MS 39530
$189
Cash flow
5.7%
Cash-on-Cash Return
7.0%
Cap rate
1.2%
Rent to Value Ratio

Active
$215,000
3
bds
|
3
ba
|
0
sqft
|
built
2007
1101 Century Oaks Dr, Gulfport, MS 39507
$-8
Cash flow
-0.2%
Cash-on-Cash Return
5.6%
Cap rate
0.8%
Rent to Value Ratio

Active
$229,000
3
bds
|
2
ba
|
0
sqft
|
built
1991
1869 Lincolnshire Blvd, Ridgeland, MS 39157
$285
Cash flow
6.5%
Cash-on-Cash Return
7.2%
Cap rate
1.0%
Rent to Value Ratio

Active
$259,000
3
bds
|
2
ba
|
0
sqft
|
built
1984
790 Ewa Pl, Diamondhead, MS 39525
$6
Cash flow
0.1%
Cash-on-Cash Return
5.7%
Cap rate
0.8%
Rent to Value Ratio
Active
$8,500
3
bds
|
2
ba
|
0
sqft
|
built
1961
1323 W Mayes St, Jackson, MS 39213
$856
Cash flow
117.3%
Cash-on-Cash Return
120.8%
Cap rate
15.3%
Rent to Value Ratio

Active
$450,000
4
bds
|
3
ba
|
0
sqft
|
built
2022
1175 Sanctuary Dr, Brandon, MS 39042
$125
Cash flow
1.4%
Cash-on-Cash Return
6.0%
Cap rate
0.8%
Rent to Value Ratio

Active
$499,990
4
bds
|
3
ba
|
0
sqft
|
built
2006
136 Sea Oaks Blvd, Long Beach, MS 39560
$-558
Cash flow
-5.8%
Cash-on-Cash Return
4.3%
Cap rate
0.6%
Rent to Value Ratio

Active
$299,900
3
bds
|
2
ba
|
0
sqft
|
built
1975
144 Walter Jones Rd, Mendenhall, MS 39114
$213
Cash flow
3.7%
Cash-on-Cash Return
6.5%
Cap rate
0.8%
Rent to Value Ratio
Active
$245,000
3
bds
|
2
ba
|
0
sqft
|
built
1938
4081 Redwing Ave, Jackson, MS 39216
$379
Cash flow
8.1%
Cash-on-Cash Return
7.5%
Cap rate
0.9%
Rent to Value Ratio

Active
$369,900
3
bds
|
4
ba
|
0
sqft
|
built
1987
7739 Manini Way, Diamondhead, MS 39525
$42
Cash flow
0.6%
Cash-on-Cash Return
5.8%
Cap rate
0.8%
Rent to Value Ratio

Active
$215,000
2
bds
|
2
ba
|
0
sqft
|
built
1985
2537 Caravelle Cir, Gautier, MS 39553
$-92
Cash flow
-2.2%
Cash-on-Cash Return
5.2%
Cap rate
0.7%
Rent to Value Ratio
Active
$469,900
3
bds
|
3
ba
|
0
sqft
|
built
2019
148 Stanton Hall Dr, Florence, MS 39073
$-114
Cash flow
-1.3%
Cash-on-Cash Return
5.4%
Cap rate
0.7%
Rent to Value Ratio

Active
$229,000
4
bds
|
2
ba
|
0
sqft
|
built
2000
5906 Chicopee Trce, Ocean Springs, MS 39564
$65
Cash flow
1.5%
Cash-on-Cash Return
6.0%
Cap rate
0.9%
Rent to Value Ratio

Active
$253,990
3
bds
|
2
ba
|
0
sqft
|
built
1968
910 Williams St, Pascagoula, MS 39567
$392
Cash flow
8.1%
Cash-on-Cash Return
7.5%
Cap rate
1.0%
Rent to Value Ratio

Active
$274,000
3
bds
|
1
ba
|
0
sqft
|
built
1969
417 Saint John St, Bay Saint Louis, MS 39520
$-55
Cash flow
-1.0%
Cash-on-Cash Return
5.4%
Cap rate
0.7%
Rent to Value Ratio
Active
$368,900
4
bds
|
4
ba
|
0
sqft
|
built
1965
3402 Tillman St, Pascagoula, MS 39581
$116
Cash flow
1.6%
Cash-on-Cash Return
6.1%
Cap rate
0.8%
Rent to Value Ratio

Active
$189,500
3
bds
|
1
ba
|
0
sqft
|
built
1981
902 Rue De Lasalle St, Waveland, MS 39576
$79
Cash flow
2.2%
Cash-on-Cash Return
6.2%
Cap rate
0.8%
Rent to Value Ratio

Active
$369,900
2
bds
|
2
ba
|
0
sqft
|
built
2023
140 Freedom Ring Dr, Brandon, MS 39047
$-324
Cash flow
-4.6%
Cash-on-Cash Return
4.6%
Cap rate
0.8%
Rent to Value Ratio

Active
$182,500
4
bds
|
1
ba
|
0
sqft
|
built
1964
329 Park Dr, Biloxi, MS 39531
$-148
Cash flow
-4.2%
Cash-on-Cash Return
4.7%
Cap rate
0.7%
Rent to Value Ratio
Active
$377,000
4
bds
|
3
ba
|
0
sqft
|
built
2002
11347 Crystal Lake Dr, Gulfport, MS 39503
$18
Cash flow
0.2%
Cash-on-Cash Return
5.7%
Cap rate
0.7%
Rent to Value Ratio

Active
$370,000
5
bds
|
4
ba
|
0
sqft
|
built
2000
10668 Stark Acres Rd, Olive Branch, MS 38654
$-143
Cash flow
-2.0%
Cash-on-Cash Return
5.2%
Cap rate
0.7%
Rent to Value Ratio
Active
$358,500
3
bds
|
2
ba
|
0
sqft
|
built
2023
119 Ashwood Pl, Pearl, MS 39208
$-317
Cash flow
-4.6%
Cash-on-Cash Return
4.6%
Cap rate
0.6%
Rent to Value Ratio
Active
$299,900
4
bds
|
4
ba
|
0
sqft
|
built
1958
19 Poplar Cir, Gulfport, MS 39507
$365
Cash flow
6.3%
Cash-on-Cash Return
7.1%
Cap rate
0.9%
Rent to Value Ratio

Active
$950,000
3
bds
|
4
ba
|
0
sqft
|
built
1915
109 Court St, Bay Saint Louis, MS 39520
$-1,768
Cash flow
-9.7%
Cash-on-Cash Return
3.4%
Cap rate
0.5%
Rent to Value Ratio

Active
$328,000
4
bds
|
2
ba
|
0
sqft
|
built
2021
3128 Bryant St, Southaven, MS 38672
$-52
Cash flow
-0.8%
Cash-on-Cash Return
5.5%
Cap rate
0.8%
Rent to Value Ratio

Active
$1,150,000
4
bds
|
4
ba
|
0
sqft
|
built
2009
19910 Red Oak Rd, Saucier, MS 39574
$-3,465
Cash flow
-15.7%
Cash-on-Cash Return
2.1%
Cap rate
0.3%
Rent to Value Ratio
Active
$327,500
4
bds
|
3
ba
|
0
sqft
|
built
1985
2416 Greenview Dr, Gulfport, MS 39507
$184
Cash flow
2.9%
Cash-on-Cash Return
6.4%
Cap rate
0.8%
Rent to Value Ratio

Active
$23,000
4
bds
|
1
ba
|
0
sqft
|
built
1950
3909 Ilano Dr, Jackson, MS 39212
$703
Cash flow
35.6%
Cash-on-Cash Return
36.7%
Cap rate
4.8%
Rent to Value Ratio

Active
$325,000
2
bds
|
1
ba
|
0
sqft
|
built
1870
301 N Necaise Ave, Bay Saint Louis, MS 39520
$-402
Cash flow
-6.5%
Cash-on-Cash Return
4.2%
Cap rate
0.6%
Rent to Value Ratio
Active
$997,000
5
bds
|
5
ba
|
0
sqft
|
built
2004
115 Summer Lake Dr, Ridgeland, MS 39157
$-1,690
Cash flow
-8.8%
Cash-on-Cash Return
3.6%
Cap rate
0.6%
Rent to Value Ratio
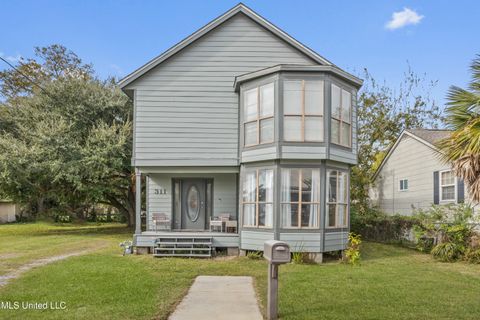
Active
$250,000
4
bds
|
3
ba
|
0
sqft
|
built
1920
311 Haise St, Biloxi, MS 39530
$407
Cash flow
8.5%
Cash-on-Cash Return
7.6%
Cap rate
1.0%
Rent to Value Ratio

Active
$625,000
3
bds
|
2
ba
|
0
sqft
|
built
1967
23213 Church Ave, Saucier, MS 39574
$-1,179
Cash flow
-9.8%
Cash-on-Cash Return
3.4%
Cap rate
0.4%
Rent to Value Ratio
Active
$299,000
4
bds
|
2
ba
|
0
sqft
|
built
1996
402 Forest Ln, Ridgeland, MS 39157
$105
Cash flow
1.8%
Cash-on-Cash Return
6.1%
Cap rate
0.8%
Rent to Value Ratio
Active
$1,100,000
4
bds
|
4
ba
|
0
sqft
|
built
2007
410 Cole Rd, Mendenhall, MS 39114
$-1,753
Cash flow
-8.3%
Cash-on-Cash Return
3.8%
Cap rate
0.5%
Rent to Value Ratio
Active
$27,500
3
bds
|
1
ba
|
0
sqft
|
built
1960
425 Windsor Dr, Jackson, MS 39209
$761
Cash flow
32.2%
Cash-on-Cash Return
33.2%
Cap rate
4.4%
Rent to Value Ratio
Active
$529,000
5
bds
|
5
ba
|
0
sqft
|
built
2005
4655 Bonne Terre Dr, Nesbit, MS 38651
$-378
Cash flow
-3.7%
Cash-on-Cash Return
4.8%
Cap rate
0.7%
Rent to Value Ratio

Active
$32,999
3
bds
|
2
ba
|
0
sqft
|
built
1969
214 Merrimack St, Jackson, MS 39209
$606
Cash flow
21.4%
Cash-on-Cash Return
22.0%
Cap rate
3.0%
Rent to Value Ratio