Mississippi Investment Properties for Sale
Browse homes for sale and investment properties in Mississippi. Refine your search by price, property type, or more.
Best cash flowing properties in Mississippi
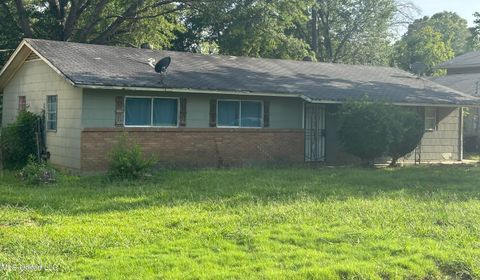
Active
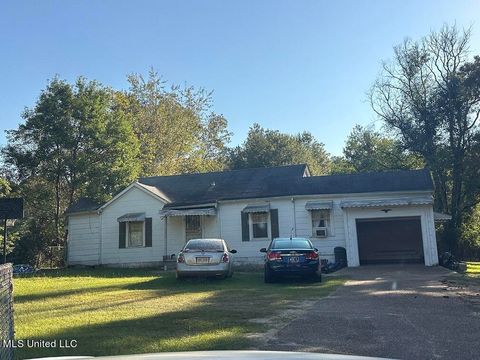
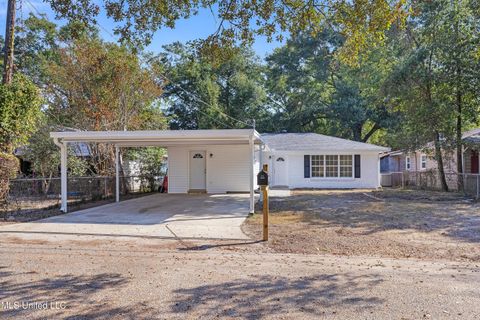
$36,900
3
bds
|
2
ba
|
0
sqft
|
built
1960
132 Sanatorium Rd, Mendenhall, MS 39114
$826
Cash flow
26.1%
Cash-on-Cash Return
26.9%
Cap rate
3.5%
Rent to Value Ratio
Active
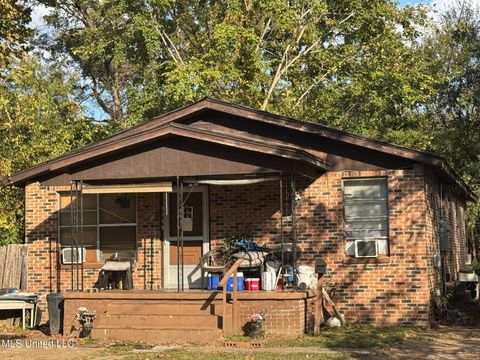
$50,000
3
bds
|
1
ba
|
0
sqft
|
built
1952
624 W Hillsdale Dr, Jackson, MS 39209
$724
Cash flow
16.9%
Cash-on-Cash Return
17.4%
Cap rate
2.2%
Rent to Value Ratio
2,679 out of 4,559 properties for sale in Mississippi
Limited Results Shown
Create a free account, or log in to reveal all property listings and enjoy the complete experience.
Active
$239,911
4
bds
|
2
ba
|
0
sqft
|
built
1930
3508 11th St, Gulfport, MS 39501
$350
Cash flow
7.6%
Cash-on-Cash Return
7.4%
Cap rate
0.9%
Rent to Value Ratio
Active
$285,000
4
bds
|
3
ba
|
0
sqft
|
built
1970
16 Nottingham Cir, Gulfport, MS 39503
$2
Cash flow
0.0%
Cash-on-Cash Return
5.7%
Cap rate
0.8%
Rent to Value Ratio
Active
$184,900
3
bds
|
2
ba
|
0
sqft
|
built
1960
2602 Kenneth Ave, Gulfport, MS 39501
$291
Cash flow
8.2%
Cash-on-Cash Return
7.6%
Cap rate
1.0%
Rent to Value Ratio
Active
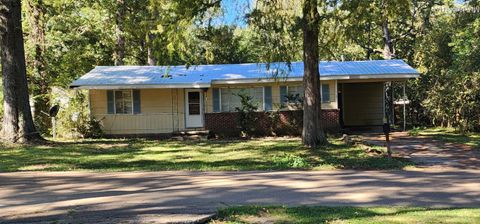
$45,000
3
bds
|
2
ba
|
0
sqft
|
built
1950
2122 Mobile Ave, Jackson, MS 39213
$566
Cash flow
14.7%
Cash-on-Cash Return
15.1%
Cap rate
2.0%
Rent to Value Ratio

Active
$1,250,000
4
bds
|
3
ba
|
0
sqft
|
built
2003
770 Destiny Plantation Blvd, Biloxi, MS 39532
$-2,960
Cash flow
-12.4%
Cash-on-Cash Return
2.8%
Cap rate
0.4%
Rent to Value Ratio

Active
$589,000
4
bds
|
2
ba
|
0
sqft
|
built
1972
126 Rue Magnolia, Biloxi, MS 39530
$-995
Cash flow
-8.8%
Cash-on-Cash Return
3.7%
Cap rate
0.5%
Rent to Value Ratio
Active
$53,500
3
bds
|
1
ba
|
0
sqft
|
built
1954
3327 Rickay Dr, Jackson, MS 39212
$674
Cash flow
14.7%
Cash-on-Cash Return
15.1%
Cap rate
2.1%
Rent to Value Ratio
Active
$160,000
1
bds
|
1
ba
|
0
sqft
|
built
1965
3620 Councils Ford Cv, Hernando, MS 38632
$332
Cash flow
10.8%
Cash-on-Cash Return
8.2%
Cap rate
1.0%
Rent to Value Ratio

Active
$449,500
5
bds
|
4
ba
|
0
sqft
|
built
1987
300 Monterey Dr, Clinton, MS 39056
$-523
Cash flow
-6.1%
Cash-on-Cash Return
4.3%
Cap rate
0.7%
Rent to Value Ratio
Active
$50,000
3
bds
|
1
ba
|
0
sqft
|
built
1952
624 W Hillsdale Dr, Jackson, MS 39209
$724
Cash flow
16.9%
Cash-on-Cash Return
17.4%
Cap rate
2.2%
Rent to Value Ratio

Active
$385,000
4
bds
|
4
ba
|
0
sqft
|
built
2000
1024 S Pat Harrison Dr, Crystal Springs, MS 39059
$15
Cash flow
0.2%
Cash-on-Cash Return
5.7%
Cap rate
0.7%
Rent to Value Ratio

Active
$469,500
4
bds
|
3
ba
|
0
sqft
|
built
2014
4 Mallard Xing, Raymond, MS 39154
$-32
Cash flow
-0.4%
Cash-on-Cash Return
5.6%
Cap rate
0.8%
Rent to Value Ratio

Active
$210,900
3
bds
|
2
ba
|
0
sqft
|
built
2004
2215 Brookside St, Gautier, MS 39553
$213
Cash flow
5.3%
Cash-on-Cash Return
6.9%
Cap rate
0.9%
Rent to Value Ratio

Active
$329,000
4
bds
|
3
ba
|
0
sqft
|
built
2009
532 Busick Well Rd, Brandon, MS 39042
$-29
Cash flow
-0.5%
Cash-on-Cash Return
5.6%
Cap rate
0.8%
Rent to Value Ratio
Active
$175,000
3
bds
|
2
ba
|
0
sqft
|
built
1981
2109 Briargate Dr, Gautier, MS 39553
$245
Cash flow
7.3%
Cash-on-Cash Return
7.4%
Cap rate
1.0%
Rent to Value Ratio

Active
$740,000
4
bds
|
4
ba
|
0
sqft
|
built
2009
111 Barkley Dr, Pass Christian, MS 39571
$-1,410
Cash flow
-9.9%
Cash-on-Cash Return
3.4%
Cap rate
0.5%
Rent to Value Ratio

Active
$499,900
5
bds
|
5
ba
|
0
sqft
|
built
1993
3555 Bonner Dr, Olive Branch, MS 38654
$-172
Cash flow
-1.8%
Cash-on-Cash Return
5.3%
Cap rate
0.7%
Rent to Value Ratio
Active
$475,000
2
bds
|
3
ba
|
0
sqft
|
built
1950
100 Hickory Ln, Bay Saint Louis, MS 39520
$-758
Cash flow
-8.3%
Cash-on-Cash Return
3.8%
Cap rate
0.5%
Rent to Value Ratio

Active
$209,000
3
bds
|
2
ba
|
0
sqft
|
built
1977
640 Peyton Dr, Biloxi, MS 39530
$115
Cash flow
2.9%
Cash-on-Cash Return
6.3%
Cap rate
0.9%
Rent to Value Ratio

Active
$427,800
3
bds
|
3
ba
|
0
sqft
|
built
2006
106 Pine Ridge Dr, Canton, MS 39046
$-36
Cash flow
-0.4%
Cash-on-Cash Return
5.6%
Cap rate
0.7%
Rent to Value Ratio

Active
$465,000
2
bds
|
1
ba
|
0
sqft
|
built
1980
253 Sycamore St, Bay Saint Louis, MS 39520
$-601
Cash flow
-6.7%
Cash-on-Cash Return
4.1%
Cap rate
0.5%
Rent to Value Ratio
Active
$36,900
3
bds
|
2
ba
|
0
sqft
|
built
1960
132 Sanatorium Rd, Mendenhall, MS 39114
$826
Cash flow
26.1%
Cash-on-Cash Return
26.9%
Cap rate
3.5%
Rent to Value Ratio

Active
$229,500
3
bds
|
3
ba
|
0
sqft
|
built
2007
1201 Century Oaks Dr, Gulfport, MS 39507
$155
Cash flow
3.5%
Cash-on-Cash Return
6.5%
Cap rate
0.9%
Rent to Value Ratio

Active
$574,900
5
bds
|
4
ba
|
0
sqft
|
built
1983
3848 Windermere Rd N, Nesbit, MS 38651
$-409
Cash flow
-3.7%
Cash-on-Cash Return
4.8%
Cap rate
0.6%
Rent to Value Ratio
Active
$925,000
5
bds
|
5
ba
|
0
sqft
|
built
2016
213 Ironwood Plantation Blvd, Madison, MS 39110
$-1,437
Cash flow
-8.1%
Cash-on-Cash Return
3.8%
Cap rate
0.6%
Rent to Value Ratio
Active
$775,000
3
bds
|
4
ba
|
0
sqft
|
built
1978
308 Lovers Ln, Ocean Springs, MS 39564
$-1,682
Cash flow
-11.3%
Cash-on-Cash Return
3.1%
Cap rate
0.5%
Rent to Value Ratio

Active
$338,000
4
bds
|
3
ba
|
0
sqft
|
built
1984
512 Dixton Dr, Brandon, MS 39047
$174
Cash flow
2.7%
Cash-on-Cash Return
6.3%
Cap rate
0.8%
Rent to Value Ratio
Active
$259,000
4
bds
|
3
ba
|
0
sqft
|
built
1965
1710 Bates St, Pascagoula, MS 39581
$226
Cash flow
4.6%
Cash-on-Cash Return
6.7%
Cap rate
1.0%
Rent to Value Ratio

Active
$24,000
2
bds
|
1
ba
|
0
sqft
|
built
1950
2107 Mobile Ave, Jackson, MS 39213
$515
Cash flow
25.0%
Cash-on-Cash Return
25.8%
Cap rate
3.3%
Rent to Value Ratio

Active
$459,000
4
bds
|
3
ba
|
0
sqft
|
built
2009
500 John Baptiste St, Bay Saint Louis, MS 39520
$-380
Cash flow
-4.3%
Cash-on-Cash Return
4.7%
Cap rate
0.7%
Rent to Value Ratio
Active
$51,500
2
bds
|
1
ba
|
0
sqft
|
built
1938
742 Brandon Ave, Jackson, MS 39209
$699
Cash flow
15.8%
Cash-on-Cash Return
16.3%
Cap rate
2.1%
Rent to Value Ratio
Active
$575,000
3
bds
|
3
ba
|
0
sqft
|
built
2007
2668 Beach Blvd, Biloxi, MS 39531
$-1,823
Cash flow
-16.5%
Cash-on-Cash Return
1.9%
Cap rate
0.6%
Rent to Value Ratio

Active
$389,900
4
bds
|
3
ba
|
0
sqft
|
built
2006
117 Dortch Rd, Pearl, MS 39208
$-172
Cash flow
-2.3%
Cash-on-Cash Return
5.1%
Cap rate
0.7%
Rent to Value Ratio

Active
$494,900
5
bds
|
5
ba
|
0
sqft
|
built
1996
7738 Windersgate Cir, Olive Branch, MS 38654
$-414
Cash flow
-4.4%
Cash-on-Cash Return
4.7%
Cap rate
0.6%
Rent to Value Ratio

Active
$344,900
2
bds
|
2
ba
|
0
sqft
|
built
2007
1200 Beach Dr, Gulfport, MS 39507
$-1,006
Cash flow
-15.2%
Cash-on-Cash Return
2.2%
Cap rate
0.8%
Rent to Value Ratio
Active
$2,800,000
4
bds
|
6
ba
|
0
sqft
|
built
2001
104 Spanish Point Rd, Ocean Springs, MS 39564
$-9,938
Cash flow
-18.5%
Cash-on-Cash Return
1.4%
Cap rate
0.2%
Rent to Value Ratio
Active
$37,500
3
bds
|
2
ba
|
0
sqft
|
built
1970
5505 Delmonico Dr, Jackson, MS 39209
$665
Cash flow
20.7%
Cash-on-Cash Return
21.3%
Cap rate
2.9%
Rent to Value Ratio
Active
$2,000,000
6
bds
|
8
ba
|
0
sqft
|
built
2008
3375 N Ratliff Rd, Jackson, MS 39209
$-6,613
Cash flow
-17.3%
Cash-on-Cash Return
1.7%
Cap rate
0.3%
Rent to Value Ratio
Active
$29,000
3
bds
|
1
ba
|
0
sqft
|
built
1959
212 Gaylyn Ave, Jackson, MS 39209
$556
Cash flow
22.3%
Cash-on-Cash Return
23.0%
Cap rate
3.1%
Rent to Value Ratio
Active
$549,000
4
bds
|
2
ba
|
0
sqft
|
built
2020
4070 S Sumatra St, Bay Saint Louis, MS 39520
$-708
Cash flow
-6.7%
Cash-on-Cash Return
4.1%
Cap rate
0.6%
Rent to Value Ratio