Mississippi Investment Properties for Sale
Browse homes for sale and investment properties in Mississippi. Refine your search by price, property type, or more.
Best cash flowing properties in Mississippi
Active
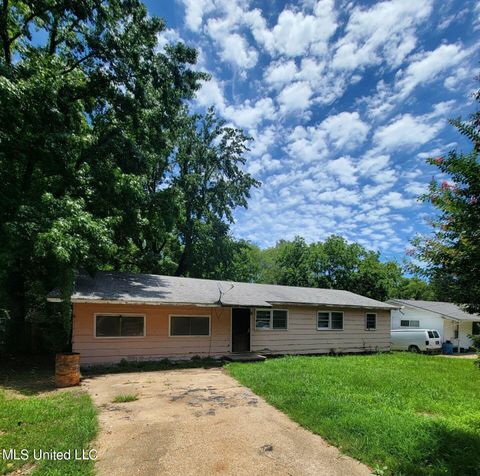
$55,000
4
bds
|
2
ba
|
0
sqft
|
built
1955
1020 Capri Cir, Jackson, MS 39209
$797
Cash flow
16.9%
Cash-on-Cash Return
17.4%
Cap rate
2.4%
Rent to Value Ratio
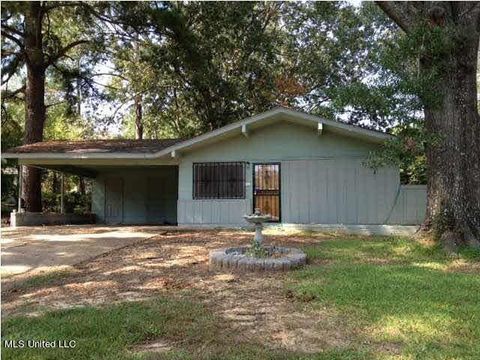
Active
$48,000
3
bds
|
2
ba
|
0
sqft
|
built
1960
237 Queen Anne Ln, Jackson, MS 39209
$737
Cash flow
17.9%
Cash-on-Cash Return
18.4%
Cap rate
2.5%
Rent to Value Ratio
2,679 out of 4,559 properties for sale in Mississippi
Limited Results Shown
Create a free account, or log in to reveal all property listings and enjoy the complete experience.

Active
$250,000
3
bds
|
2
ba
|
0
sqft
|
built
1965
174 Oakmont Pl, Biloxi, MS 39531
$58
Cash flow
1.2%
Cash-on-Cash Return
6.0%
Cap rate
0.7%
Rent to Value Ratio
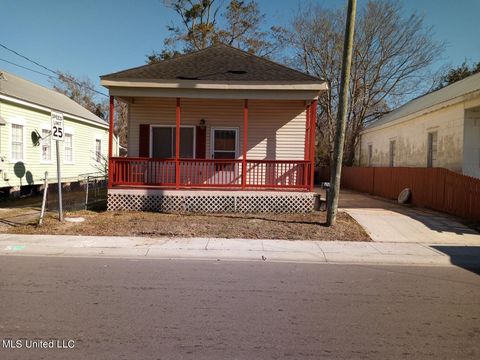
Active
$95,000
3
bds
|
2
ba
|
0
sqft
|
built
1909
258 Reynoir St, Biloxi, MS 39530
$560
Cash flow
30.8%
Cash-on-Cash Return
12.8%
Cap rate
1.7%
Rent to Value Ratio

Active
$250,000
3
bds
|
1
ba
|
0
sqft
|
built
1961
154 Oakmont Pl, Biloxi, MS 39531
$-133
Cash flow
-2.8%
Cash-on-Cash Return
5.0%
Cap rate
0.7%
Rent to Value Ratio

Active
$265,900
3
bds
|
3
ba
|
0
sqft
|
built
2004
18123 Lake Vista Dr, Gulfport, MS 39503
$154
Cash flow
3.0%
Cash-on-Cash Return
6.4%
Cap rate
0.9%
Rent to Value Ratio
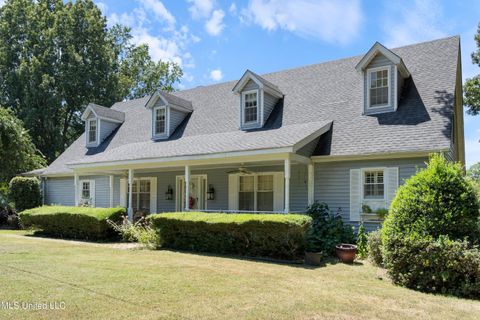
Active
$499,900
4
bds
|
3
ba
|
0
sqft
|
built
1985
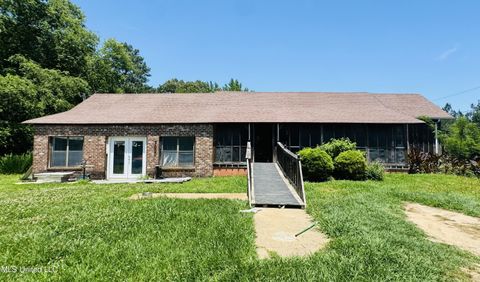
251 Callicott Dr, Coldwater, MS 38618
$-84
Cash flow
-0.9%
Cash-on-Cash Return
5.5%
Cap rate
0.7%
Rent to Value Ratio
Active
$308,000
4
bds
|
3
ba
|
0
sqft
|
built
2005
2616 Shelby Ln, Ocean Springs, MS 39564
$-90
Cash flow
-1.5%
Cash-on-Cash Return
5.3%
Cap rate
0.7%
Rent to Value Ratio

Active
$350,000
3
bds
|
2
ba
|
0
sqft
|
built
1991
106 Piney Ridge Rd, Waveland, MS 39576
$-58
Cash flow
-0.9%
Cash-on-Cash Return
5.5%
Cap rate
0.7%
Rent to Value Ratio

Active
$389,000
4
bds
|
3
ba
|
0
sqft
|
built
1960
1980 Washington St, Bay Saint Louis, MS 39520
$-71
Cash flow
-1.0%
Cash-on-Cash Return
5.5%
Cap rate
0.7%
Rent to Value Ratio

Active
$115,000
3
bds
|
2
ba
|
0
sqft
|
built
2008
6316 W Adams St, Bay Saint Louis, MS 39520
$314
Cash flow
14.2%
Cash-on-Cash Return
9.0%
Cap rate
1.2%
Rent to Value Ratio

Active
$1,198,000
3
bds
|
4
ba
|
0
sqft
|
built
2010
145 Republic St, Madison, MS 39110
$-2,734
Cash flow
-11.9%
Cash-on-Cash Return
2.9%
Cap rate
0.4%
Rent to Value Ratio

Active
$594,999
3
bds
|
3
ba
|
0
sqft
|
built
2011
113 Chestnut Dr, Clinton, MS 39056
$-666
Cash flow
-5.8%
Cash-on-Cash Return
4.3%
Cap rate
0.6%
Rent to Value Ratio

Active
$135,000
bds
|
1
ba
|
0
sqft
|
built
1967
1664 Beach Blvd, Biloxi, MS 39531
$-144
Cash flow
-5.6%
Cash-on-Cash Return
4.4%
Cap rate
0.7%
Rent to Value Ratio

Active
$259,000
4
bds
|
3
ba
|
0
sqft
|
built
1971
603 Herndon Hl, Clinton, MS 39056
$164
Cash flow
3.3%
Cash-on-Cash Return
6.4%
Cap rate
0.9%
Rent to Value Ratio
Active
$599,000
4
bds
|
5
ba
|
0
sqft
|
built
2003
6105 Mary Mahoney Dr, Ocean Springs, MS 39564
$-660
Cash flow
-5.7%
Cash-on-Cash Return
4.4%
Cap rate
0.6%
Rent to Value Ratio

Active
$238,000
3
bds
|
3
ba
|
0
sqft
|
built
1966
331 Big Lake Rd, Biloxi, MS 39531
$23
Cash flow
0.5%
Cash-on-Cash Return
5.8%
Cap rate
0.8%
Rent to Value Ratio
Active
$149,900
3
bds
|
1
ba
|
0
sqft
|
built
1956
2205 Oak Ave, Gulfport, MS 39507
$294
Cash flow
10.2%
Cash-on-Cash Return
8.0%
Cap rate
1.1%
Rent to Value Ratio

Active
$269,000
3
bds
|
2
ba
|
0
sqft
|
built
2005
10167 Lagan St, Bay Saint Louis, MS 39520
$-204
Cash flow
-4.0%
Cash-on-Cash Return
4.8%
Cap rate
0.7%
Rent to Value Ratio
Active
$281,000
4
bds
|
2
ba
|
0
sqft
|
built
2022
3500 N 9th St, Ocean Springs, MS 39564
$-10
Cash flow
-0.2%
Cash-on-Cash Return
5.6%
Cap rate
0.8%
Rent to Value Ratio
Active
$180,000
3
bds
|
2
ba
|
0
sqft
|
built
1930
137 Lloyd Blue Dr, Mendenhall, MS 39114
$495
Cash flow
14.3%
Cash-on-Cash Return
9.0%
Cap rate
1.1%
Rent to Value Ratio

Active
$199,800
3
bds
|
2
ba
|
0
sqft
|
built
1976
1716 Saint Mary St, Jackson, MS 39202
$-163
Cash flow
-4.3%
Cash-on-Cash Return
4.7%
Cap rate
0.8%
Rent to Value Ratio

Active
$262,000
3
bds
|
2
ba
|
0
sqft
|
built
2007
107 Highbury Cv, Canton, MS 39046
$32
Cash flow
0.6%
Cash-on-Cash Return
5.8%
Cap rate
0.8%
Rent to Value Ratio
Active
$999,000
4
bds
|
6
ba
|
0
sqft
|
built
2007
5550 Springridge Rd, Raymond, MS 39154
$-2,071
Cash flow
-10.8%
Cash-on-Cash Return
3.2%
Cap rate
0.5%
Rent to Value Ratio
Active
$2,490,000
3
bds
|
4
ba
|
0
sqft
|
built
2019
922 E Beach Blvd, Gulfport, MS 39501
$-8,251
Cash flow
-17.3%
Cash-on-Cash Return
1.7%
Cap rate
0.3%
Rent to Value Ratio

Active
$975,000
4
bds
|
3
ba
|
0
sqft
|
built
1875
1096 Beach Blvd, Biloxi, MS 39530
$-1,801
Cash flow
-9.6%
Cash-on-Cash Return
3.5%
Cap rate
0.5%
Rent to Value Ratio
Active
$125,000
3
bds
|
2
ba
|
0
sqft
|
built
1965
201 S Jadek Dr NE, Magee, MS 39111
$374
Cash flow
15.6%
Cash-on-Cash Return
9.3%
Cap rate
1.1%
Rent to Value Ratio

Active
$1,499,900
5
bds
|
5
ba
|
0
sqft
|
built
2002
106 Cove Ln, Madison, MS 39110
$-3,691
Cash flow
-12.8%
Cash-on-Cash Return
2.7%
Cap rate
0.4%
Rent to Value Ratio

Active
$299,000
1
bds
|
2
ba
|
0
sqft
|
built
1975
10253 Avenue D, Bay Saint Louis, MS 39520
$-53
Cash flow
-0.9%
Cash-on-Cash Return
5.5%
Cap rate
0.7%
Rent to Value Ratio

Active
$125,000
3
bds
|
2
ba
|
0
sqft
|
built
2000
2815 57th Ave, Gulfport, MS 39501
$288
Cash flow
12.0%
Cash-on-Cash Return
8.4%
Cap rate
1.1%
Rent to Value Ratio
Active
$415,000
2
bds
|
1
ba
|
0
sqft
|
built
2013
1314 Ashley Rd, Brandon, MS 39042
$-885
Cash flow
-11.1%
Cash-on-Cash Return
3.1%
Cap rate
0.4%
Rent to Value Ratio

Active
$699,000
4
bds
|
2
ba
|
0
sqft
|
built
1950
111 Bay View Ct, Bay Saint Louis, MS 39520
$-1,070
Cash flow
-8.0%
Cash-on-Cash Return
3.8%
Cap rate
0.5%
Rent to Value Ratio
Active
$350,000
3
bds
|
3
ba
|
0
sqft
|
built
1982
6371 Shawnee St, Kiln, MS 39556
$-131
Cash flow
-2.0%
Cash-on-Cash Return
5.2%
Cap rate
0.7%
Rent to Value Ratio
Active
$250,000
3
bds
|
2
ba
|
0
sqft
|
built
1990
134 Brookwood Dr, Flora, MS 39071
$140
Cash flow
2.9%
Cash-on-Cash Return
6.4%
Cap rate
0.8%
Rent to Value Ratio
Active
$55,000
4
bds
|
2
ba
|
0
sqft
|
built
1955
1020 Capri Cir, Jackson, MS 39209
$797
Cash flow
16.9%
Cash-on-Cash Return
17.4%
Cap rate
2.4%
Rent to Value Ratio
Active
$625,000
3
bds
|
4
ba
|
0
sqft
|
built
1988
7235 Davidson Rd, Olive Branch, MS 38654
$-508
Cash flow
-4.2%
Cash-on-Cash Return
4.7%
Cap rate
0.6%
Rent to Value Ratio
Active
$48,000
3
bds
|
2
ba
|
0
sqft
|
built
1960
237 Queen Anne Ln, Jackson, MS 39209
$737
Cash flow
17.9%
Cash-on-Cash Return
18.4%
Cap rate
2.5%
Rent to Value Ratio
Active
$799,000
4
bds
|
4
ba
|
0
sqft
|
built
1998
169 Ways Way, Madison, MS 39110
$-1,022
Cash flow
-6.7%
Cash-on-Cash Return
4.1%
Cap rate
0.6%
Rent to Value Ratio

Active
$419,900
3
bds
|
2
ba
|
0
sqft
|
built
2021
156 Markham Dr, Gulfport, MS 39507
$182
Cash flow
2.3%
Cash-on-Cash Return
6.2%
Cap rate
0.8%
Rent to Value Ratio

Active
$1,060,000
5
bds
|
5
ba
|
0
sqft
|
built
2001
125 Bridgewater Xing, Ridgeland, MS 39157
$-2,244
Cash flow
-11.0%
Cash-on-Cash Return
3.1%
Cap rate
0.5%
Rent to Value Ratio
Active
$10,000
2
bds
|
1
ba
|
0
sqft
|
built
1950
919 Winn St, Jackson, MS 39204
$496
Cash flow
57.8%
Cash-on-Cash Return
59.5%
Cap rate
8.0%
Rent to Value Ratio
Active
$221,500
3
bds
|
2
ba
|
0
sqft
|
built
1968
1206 Shady Glen Dr, Clinton, MS 39056
$108
Cash flow
2.5%
Cash-on-Cash Return
6.3%
Cap rate
0.8%
Rent to Value Ratio