Mississippi Investment Properties for Sale
Browse homes for sale and investment properties in Mississippi. Refine your search by price, property type, or more.
Best cash flowing properties in Mississippi

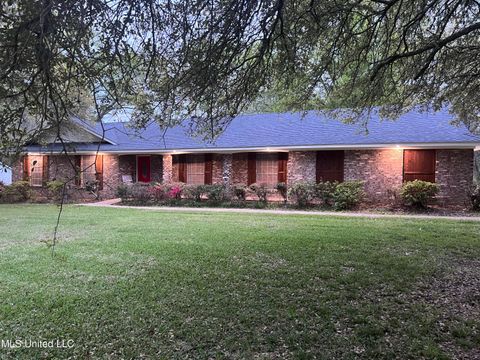
Active
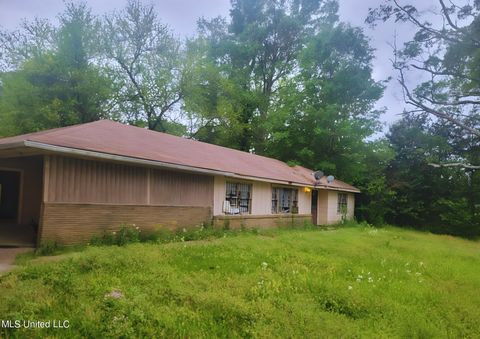
$47,000
3
bds
|
2
ba
|
0
sqft
|
built
1958
720 Winn St, Jackson, MS 39204
$784
Cash flow
19.4%
Cash-on-Cash Return
20.0%
Cap rate
2.8%
Rent to Value Ratio
Active
$48,500
3
bds
|
2
ba
|
0
sqft
|
built
1956
3927 Faulk Blvd, Jackson, MS 39209
$716
Cash flow
17.2%
Cash-on-Cash Return
17.7%
Cap rate
2.5%
Rent to Value Ratio
2,679 out of 4,559 properties for sale in Mississippi
Limited Results Shown
Create a free account, or log in to reveal all property listings and enjoy the complete experience.

Active
$439,999
4
bds
|
3
ba
|
0
sqft
|
built
2016
7444 N Aberdeen Dr, Pass Christian, MS 39571
$-292
Cash flow
-3.5%
Cash-on-Cash Return
4.9%
Cap rate
0.7%
Rent to Value Ratio

Active
$374,930
2
bds
|
2
ba
|
0
sqft
|
built
2007
2668 Beach Blvd, Biloxi, MS 39531
$-1,415
Cash flow
-19.7%
Cash-on-Cash Return
1.1%
Cap rate
0.6%
Rent to Value Ratio

Active
$354,900
2
bds
|
2
ba
|
0
sqft
|
built
2007
2668 Beach Blvd, Biloxi, MS 39531
$-705
Cash flow
-10.4%
Cash-on-Cash Return
3.3%
Cap rate
0.9%
Rent to Value Ratio

Active
$555,000
3
bds
|
2
ba
|
0
sqft
|
built
2021
139 Hartsie Dr, Waveland, MS 39576
$-1,019
Cash flow
-9.6%
Cash-on-Cash Return
3.5%
Cap rate
0.5%
Rent to Value Ratio
Active
$378,000
4
bds
|
5
ba
|
0
sqft
|
built
1984
190 Briarwood Dr, Holly Springs, MS 38635
$-228
Cash flow
-3.1%
Cash-on-Cash Return
5.0%
Cap rate
0.8%
Rent to Value Ratio
Active
$274,900
3
bds
|
2
ba
|
0
sqft
|
built
1964
14071 Duckworth Rd, Gulfport, MS 39503
$67
Cash flow
1.3%
Cash-on-Cash Return
6.0%
Cap rate
0.7%
Rent to Value Ratio
Active
$23,000
3
bds
|
1
ba
|
0
sqft
|
built
1950
919 Combs St, Jackson, MS 39204
$562
Cash flow
28.5%
Cash-on-Cash Return
29.3%
Cap rate
3.9%
Rent to Value Ratio
Active
$215,000
5
bds
|
3
ba
|
0
sqft
|
built
1930
906 N Bennett St, Crystal Springs, MS 39059
$478
Cash flow
11.6%
Cash-on-Cash Return
8.3%
Cap rate
1.1%
Rent to Value Ratio
Active
$495,000
3
bds
|
2
ba
|
0
sqft
|
built
2021
208 Sycamore St, Bay Saint Louis, MS 39520
$-867
Cash flow
-9.1%
Cash-on-Cash Return
3.6%
Cap rate
0.5%
Rent to Value Ratio

Active
$450,000
3
bds
|
3
ba
|
0
sqft
|
built
2001
19677 Riverline Dr E, Saucier, MS 39574
$-255
Cash flow
-3.0%
Cash-on-Cash Return
5.0%
Cap rate
0.7%
Rent to Value Ratio

Active
$959,000
5
bds
|
4
ba
|
0
sqft
|
built
1921
2310 Elm St, Hernando, MS 38632
$-1,338
Cash flow
-7.3%
Cash-on-Cash Return
4.0%
Cap rate
0.5%
Rent to Value Ratio

Active
$329,900
5
bds
|
4
ba
|
0
sqft
|
built
1970
5365 River Thames Rd, Jackson, MS 39211
$17
Cash flow
0.3%
Cash-on-Cash Return
5.7%
Cap rate
0.8%
Rent to Value Ratio

Active
$44,500
3
bds
|
1
ba
|
0
sqft
|
built
1962
1614 Woody Dr, Jackson, MS 39212
$582
Cash flow
15.2%
Cash-on-Cash Return
15.7%
Cap rate
2.2%
Rent to Value Ratio

Active
$33,700
3
bds
|
2
ba
|
0
sqft
|
built
1950
1840 Willaneel Dr, Jackson, MS 39204
$609
Cash flow
21.1%
Cash-on-Cash Return
21.7%
Cap rate
3.0%
Rent to Value Ratio

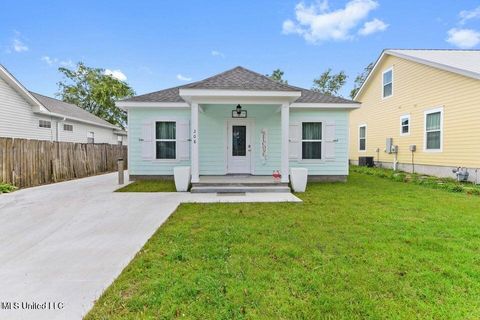
Active
$28,500
3
bds
|
1
ba
|
0
sqft
|
built
1962
1122 Mc Dowell Cir, Jackson, MS 39204
$483
Cash flow
19.7%
Cash-on-Cash Return
20.3%
Cap rate
2.8%
Rent to Value Ratio
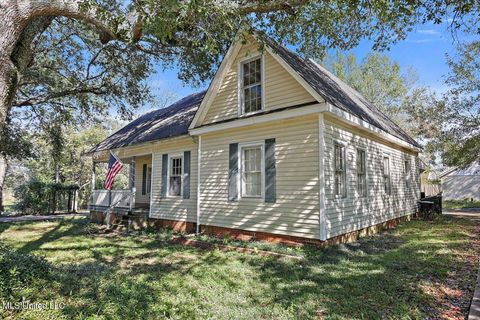
Active
$47,000
3
bds
|
2
ba
|
0
sqft
|
built
1958
720 Winn St, Jackson, MS 39204
$784
Cash flow
19.4%
Cash-on-Cash Return
20.0%
Cap rate
2.8%
Rent to Value Ratio

Active
$331,500
5
bds
|
3
ba
|
0
sqft
|
built
2022
68 Saltmeadow Cir, Ocean Springs, MS 39564
$169
Cash flow
2.7%
Cash-on-Cash Return
6.3%
Cap rate
0.8%
Rent to Value Ratio

Active
$419,900
5
bds
|
3
ba
|
0
sqft
|
built
2022
188 Byhalia Creek Farms Rd E, Byhalia, MS 38611
$-19
Cash flow
-0.2%
Cash-on-Cash Return
5.6%
Cap rate
0.7%
Rent to Value Ratio
Active
$219,900
5
bds
|
3
ba
|
0
sqft
|
built
1987
816 Chulahoma Rd, Holly Springs, MS 38635
$127
Cash flow
3.0%
Cash-on-Cash Return
6.4%
Cap rate
0.8%
Rent to Value Ratio

Active
$327,000
3
bds
|
2
ba
|
0
sqft
|
built
2011
128 Amethyst Ln, Brandon, MS 39047
$36
Cash flow
0.6%
Cash-on-Cash Return
5.8%
Cap rate
0.9%
Rent to Value Ratio
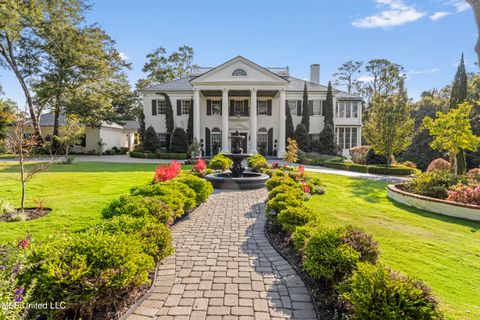
Active
$4,490,000
4
bds
|
5
ba
|
0
sqft
|
built
1978
4908 Courthouse Rd, Gulfport, MS 39507
$-19,290
Cash flow
-22.4%
Cash-on-Cash Return
0.5%
Cap rate
0.1%
Rent to Value Ratio
Active
$119,900
2
bds
|
3
ba
|
0
sqft
|
built
1980
554 Woodland Hills Pl, Jackson, MS 39216
$321
Cash flow
14.0%
Cash-on-Cash Return
8.9%
Cap rate
1.3%
Rent to Value Ratio
Active
$288,900
4
bds
|
3
ba
|
0
sqft
|
built
2022
14098 Old Mossy Trl, Gulfport, MS 39503
$-149
Cash flow
-2.7%
Cash-on-Cash Return
5.1%
Cap rate
0.8%
Rent to Value Ratio

Active
$989,000
4
bds
|
3
ba
|
0
sqft
|
built
1975
5284 W Oak Grove Rd, Hernando, MS 38632
$-2,363
Cash flow
-12.5%
Cash-on-Cash Return
2.8%
Cap rate
0.4%
Rent to Value Ratio
Active
$48,500
3
bds
|
2
ba
|
0
sqft
|
built
1956
3927 Faulk Blvd, Jackson, MS 39209
$716
Cash flow
17.2%
Cash-on-Cash Return
17.7%
Cap rate
2.5%
Rent to Value Ratio

Active
$249,000
3
bds
|
2
ba
|
0
sqft
|
built
1975
656 Mauna Loa Ct, Diamondhead, MS 39525
$291
Cash flow
6.1%
Cash-on-Cash Return
7.1%
Cap rate
0.9%
Rent to Value Ratio
Active
$14,950
3
bds
|
2
ba
|
0
sqft
|
built
1973
220 Pin Oak Dr, Jackson, MS 39213
$523
Cash flow
40.8%
Cash-on-Cash Return
42.0%
Cap rate
5.4%
Rent to Value Ratio

Active
$410,000
4
bds
|
4
ba
|
0
sqft
|
built
1989
503 Bay Pointe Cv, Brandon, MS 39047
$35
Cash flow
0.4%
Cash-on-Cash Return
5.8%
Cap rate
0.9%
Rent to Value Ratio
Active
$289,000
4
bds
|
2
ba
|
0
sqft
|
built
1930
325 W Chulahoma Ave, Holly Springs, MS 38635
$242
Cash flow
4.4%
Cash-on-Cash Return
6.7%
Cap rate
0.9%
Rent to Value Ratio

Active
$634,900
5
bds
|
4
ba
|
0
sqft
|
built
2003
8679 Saddlecreek Dr, Olive Branch, MS 38654
$-634
Cash flow
-5.2%
Cash-on-Cash Return
4.5%
Cap rate
0.6%
Rent to Value Ratio
Active
$299,900
4
bds
|
3
ba
|
0
sqft
|
built
1970
6133 N Mc Raven Rd, Jackson, MS 39209
$268
Cash flow
4.7%
Cash-on-Cash Return
6.8%
Cap rate
0.9%
Rent to Value Ratio
Active
$299,999
3
bds
|
2
ba
|
0
sqft
|
built
1970
3221 Nottingham Rd, Ocean Springs, MS 39564
$261
Cash flow
4.5%
Cash-on-Cash Return
6.7%
Cap rate
0.8%
Rent to Value Ratio
Active
$184,900
3
bds
|
2
ba
|
0
sqft
|
built
1960
1602 Sunset St, Pascagoula, MS 39567
$96
Cash flow
2.7%
Cash-on-Cash Return
6.3%
Cap rate
0.9%
Rent to Value Ratio

Active
$245,000
2
bds
|
2
ba
|
0
sqft
|
built
2006
2421 Beachview Dr, Ocean Springs, MS 39564
$-411
Cash flow
-8.8%
Cash-on-Cash Return
3.7%
Cap rate
0.8%
Rent to Value Ratio

Active
$999,500
4
bds
|
4
ba
|
4,336
sqft
|
built
2001
23554 Woodland Way, Pass Christian, MS 39571
$-1,970
Cash flow
-10.3%
Cash-on-Cash Return
3.3%
Cap rate
0.4%
Rent to Value Ratio

Active
$289,000
2
bds
|
2
ba
|
0
sqft
|
built
1982
2046 Beach Blvd, Biloxi, MS 39531
$-385
Cash flow
-7.0%
Cash-on-Cash Return
4.1%
Cap rate
0.6%
Rent to Value Ratio

Active
$1,799,500
5
bds
|
5
ba
|
0
sqft
|
built
2008
102 Bridgewater Xing, Ridgeland, MS 39157
$-5,466
Cash flow
-15.8%
Cash-on-Cash Return
2.0%
Cap rate
0.3%
Rent to Value Ratio
Active
$208,500
3
bds
|
3
ba
|
0
sqft
|
built
1975
5142 1st Ave, Bay Saint Louis, MS 39520
$199
Cash flow
5.0%
Cash-on-Cash Return
6.8%
Cap rate
0.9%
Rent to Value Ratio

Active
$349,000
3
bds
|
2
ba
|
0
sqft
|
built
2017
601 Emerald Ct, Brandon, MS 39047
$249
Cash flow
3.7%
Cash-on-Cash Return
6.5%
Cap rate
0.8%
Rent to Value Ratio
Active
$649,000
4
bds
|
4
ba
|
0
sqft
|
built
1983
7170 Country Oak Dr, Southaven, MS 38672
$-339
Cash flow
-2.7%
Cash-on-Cash Return
5.1%
Cap rate
0.7%
Rent to Value Ratio