Nesbit, MS Investment Properties for Sale
Browse homes for sale and investment properties in Nesbit, MS. Refine your search by price, property type, or more.
Best cash flowing properties in Nesbit, MS
Active
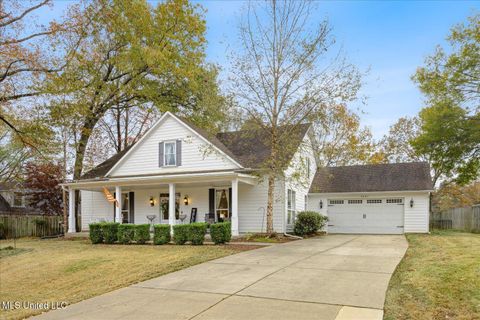
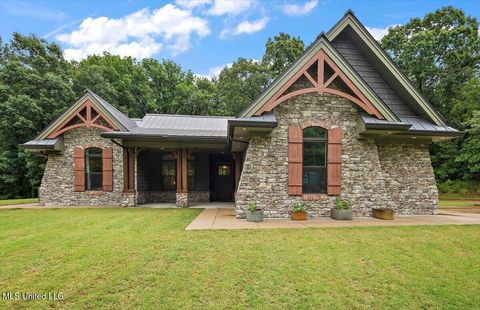
$385,000
4
bds
|
3
ba
|
0
sqft
|
built
2014
4041 Los Padres Dr, Nesbit, MS 38651
$72
Cash flow
1.0%
Cash-on-Cash Return
5.9%
Cap rate
0.8%
Rent to Value Ratio
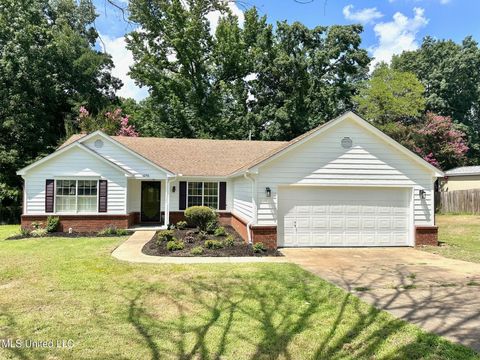
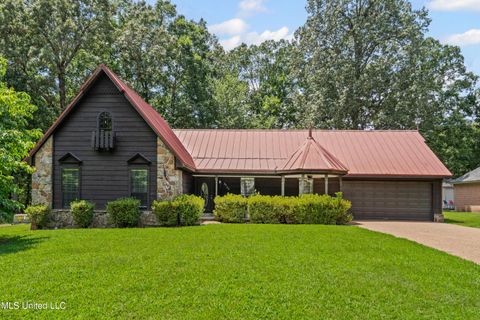
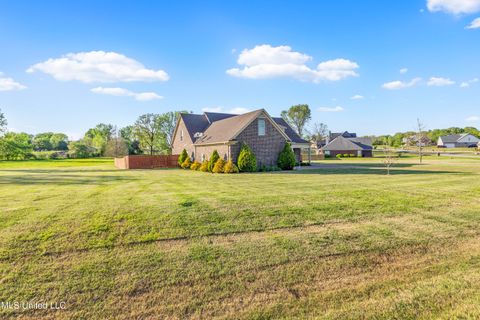
Active
$299,900
3
bds
|
2
ba
|
0
sqft
|
built
1994
4292 Star Landing Rd E, Nesbit, MS 38651
$38
Cash flow
0.7%
Cash-on-Cash Return
5.8%
Cap rate
0.7%
Rent to Value Ratio
17 out of 23 properties for sale in Nesbit, MS
Limited Results Shown
Create a free account, or log in to reveal all property listings and enjoy the complete experience.

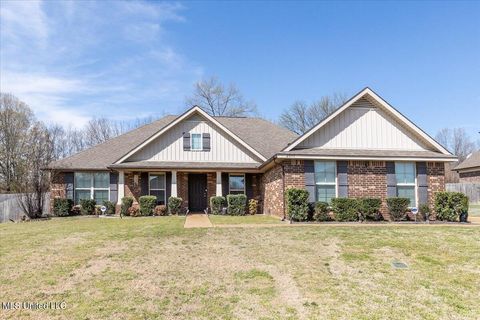
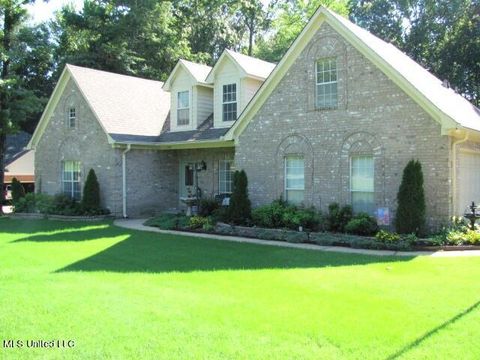
Active
$409,900
5
bds
|
3
ba
|
0
sqft
|
built
2004
2210 Westwind Dr, Nesbit, MS 38651
$-272
Cash flow
-3.5%
Cash-on-Cash Return
4.9%
Cap rate
0.6%
Rent to Value Ratio
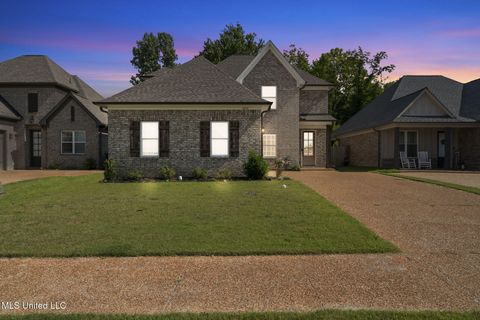
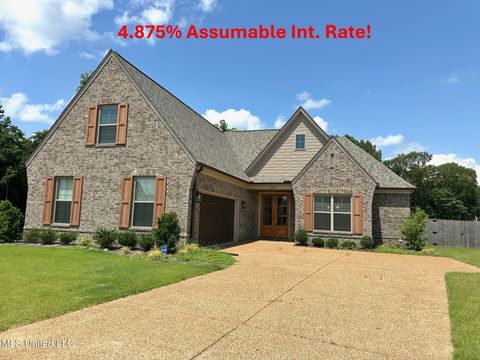
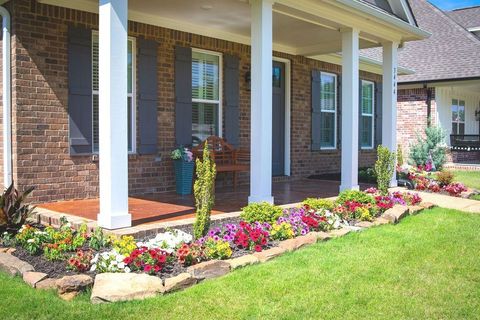
Active
$349,900
3
bds
|
2
ba
|
0
sqft
|
built
2015
2095 Great Barrington Pl, Nesbit, MS 38651
$-261
Cash flow
-3.9%
Cash-on-Cash Return
4.8%
Cap rate
0.7%
Rent to Value Ratio
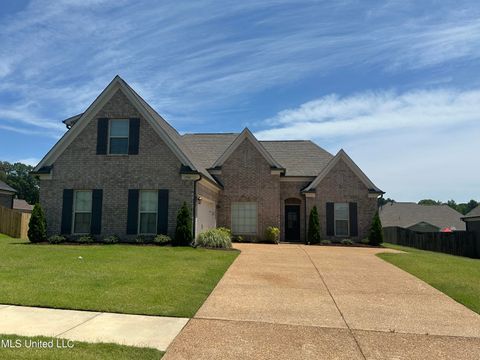
Active
$409,900
4
bds
|
3
ba
|
0
sqft
|
built
2022
5252 Watson View Dr, Nesbit, MS 38651
$-140
Cash flow
-1.8%
Cash-on-Cash Return
5.3%
Cap rate
0.7%
Rent to Value Ratio
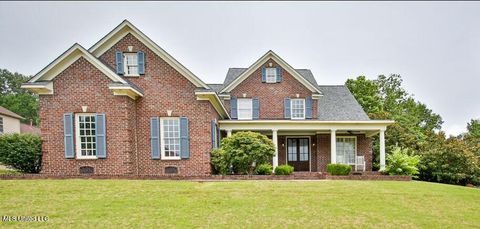
Active
$299,900
3
bds
|
2
ba
|
0
sqft
|
built
1988
2403 Geneva Dr, Nesbit, MS 38651
$-44
Cash flow
-0.8%
Cash-on-Cash Return
5.5%
Cap rate
0.7%
Rent to Value Ratio
Active
$429,900
4
bds
|
3
ba
|
0
sqft
|
built
2023
2968 Piper Cv, Nesbit, MS 38651
$27
Cash flow
0.3%
Cash-on-Cash Return
5.8%
Cap rate
0.7%
Rent to Value Ratio
Active
$367,900
4
bds
|
2
ba
|
0
sqft
|
built
2022
1914 Ava Dr, Nesbit, MS 38651
$-538
Cash flow
-7.6%
Cash-on-Cash Return
3.9%
Cap rate
0.6%
Rent to Value Ratio

Active
$414,000
5
bds
|
3
ba
|
0
sqft
|
built
2012
1668 Farindale Cv, Nesbit, MS 38651
$-188
Cash flow
-2.4%
Cash-on-Cash Return
5.1%
Cap rate
0.7%
Rent to Value Ratio
Active
$549,500
5
bds
|
3
ba
|
0
sqft
|
built
2004
2948 Grove Meadow Dr, Nesbit, MS 38651
$-539
Cash flow
-5.1%
Cash-on-Cash Return
4.5%
Cap rate
0.7%
Rent to Value Ratio
Active
$749,900
4
bds
|
4
ba
|
0
sqft
|
built
2017
4676 Star Landing Rd W, Nesbit, MS 38651
$-1,981
Cash flow
-13.8%
Cash-on-Cash Return
2.5%
Cap rate
0.3%
Rent to Value Ratio
Active
$454,900
6
bds
|
3
ba
|
0
sqft
|
built
2010
2585 Rodeo Way, Nesbit, MS 38651
$-480
Cash flow
-5.5%
Cash-on-Cash Return
4.4%
Cap rate
0.6%
Rent to Value Ratio
Active
$439,000
4
bds
|
3
ba
|
0
sqft
|
built
2001
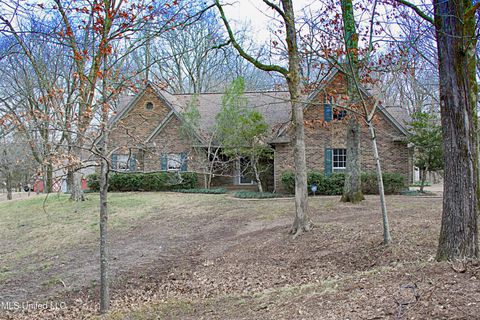
1287 Dogwood Hollow Dr, Nesbit, MS 38651
$-299
Cash flow
-3.6%
Cash-on-Cash Return
4.9%
Cap rate
0.7%
Rent to Value Ratio
Active
$359,900
3
bds
|
2
ba
|
0
sqft
|
built
2023
3444 Hatton Dr, Nesbit, MS 38651
$-78
Cash flow
-1.1%
Cash-on-Cash Return
5.4%
Cap rate
0.7%
Rent to Value Ratio
Active
$999,999
3
bds
|
2
ba
|
0
sqft
|
built
1976
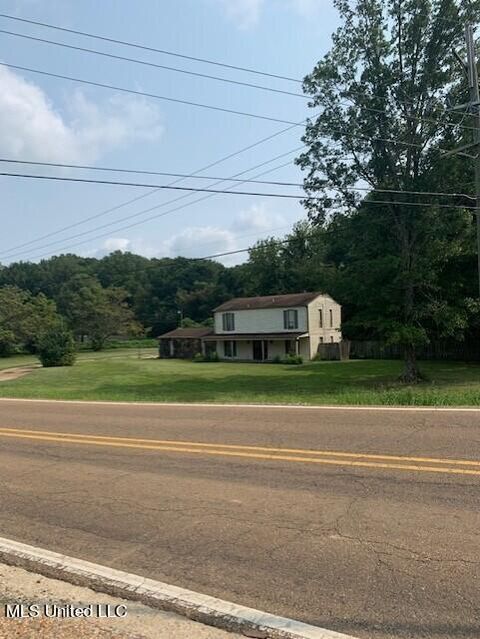
3049 Pleasant Hill Rd, Nesbit, MS 38651
$-2,919
Cash flow
-15.2%
Cash-on-Cash Return
2.2%
Cap rate
0.3%
Rent to Value Ratio
Active
$399,900
5
bds
|
4
ba
|
0
sqft
|
built
1995
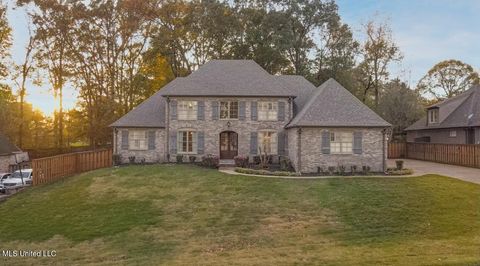
1320 Wooten Rd, Nesbit, MS 38651
$-51
Cash flow
-0.7%
Cash-on-Cash Return
5.5%
Cap rate
0.7%
Rent to Value Ratio
Active
$527,000
5
bds
|
5
ba
|
0
sqft
|
built
2005
4655 Bonne Terre Dr, Nesbit, MS 38651
$-369
Cash flow
-3.7%
Cash-on-Cash Return
4.8%
Cap rate
0.7%
Rent to Value Ratio