Nibley, UT Investment Properties for Sale
Browse homes for sale and investment properties in Nibley, UT. Refine your search by price, property type, or more.
Best cash flowing properties in Nibley, UT
Active
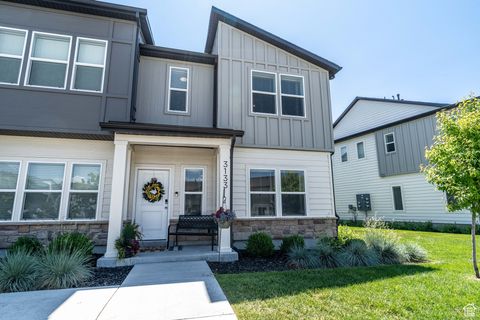
$334,900
3
bds
|
3
ba
|
1,524
sqft
|
built
2022
3133 S 350 W, Nibley, UT 84321
$-721
Cash flow
-11.2%
Cash-on-Cash Return
3.1%
Cap rate
0.5%
Rent to Value Ratio
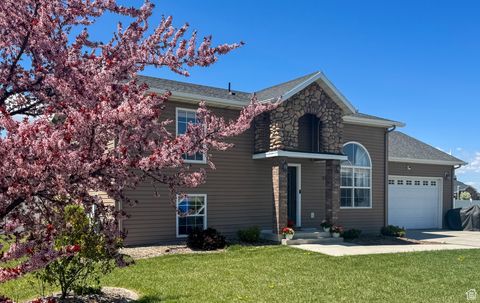
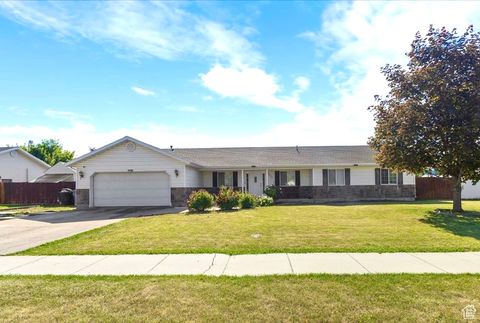
Active
$449,000
4
bds
|
2
ba
|
1,809
sqft
|
built
2008
3261 S 1500 W, Nibley, UT 84321
$-752
Cash flow
-8.7%
Cash-on-Cash Return
3.7%
Cap rate
0.5%
Rent to Value Ratio
10 out of 19 properties for sale in Nibley, UT
Limited Results Shown
Create a free account, or log in to reveal all property listings and enjoy the complete experience.
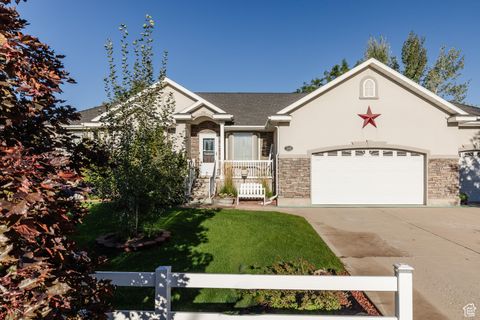
Active
$599,900
6
bds
|
3
ba
|
3,053
sqft
|
built
2005
2899 S 1080 W, Nibley, UT 84321
$-1,093
Cash flow
-9.5%
Cash-on-Cash Return
3.5%
Cap rate
0.5%
Rent to Value Ratio
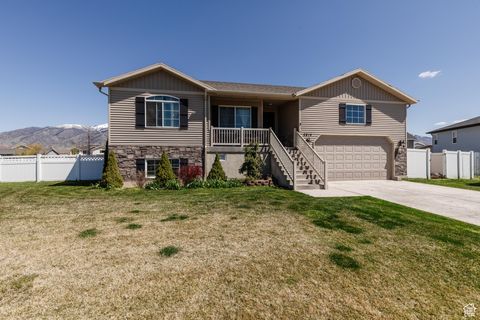
Active
$485,000
5
bds
|
3
ba
|
2,666
sqft
|
built
2015
2814 S 1150 W, Nibley, UT 84321
$-774
Cash flow
-8.3%
Cash-on-Cash Return
3.8%
Cap rate
0.5%
Rent to Value Ratio
Active
$670,000
5
bds
|
3
ba
|
3,100
sqft
|
built
2005
2269 Clear Creek Rd, Nibley, UT 84321
$-1,767
Cash flow
-13.8%
Cash-on-Cash Return
2.5%
Cap rate
0.3%
Rent to Value Ratio
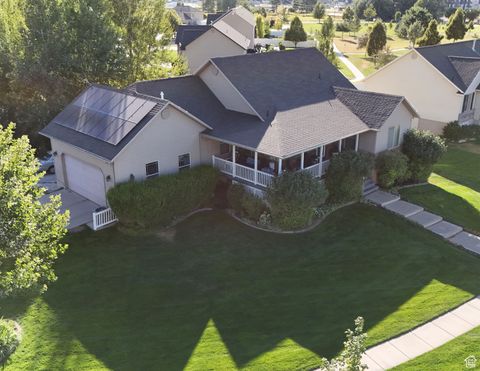
Active
$769,000
5
bds
|
4
ba
|
3,703
sqft
|
built
2003
396 W 3650 S, Nibley, UT 84321
$-1,938
Cash flow
-13.1%
Cash-on-Cash Return
2.7%
Cap rate
0.4%
Rent to Value Ratio
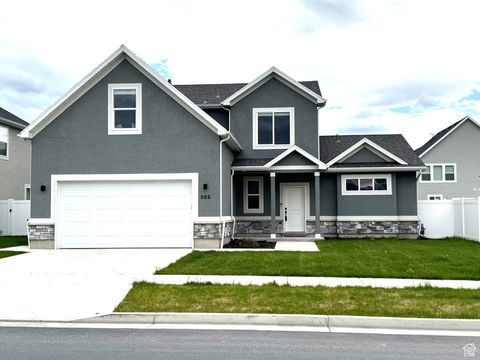
Active
$495,000
4
bds
|
3
ba
|
2,513
sqft
|
built
2022
352 W Ropelato Dr, Nibley, UT 84321
$-759
Cash flow
-8.0%
Cash-on-Cash Return
3.8%
Cap rate
0.5%
Rent to Value Ratio
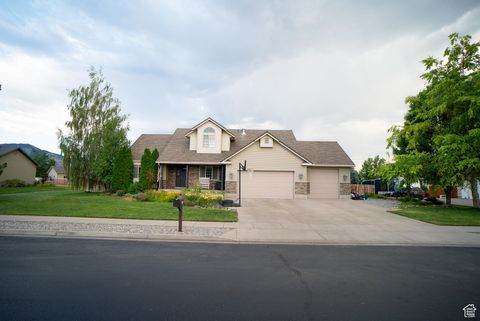
Active
$447,000
4
bds
|
2
ba
|
1,817
sqft
|
built
2002
3093 S 1600 W, Nibley, UT 84321
$-875
Cash flow
-10.2%
Cash-on-Cash Return
3.3%
Cap rate
0.4%
Rent to Value Ratio
Active
$559,900
4
bds
|
3
ba
|
2,390
sqft
|
built
2017
1389 W 2870 S, Nibley, UT 84321
$-869
Cash flow
-8.1%
Cash-on-Cash Return
3.8%
Cap rate
0.5%
Rent to Value Ratio
Active
$1,249,000
5
bds
|
6
ba
|
4,212
sqft
|
built
2005
5331 Sleepy Hollow Ln, Nibley, UT 84321
$-2,373
Cash flow
-9.9%
Cash-on-Cash Return
3.4%
Cap rate
0.4%
Rent to Value Ratio