Niles, MI Investment Properties for Sale
Browse homes for sale and investment properties in Niles, MI. Refine your search by price, property type, or more.
Best cash flowing properties in Niles, MI
Active
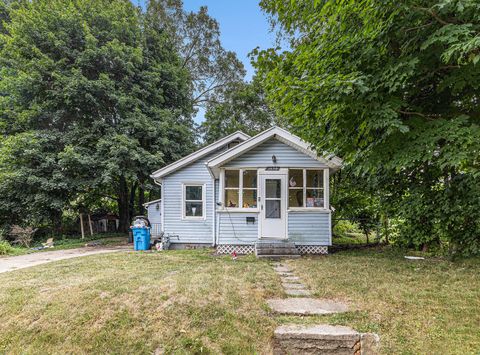
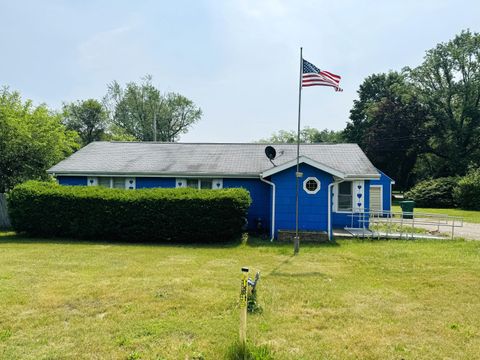
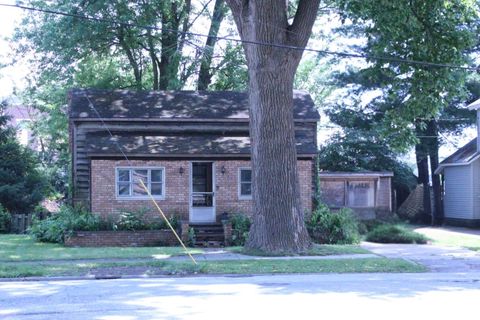
$117,900
2
bds
|
1
ba
|
756
sqft
|
built
1940
1638 Cherry St, Niles, MI 49120
$237
Cash flow
10.5%
Cash-on-Cash Return
8.6%
Cap rate
1.2%
Rent to Value Ratio
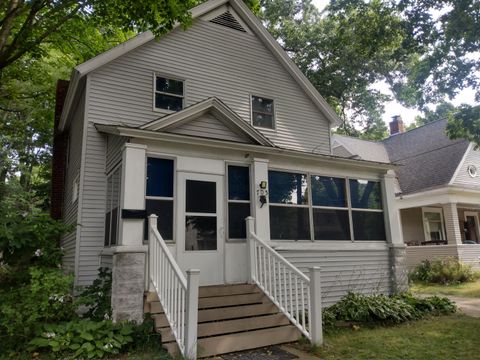
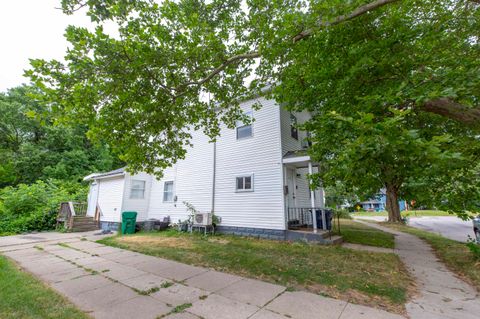
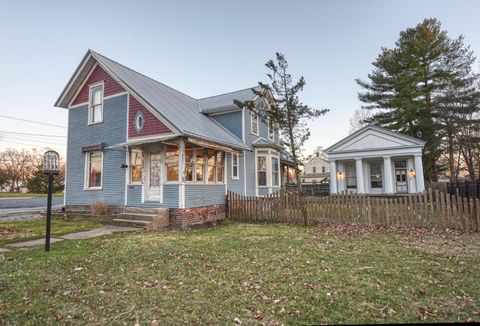
Active
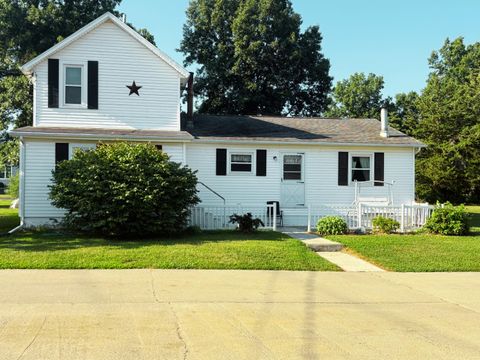
$178,000
4
bds
|
2
ba
|
1,976
sqft
|
built
1936
705 Oak St, Niles, MI 49120
$203
Cash flow
6.0%
Cash-on-Cash Return
7.5%
Cap rate
1.0%
Rent to Value Ratio
45 out of 51 properties for sale in Niles, MI
Limited Results Shown
Create a free account, or log in to reveal all property listings and enjoy the complete experience.

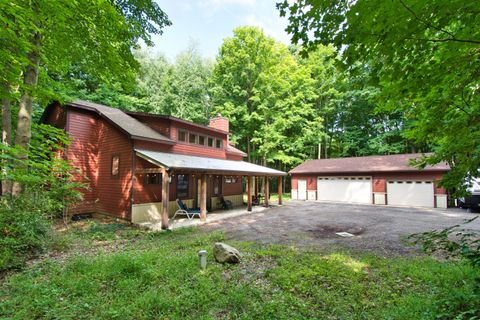
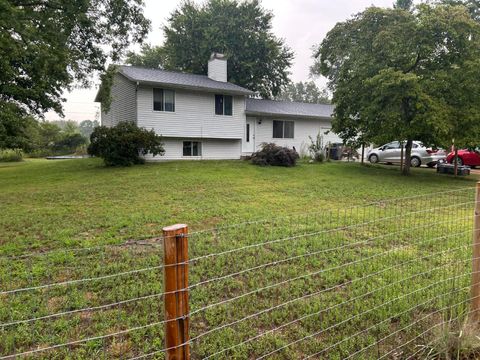
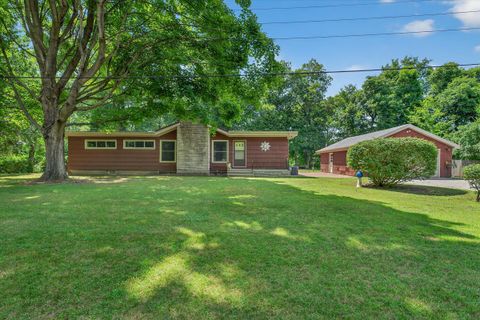
Active
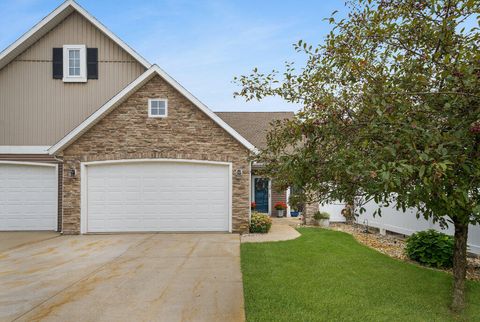
$299,000
4
bds
|
2
ba
|
2,043
sqft
|
built
1988
70525 Ironwood Dr, Niles, MI 49120
$-674
Cash flow
-11.8%
Cash-on-Cash Return
3.4%
Cap rate
0.5%
Rent to Value Ratio
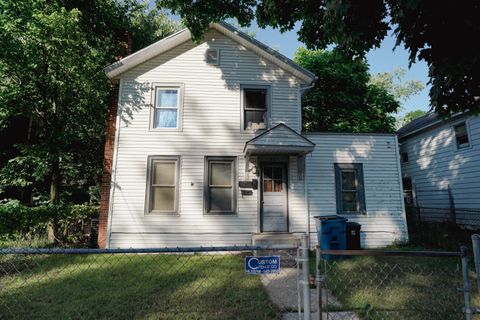
Active
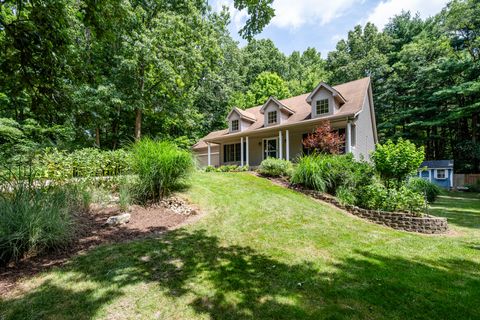
$489,000
2
bds
|
2
ba
|
1,735
sqft
|
built
2020
824 N Philip Rd, Niles, MI 49120
$-1,394
Cash flow
-14.9%
Cash-on-Cash Return
2.7%
Cap rate
0.5%
Rent to Value Ratio
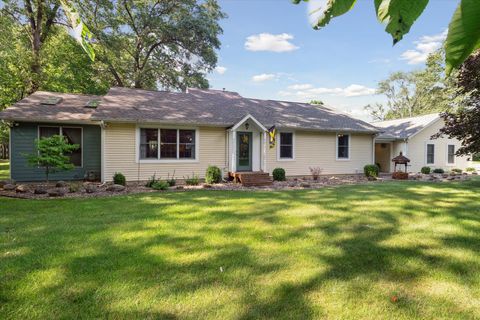
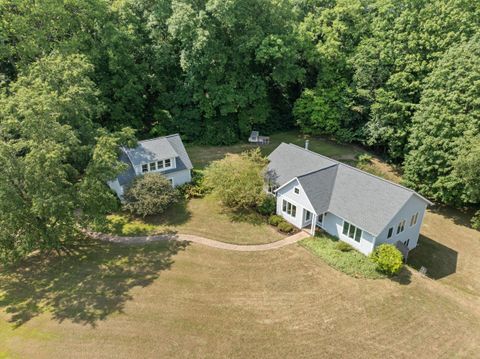
Active
$305,000
3
bds
|
3
ba
|
2,150
sqft
|
built
2000
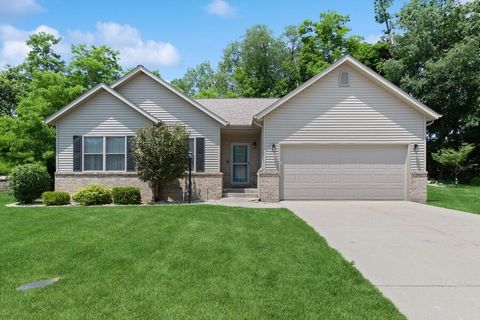
33944 Redfield St, Niles, MI 49120
$-490
Cash flow
-8.4%
Cash-on-Cash Return
4.2%
Cap rate
0.6%
Rent to Value Ratio
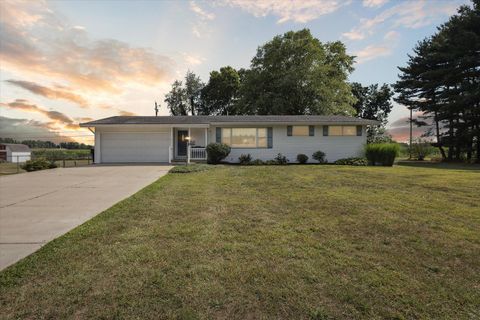
Active
$140,000
bds
|
0
ba
|
0
sqft
|
built
1910
514 S 5th St, Niles, MI 49120
$73
Cash flow
2.7%
Cash-on-Cash Return
6.8%
Cap rate
1.0%
Rent to Value Ratio
Active
$259,900
5
bds
|
2
ba
|
1,687
sqft
|
built
1999
33764 Judy Ln, Niles, MI 49120
$-425
Cash flow
-8.5%
Cash-on-Cash Return
4.2%
Cap rate
0.6%
Rent to Value Ratio

Active
$335,000
3
bds
|
1
ba
|
1,797
sqft
|
built
1900
2640 Terminal St, Niles, MI 49120
$-661
Cash flow
-10.3%
Cash-on-Cash Return
3.8%
Cap rate
0.5%
Rent to Value Ratio
Active
$999,999
3
bds
|
2
ba
|
3,102
sqft
|
built
1996
2617 Korn St, Niles, MI 49120
$-4,247
Cash flow
-22.2%
Cash-on-Cash Return
1.1%
Cap rate
0.2%
Rent to Value Ratio
Active
$275,000
3
bds
|
2
ba
|
1,577
sqft
|
built
1955
2548 Coquillard Dr, Niles, MI 49120
$-574
Cash flow
-10.9%
Cash-on-Cash Return
3.6%
Cap rate
0.5%
Rent to Value Ratio
Active
$199,900
3
bds
|
1
ba
|
1,878
sqft
|
built
1920
1123 Cass St, Niles, MI 49120
$43
Cash flow
1.1%
Cash-on-Cash Return
6.4%
Cap rate
0.9%
Rent to Value Ratio
Active
$187,500
3
bds
|
1
ba
|
1,136
sqft
|
built
1950
2127 Baldwin Dr, Niles, MI 49120
$-285
Cash flow
-7.9%
Cash-on-Cash Return
4.3%
Cap rate
0.6%
Rent to Value Ratio
Active
$199,000
3
bds
|
2
ba
|
2,300
sqft
|
built
2000
832 E Park Dr, Niles, MI 49120
$-37
Cash flow
-1.0%
Cash-on-Cash Return
5.9%
Cap rate
1.0%
Rent to Value Ratio
Active
$240,000
3
bds
|
1
ba
|
1,300
sqft
|
built
1973
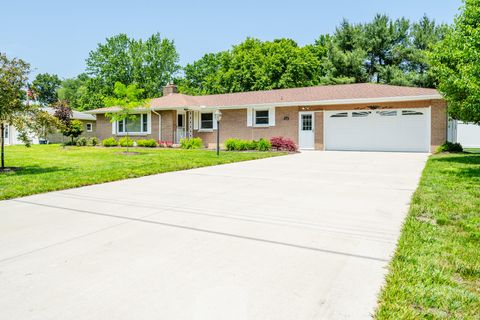
70661 Dennis Dr, Niles, MI 49120
$-232
Cash flow
-5.0%
Cash-on-Cash Return
5.0%
Cap rate
0.7%
Rent to Value Ratio

Active
$429,900
4
bds
|
2
ba
|
2,594
sqft
|
built
1952
70170 Ironwood Dr, Niles, MI 49120
$-1,272
Cash flow
-15.4%
Cash-on-Cash Return
2.6%
Cap rate
0.4%
Rent to Value Ratio

Active
$419,000
4
bds
|
4
ba
|
3,093
sqft
|
built
1949
1806 Bond St, Niles, MI 49120
$-761
Cash flow
-9.5%
Cash-on-Cash Return
4.0%
Cap rate
0.6%
Rent to Value Ratio
Active
$179,900
3
bds
|
1
ba
|
1,617
sqft
|
built
1940
1225 Huntly Rd, Niles, MI 49120
$-144
Cash flow
-4.2%
Cash-on-Cash Return
5.2%
Cap rate
0.7%
Rent to Value Ratio
Active
$349,000
3
bds
|
2
ba
|
1,882
sqft
|
built
2007
103 Lexington Pointe Dr, Niles, MI 49120
$-743
Cash flow
-11.1%
Cash-on-Cash Return
3.6%
Cap rate
0.6%
Rent to Value Ratio

Active
$259,000
3
bds
|
2
ba
|
1,696
sqft
|
built
1935
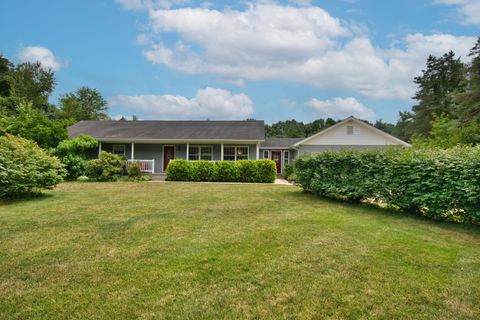
2663 Huntly Rd, Niles, MI 49120
$-226
Cash flow
-4.6%
Cash-on-Cash Return
5.1%
Cap rate
0.7%
Rent to Value Ratio
Active
$394,000
3
bds
|
2
ba
|
1,752
sqft
|
built
1890
1002 Leet Rd, Niles, MI 49120
$-1,187
Cash flow
-15.7%
Cash-on-Cash Return
2.5%
Cap rate
0.4%
Rent to Value Ratio
Active
$389,900
3
bds
|
3
ba
|
2,148
sqft
|
built
2006
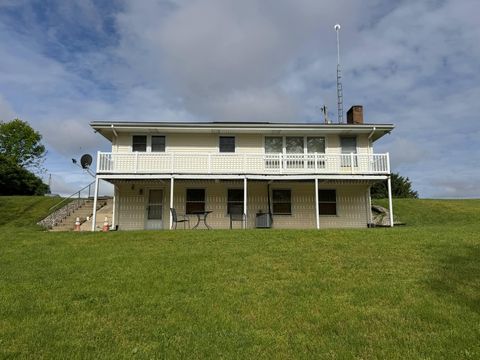
2975 Portage Rd, Niles, MI 49120
$-693
Cash flow
-9.3%
Cash-on-Cash Return
4.0%
Cap rate
0.6%
Rent to Value Ratio
Active
$469,900
9
bds
|
7
ba
|
9,999
sqft
|
built
1960
70700 Ironwood Dr, Niles, MI 49120
$-559
Cash flow
-6.2%
Cash-on-Cash Return
4.7%
Cap rate
0.7%
Rent to Value Ratio
Active
$249,000
3
bds
|
1
ba
|
1,701
sqft
|
built
1954
2120 S 3rd St, Niles, MI 49120
$-115
Cash flow
-2.4%
Cash-on-Cash Return
5.6%
Cap rate
0.8%
Rent to Value Ratio
Active
$794,000
5
bds
|
4
ba
|
4,830
sqft
|
built
1996
1695 Signal Point Dr, Niles, MI 49120
$-2,085
Cash flow
-13.7%
Cash-on-Cash Return
3.0%
Cap rate
0.5%
Rent to Value Ratio
Active
$749,000
4
bds
|
3
ba
|
3,485
sqft
|
built
1949
1630 S 3rd St, Niles, MI 49120
$-2,053
Cash flow
-14.3%
Cash-on-Cash Return
2.9%
Cap rate
0.5%
Rent to Value Ratio

Active
$999,000
3
bds
|
3
ba
|
2,940
sqft
|
built
2008
2160 Portage Rd, Niles, MI 49120
$-3,327
Cash flow
-17.4%
Cash-on-Cash Return
2.2%
Cap rate
0.3%
Rent to Value Ratio
Active
$98,000
3
bds
|
1
ba
|
1,015
sqft
|
built
1963
43 N Lincoln Ave, Niles, MI 49120
$187
Cash flow
10.0%
Cash-on-Cash Return
8.4%
Cap rate
1.2%
Rent to Value Ratio

Active
$179,000
3
bds
|
1
ba
|
1,128
sqft
|
built
1925
211 S 4th St, Niles, MI 49120
$-119
Cash flow
-3.5%
Cash-on-Cash Return
5.3%
Cap rate
0.8%
Rent to Value Ratio
Active
$240,000
4
bds
|
2
ba
|
2,671
sqft
|
built
1922
1008 Oak St, Niles, MI 49120
$-99
Cash flow
-2.2%
Cash-on-Cash Return
5.7%
Cap rate
0.8%
Rent to Value Ratio
Active
$375,000
3
bds
|
1
ba
|
1,362
sqft
|
built
1954
1834 Bond St, Niles, MI 49120
$-940
Cash flow
-13.1%
Cash-on-Cash Return
3.1%
Cap rate
0.5%
Rent to Value Ratio

Active
$1,125,000
5
bds
|
4
ba
|
4,759
sqft
|
built
1999
29750 Edwards Way, Niles, MI 49120
$-4,158
Cash flow
-19.3%
Cash-on-Cash Return
1.2%
Cap rate
0.2%
Rent to Value Ratio
Active
$136,000
bds
|
0
ba
|
0
sqft
|
built
1922
57 S 3rd St, Niles, MI 49120
$-104
Cash flow
-4.0%
Cash-on-Cash Return
5.2%
Cap rate
0.9%
Rent to Value Ratio
Active
$329,900
2
bds
|
2
ba
|
1,406
sqft
|
built
2019
450 Carefree Ct, Niles, MI 49120
$-1,070
Cash flow
-16.9%
Cash-on-Cash Return
2.3%
Cap rate
0.5%
Rent to Value Ratio

Active
$1,550,000
3
bds
|
4
ba
|
3,284
sqft
|
built
1999
1256 Barron Lake Rd, Niles, MI 49120
$-6,953
Cash flow
-23.4%
Cash-on-Cash Return
0.8%
Cap rate
0.1%
Rent to Value Ratio
Active
$335,000
3
bds
|
2
ba
|
1,966
sqft
|
built
1959
2729 Horton Ct, Niles, MI 49120
$-638
Cash flow
-9.9%
Cash-on-Cash Return
3.9%
Cap rate
0.5%
Rent to Value Ratio
Active
$599,900
4
bds
|
3
ba
|
2,458
sqft
|
built
2004
2688 White St, Niles, MI 49120
$-2,094
Cash flow
-18.2%
Cash-on-Cash Return
2.0%
Cap rate
0.3%
Rent to Value Ratio

Active
$189,900
3
bds
|
2
ba
|
1,300
sqft
|
built
1995
1920 S 15th St, Niles, MI 49120
$0
Cash flow
n/a
Cash-on-Cash Return
n/a
Cap rate
n/a
Rent to Value Ratio

Active
$259,900
3
bds
|
2
ba
|
1,353
sqft
|
built
1951
2800 Mayflower Rd, Niles, MI 49120
$-352
Cash flow
-7.1%
Cash-on-Cash Return
4.5%
Cap rate
0.6%
Rent to Value Ratio
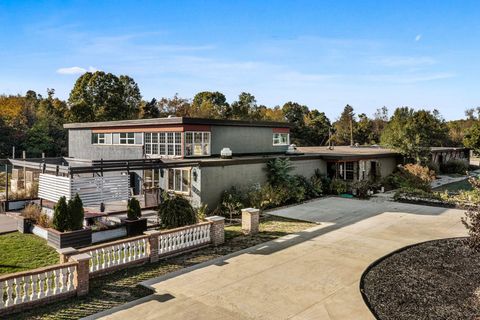
Active
$450,000
3
bds
|
3
ba
|
3,100
sqft
|
built
1958
440 Pucker St, Niles, MI 49120
$-718
Cash flow
-8.3%
Cash-on-Cash Return
4.2%
Cap rate
0.5%
Rent to Value Ratio

Active
$182,500
3
bds
|
2
ba
|
1,318
sqft
|
built
1930
112 Bertram Rd, Niles, MI 49120
$-94
Cash flow
-2.7%
Cash-on-Cash Return
5.5%
Cap rate
0.8%
Rent to Value Ratio