Clark County Investment Properties for Sale
Browse homes for sale and investment properties in Clark County. Refine your search by price, property type, or more.
Best cash flowing properties in Clark County
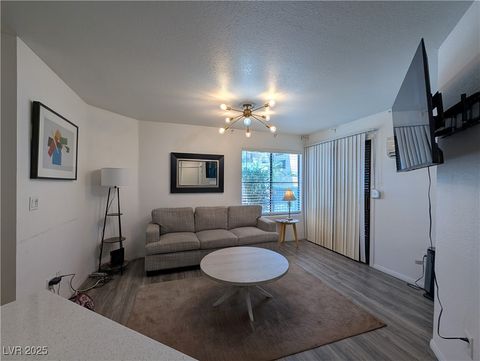
Active
$148,000
1
bds
|
1
ba
|
462
sqft
|
built
1986
460 Elm Dr, Las Vegas, NV 89169
$-225
Cash flow
-7.9%
Cash-on-Cash Return
3.9%
Cap rate
0.7%
Rent to Value Ratio
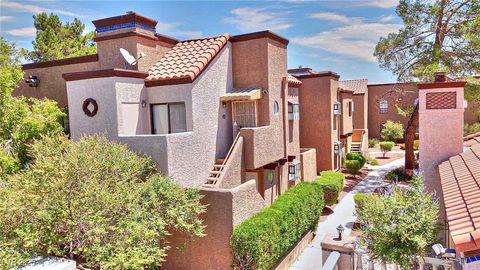
Active
$192,000
2
bds
|
2
ba
|
884
sqft
|
built
1987
2966 Juniper Hills Blvd, Las Vegas, NV 89142
$-352
Cash flow
-9.6%
Cash-on-Cash Return
3.5%
Cap rate
0.7%
Rent to Value Ratio
5,728 out of 5,925 properties for sale in Clark County
Limited Results Shown
Create a free account, or log in to reveal all property listings and enjoy the complete experience.
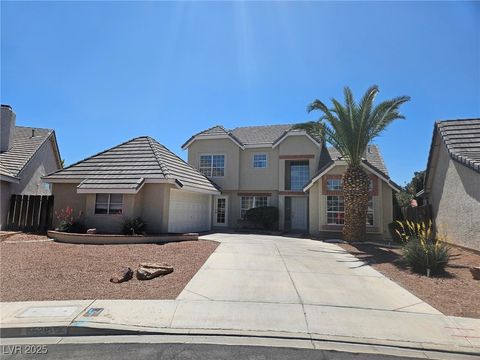
Active
$475,000
3
bds
|
3
ba
|
2,407
sqft
|
built
1987
6529 Bradford Ln, Las Vegas, NV 89108
$-883
Cash flow
-9.7%
Cash-on-Cash Return
3.4%
Cap rate
0.5%
Rent to Value Ratio
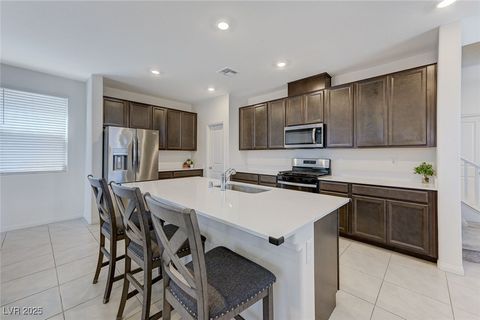
Active
$515,000
4
bds
|
3
ba
|
1,984
sqft
|
built
2023
4133 Golden Fleece Ave, Las Vegas, NV 89141
$-636
Cash flow
-6.4%
Cash-on-Cash Return
4.2%
Cap rate
0.6%
Rent to Value Ratio
Active
$1,699,999
4
bds
|
4
ba
|
3,053
sqft
|
built
2023
5865 Alice Landing Ct, Las Vegas, NV 89149
$-4,601
Cash flow
-14.1%
Cash-on-Cash Return
2.4%
Cap rate
0.4%
Rent to Value Ratio
Active
$766,800
4
bds
|
3
ba
|
2,785
sqft
|
built
2002
8134 Maddingley Ave, Las Vegas, NV 89117
$-949
Cash flow
-6.5%
Cash-on-Cash Return
4.2%
Cap rate
0.6%
Rent to Value Ratio
Active
$6,800,000
5
bds
|
6
ba
|
6,017
sqft
|
built
2022
1 Costa Del Sol Ct, Henderson, NV 89011
$-29,329
Cash flow
-22.5%
Cash-on-Cash Return
0.5%
Cap rate
0.1%
Rent to Value Ratio
Active
$3,790,000
4
bds
|
6
ba
|
4,469
sqft
|
built
2022
2827 Richmar Ave, Henderson, NV 89074
$-15,785
Cash flow
-21.7%
Cash-on-Cash Return
0.7%
Cap rate
0.1%
Rent to Value Ratio
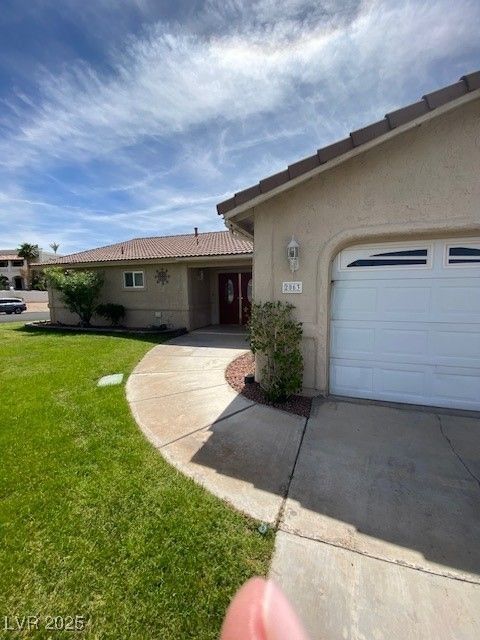
Active
$389,000
3
bds
|
2
ba
|
1,906
sqft
|
built
1985
2063 Avalon Dr, Laughlin, NV 89029
$-627
Cash flow
-8.4%
Cash-on-Cash Return
3.7%
Cap rate
0.5%
Rent to Value Ratio
Active
$435,000
3
bds
|
3
ba
|
1,527
sqft
|
built
1995
7954 Kentshire Dr, Las Vegas, NV 89117
$-960
Cash flow
-11.5%
Cash-on-Cash Return
3.0%
Cap rate
0.5%
Rent to Value Ratio
Active
$10,990,000
6
bds
|
9
ba
|
11,861
sqft
|
built
2006
5 Wood Creek Ct, Las Vegas, NV 89141
$-51,675
Cash flow
-24.5%
Cash-on-Cash Return
0.0%
Cap rate
0.1%
Rent to Value Ratio
Active
$383,000
3
bds
|
2
ba
|
1,070
sqft
|
built
1988
7405 Saybrook Point Dr, Las Vegas, NV 89128
$-685
Cash flow
-9.3%
Cash-on-Cash Return
3.5%
Cap rate
0.5%
Rent to Value Ratio
Active
$899,900
5
bds
|
6
ba
|
4,964
sqft
|
built
2000
8809 Barium Rock Ave, Las Vegas, NV 89143
$-2,100
Cash flow
-12.2%
Cash-on-Cash Return
2.9%
Cap rate
0.4%
Rent to Value Ratio
Active
$330,000
3
bds
|
2
ba
|
1,368
sqft
|
built
1956
744 Mc Knight St, Las Vegas, NV 89101
$-379
Cash flow
-6.0%
Cash-on-Cash Return
4.3%
Cap rate
0.5%
Rent to Value Ratio
Active
$237,000
2
bds
|
2
ba
|
1,029
sqft
|
built
1994
2725 S Nellis Blvd, Las Vegas, NV 89121
$-626
Cash flow
-13.8%
Cash-on-Cash Return
2.5%
Cap rate
0.5%
Rent to Value Ratio
Active
$405,000
5
bds
|
0
ba
|
1,908
sqft
|
built
1981
1608 Putnam Ave, North Las Vegas, NV 89030
$-1,102
Cash flow
-14.2%
Cash-on-Cash Return
2.4%
Cap rate
0.3%
Rent to Value Ratio
Active
$789,999
5
bds
|
3
ba
|
2,747
sqft
|
built
1999
691 Vineland Ave, Henderson, NV 89052
$-1,084
Cash flow
-7.2%
Cash-on-Cash Return
4.0%
Cap rate
0.6%
Rent to Value Ratio
Active
$528,000
4
bds
|
3
ba
|
2,092
sqft
|
built
1998
9290 Cool Creek Ave, Las Vegas, NV 89147
$-779
Cash flow
-7.7%
Cash-on-Cash Return
3.9%
Cap rate
0.5%
Rent to Value Ratio
Active
$584,900
4
bds
|
3
ba
|
2,792
sqft
|
built
2006
2265 Stone Breeze Ave, North Las Vegas, NV 89031
$-1,280
Cash flow
-11.4%
Cash-on-Cash Return
3.1%
Cap rate
0.4%
Rent to Value Ratio
Active
$550,000
3
bds
|
2
ba
|
1,963
sqft
|
built
2000
967 Cardelina Ln, Henderson, NV 89052
$-1,107
Cash flow
-10.5%
Cash-on-Cash Return
3.3%
Cap rate
0.5%
Rent to Value Ratio
Active
$289,999
2
bds
|
2
ba
|
1,216
sqft
|
built
1992
1624 N Torrey Pines Dr, Las Vegas, NV 89108
$-698
Cash flow
-12.6%
Cash-on-Cash Return
2.8%
Cap rate
0.5%
Rent to Value Ratio
Active
$519,000
3
bds
|
3
ba
|
1,883
sqft
|
built
1986
9021 Feather River Ct, Las Vegas, NV 89117
$-1,157
Cash flow
-11.6%
Cash-on-Cash Return
3.0%
Cap rate
0.4%
Rent to Value Ratio
Active
$1,750,000
6
bds
|
5
ba
|
5,883
sqft
|
built
2000
1016 Sable Mist Ct, Las Vegas, NV 89144
$-6,597
Cash flow
-19.7%
Cash-on-Cash Return
1.2%
Cap rate
0.2%
Rent to Value Ratio
Active
$515,000
4
bds
|
3
ba
|
1,812
sqft
|
built
2001
981 Leadville Meadows Dr, Henderson, NV 89052
$-1,090
Cash flow
-11.0%
Cash-on-Cash Return
3.1%
Cap rate
0.4%
Rent to Value Ratio
Active
$325,000
3
bds
|
1
ba
|
898
sqft
|
built
1955
604 N Minnesota St, Las Vegas, NV 89107
$-540
Cash flow
-8.7%
Cash-on-Cash Return
3.7%
Cap rate
0.5%
Rent to Value Ratio
Active
$810,000
2
bds
|
3
ba
|
2,190
sqft
|
built
1989
8460 Carmel Ridge Ct, Las Vegas, NV 89113
$-2,932
Cash flow
-18.9%
Cash-on-Cash Return
1.3%
Cap rate
0.4%
Rent to Value Ratio
Active
$2,150,000
6
bds
|
6
ba
|
7,259
sqft
|
built
1998
2086 Troon Dr, Henderson, NV 89074
$-6,149
Cash flow
-14.9%
Cash-on-Cash Return
2.2%
Cap rate
0.4%
Rent to Value Ratio
Active
$1,495,000
7
bds
|
6
ba
|
4,077
sqft
|
built
2008
2900 Valvent Ct, Henderson, NV 89044
$-3,619
Cash flow
-12.6%
Cash-on-Cash Return
2.8%
Cap rate
0.4%
Rent to Value Ratio
Active
$499,900
3
bds
|
2
ba
|
1,635
sqft
|
built
2003
169 Pioneer Peak Pl, Las Vegas, NV 89138
$-1,272
Cash flow
-13.3%
Cash-on-Cash Return
2.6%
Cap rate
0.5%
Rent to Value Ratio
Active
$379,999
3
bds
|
3
ba
|
1,503
sqft
|
built
1983
4612 Supreme Ct, Las Vegas, NV 89110
$-577
Cash flow
-7.9%
Cash-on-Cash Return
3.9%
Cap rate
0.5%
Rent to Value Ratio
Active
$335,000
2
bds
|
2
ba
|
1,080
sqft
|
built
1994
6370 Canyon Vista Ct, Las Vegas, NV 89156
$-495
Cash flow
-7.7%
Cash-on-Cash Return
3.9%
Cap rate
0.5%
Rent to Value Ratio
Active
$329,900
3
bds
|
1
ba
|
1,034
sqft
|
built
1942
170 Copper St, Henderson, NV 89015
$-422
Cash flow
-6.7%
Cash-on-Cash Return
4.1%
Cap rate
0.5%
Rent to Value Ratio
Active
$589,990
5
bds
|
3
ba
|
2,674
sqft
|
built
2001
2635 Regency Cove Ct, Las Vegas, NV 89121
$-1,209
Cash flow
-10.7%
Cash-on-Cash Return
3.2%
Cap rate
0.5%
Rent to Value Ratio
Active
$399,900
3
bds
|
3
ba
|
1,421
sqft
|
built
2005
9229 Millikan Ave, Las Vegas, NV 89148
$-737
Cash flow
-9.6%
Cash-on-Cash Return
3.5%
Cap rate
0.5%
Rent to Value Ratio
Active
$389,900
2
bds
|
2
ba
|
1,334
sqft
|
built
1993
104 Hutton Ln, Las Vegas, NV 89145
$-814
Cash flow
-10.9%
Cash-on-Cash Return
3.2%
Cap rate
0.5%
Rent to Value Ratio
Active
$539,900
3
bds
|
3
ba
|
1,529
sqft
|
built
1998
9801 Bradford Summit St, Las Vegas, NV 89183
$-1,225
Cash flow
-11.8%
Cash-on-Cash Return
3.0%
Cap rate
0.4%
Rent to Value Ratio
Active
$509,900
5
bds
|
3
ba
|
2,381
sqft
|
built
2000
7612 Certitude Ave, Las Vegas, NV 89131
$-1,178
Cash flow
-12.1%
Cash-on-Cash Return
2.9%
Cap rate
0.4%
Rent to Value Ratio
Active
$349,999
2
bds
|
2
ba
|
1,294
sqft
|
built
2004
104 Masserta Ct, Las Vegas, NV 89183
$-464
Cash flow
-6.9%
Cash-on-Cash Return
4.1%
Cap rate
0.6%
Rent to Value Ratio
Active
$375,000
3
bds
|
4
ba
|
1,689
sqft
|
built
2007
10067 Sand Key St, Las Vegas, NV 89178
$-902
Cash flow
-12.5%
Cash-on-Cash Return
2.8%
Cap rate
0.5%
Rent to Value Ratio
Active
$990,000
5
bds
|
3
ba
|
4,449
sqft
|
built
2007
8431 Jeremiah Grove St, Las Vegas, NV 89123
$-2,821
Cash flow
-14.9%
Cash-on-Cash Return
2.3%
Cap rate
0.4%
Rent to Value Ratio