Clark County Investment Properties for Sale
Browse homes for sale and investment properties in Clark County. Refine your search by price, property type, or more.
Best cash flowing properties in Clark County
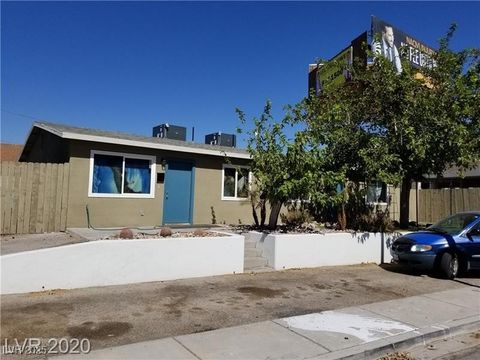
Active
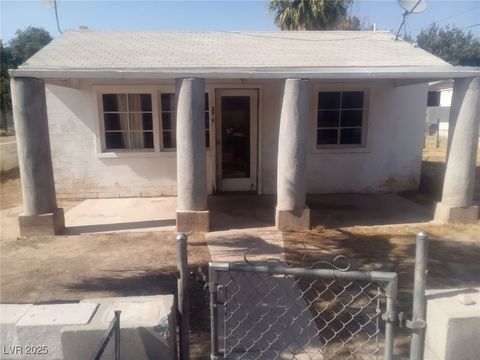
$149,900
2
bds
|
1
ba
|
624
sqft
|
built
1951
192 W Alma Ave, Overton, NV 89040
$-52
Cash flow
-1.8%
Cash-on-Cash Return
5.3%
Cap rate
0.7%
Rent to Value Ratio
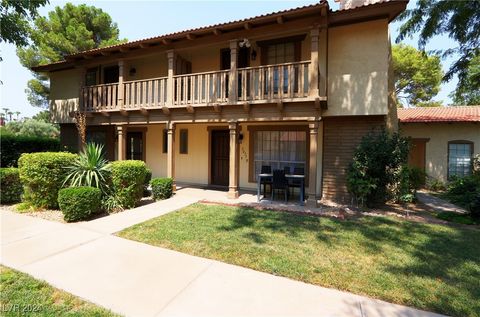
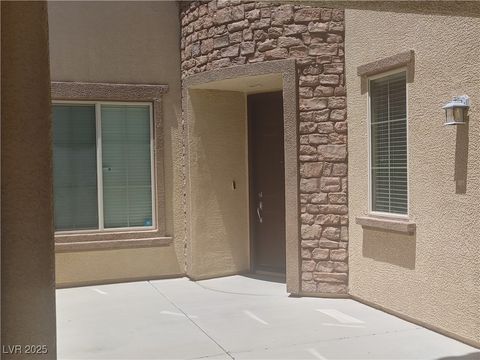
Active
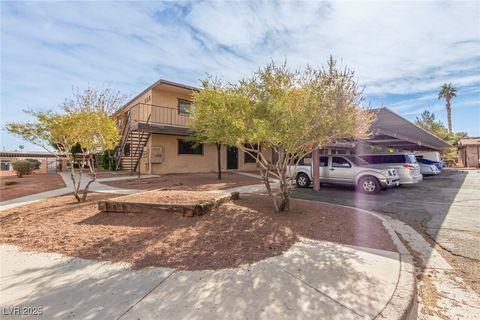
$130,000
1
bds
|
1
ba
|
624
sqft
|
built
1963
625 S Royal Crest Cir, Las Vegas, NV 89169
$-190
Cash flow
-7.6%
Cash-on-Cash Return
3.9%
Cap rate
0.8%
Rent to Value Ratio
5,771 out of 5,970 properties for sale in Clark County
Limited Results Shown
Create a free account, or log in to reveal all property listings and enjoy the complete experience.
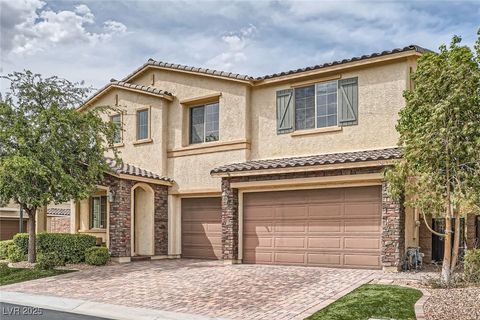
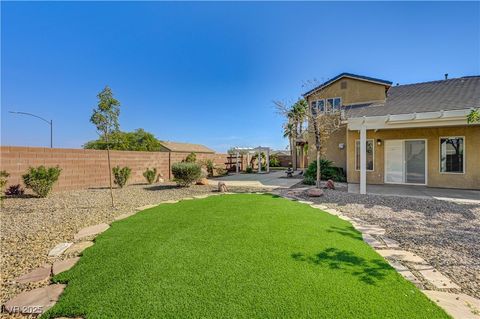
Active
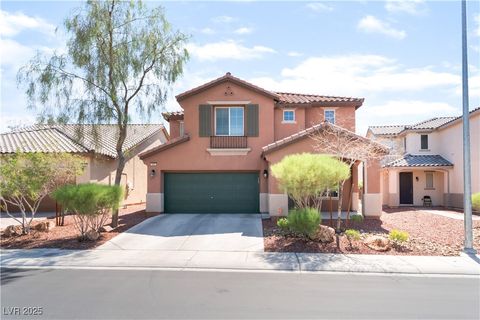
$465,000
3
bds
|
3
ba
|
2,570
sqft
|
built
2016
5852 Clear Haven Ln, North Las Vegas, NV 89081
$-1,112
Cash flow
-12.5%
Cash-on-Cash Return
2.8%
Cap rate
0.5%
Rent to Value Ratio
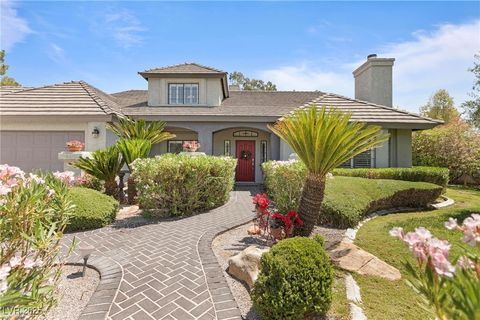
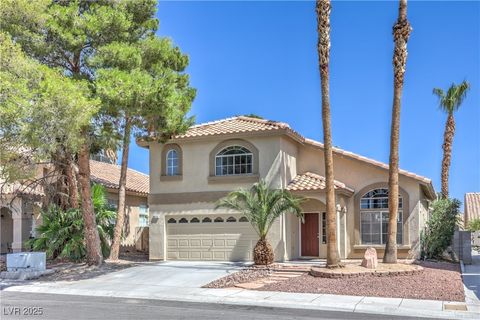
Active
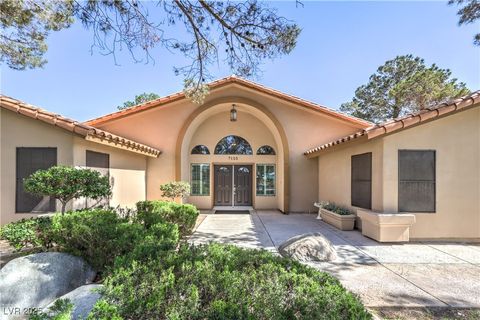
$777,000
3
bds
|
2
ba
|
2,184
sqft
|
built
1988
7460 Buckskin Ave, Las Vegas, NV 89129
$-1,544
Cash flow
-10.4%
Cash-on-Cash Return
3.3%
Cap rate
0.5%
Rent to Value Ratio
Active
$374,990
2
bds
|
3
ba
|
1,593
sqft
|
built
2016
9037 Cross Stitch Ct, Las Vegas, NV 89149
$-797
Cash flow
-11.1%
Cash-on-Cash Return
3.1%
Cap rate
0.5%
Rent to Value Ratio
Active
$719,000
4
bds
|
3
ba
|
2,802
sqft
|
built
2002
1095 Endora Way, Boulder City, NV 89005
$-1,236
Cash flow
-9.0%
Cash-on-Cash Return
3.6%
Cap rate
0.5%
Rent to Value Ratio
Active
$465,000
3
bds
|
2
ba
|
1,551
sqft
|
built
2002
8041 Villa Rosarito St, Las Vegas, NV 89131
$-1,051
Cash flow
-11.8%
Cash-on-Cash Return
3.0%
Cap rate
0.4%
Rent to Value Ratio
Active
$549,995
3
bds
|
2
ba
|
1,669
sqft
|
built
1998
8940 Emery Lake St, Las Vegas, NV 89123
$-1,158
Cash flow
-11.0%
Cash-on-Cash Return
3.2%
Cap rate
0.5%
Rent to Value Ratio
Active
$275,000
2
bds
|
2
ba
|
1,200
sqft
|
built
1972
3077 Pinehurst Dr, Las Vegas, NV 89109
$-768
Cash flow
-14.6%
Cash-on-Cash Return
2.3%
Cap rate
0.6%
Rent to Value Ratio
Active
$185,000
2
bds
|
3
ba
|
980
sqft
|
built
1984
2460 Old Forge Ln, Las Vegas, NV 89121
$-221
Cash flow
-6.2%
Cash-on-Cash Return
4.2%
Cap rate
0.8%
Rent to Value Ratio
Active
$968,000
4
bds
|
3
ba
|
3,423
sqft
|
built
1985
2222 Lucerne Ct, Henderson, NV 89014
$-2,174
Cash flow
-11.7%
Cash-on-Cash Return
3.0%
Cap rate
0.4%
Rent to Value Ratio
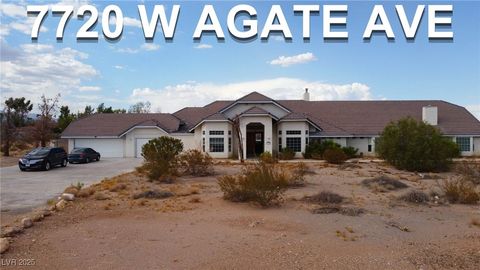
Active
$1,990,000
8
bds
|
9
ba
|
6,900
sqft
|
built
1998
7720 W Agate Ave, Las Vegas, NV 89113
$-5,392
Cash flow
-14.1%
Cash-on-Cash Return
2.4%
Cap rate
0.3%
Rent to Value Ratio
Active
$300,000
3
bds
|
2
ba
|
1,404
sqft
|
built
2018
2175 Limestone Cove Ct, Laughlin, NV 89029
$-520
Cash flow
-9.0%
Cash-on-Cash Return
3.6%
Cap rate
0.6%
Rent to Value Ratio
Active
$1,300,000
3
bds
|
3
ba
|
2,294
sqft
|
built
1961
1420 Westwood Dr, Las Vegas, NV 89102
$-2,914
Cash flow
-11.7%
Cash-on-Cash Return
3.0%
Cap rate
0.4%
Rent to Value Ratio
Active
$279,000
2
bds
|
2
ba
|
1,038
sqft
|
built
1987
6250 W Flamingo Rd, Las Vegas, NV 89103
$-596
Cash flow
-11.1%
Cash-on-Cash Return
3.1%
Cap rate
0.6%
Rent to Value Ratio
Active
$750,000
5
bds
|
4
ba
|
3,545
sqft
|
built
2005
8828 Monte Oro Dr, Las Vegas, NV 89131
$-1,531
Cash flow
-10.7%
Cash-on-Cash Return
3.2%
Cap rate
0.5%
Rent to Value Ratio
Active
$430,000
3
bds
|
2
ba
|
1,562
sqft
|
built
2002
11036 Parete Ct, Las Vegas, NV 89141
$-954
Cash flow
-11.6%
Cash-on-Cash Return
3.0%
Cap rate
0.4%
Rent to Value Ratio
Active
$398,888
4
bds
|
2
ba
|
1,618
sqft
|
built
1990
6224 Mandarin Dr, Las Vegas, NV 89108
$-691
Cash flow
-9.0%
Cash-on-Cash Return
3.6%
Cap rate
0.5%
Rent to Value Ratio
Active
$260,000
2
bds
|
2
ba
|
1,168
sqft
|
built
1993
7904 Fossil Creek Ln, Las Vegas, NV 89145
$-513
Cash flow
-10.3%
Cash-on-Cash Return
3.3%
Cap rate
0.6%
Rent to Value Ratio
Active
$160,000
1
bds
|
1
ba
|
724
sqft
|
built
1990
5340 Silvermist Ct, Las Vegas, NV 89122
$-293
Cash flow
-9.6%
Cash-on-Cash Return
3.5%
Cap rate
0.7%
Rent to Value Ratio
Active
$617,500
4
bds
|
4
ba
|
3,169
sqft
|
built
1979
5102 Tennis Ct E, Las Vegas, NV 89120
$-744
Cash flow
-6.3%
Cash-on-Cash Return
4.2%
Cap rate
0.6%
Rent to Value Ratio
Active
$158,000
1
bds
|
1
ba
|
700
sqft
|
built
1982
5405 Indian River Dr, Las Vegas, NV 89103
$-269
Cash flow
-8.9%
Cash-on-Cash Return
3.6%
Cap rate
0.7%
Rent to Value Ratio
Active
$485,888
4
bds
|
2
ba
|
2,110
sqft
|
built
1999
840 Candido Garcia Ave, Henderson, NV 89015
$-1,069
Cash flow
-11.5%
Cash-on-Cash Return
3.0%
Cap rate
0.4%
Rent to Value Ratio
Active
$230,000
1
bds
|
1
ba
|
776
sqft
|
built
1997
2300 E Silverado Ranch Blvd, Las Vegas, NV 89183
$-192
Cash flow
-4.4%
Cash-on-Cash Return
4.7%
Cap rate
0.7%
Rent to Value Ratio
Active
$235,000
1
bds
|
1
ba
|
841
sqft
|
built
1987
5018 S Rainbow Blvd, Las Vegas, NV 89118
$-457
Cash flow
-10.1%
Cash-on-Cash Return
3.3%
Cap rate
0.6%
Rent to Value Ratio
Active
$320,000
2
bds
|
3
ba
|
1,467
sqft
|
built
1992
5201 S Torrey Pines Dr, Las Vegas, NV 89118
$-585
Cash flow
-9.5%
Cash-on-Cash Return
3.5%
Cap rate
0.6%
Rent to Value Ratio
Active
$234,900
2
bds
|
2
ba
|
1,070
sqft
|
built
1977
5116 Gray Ln, Las Vegas, NV 89119
$-621
Cash flow
-13.8%
Cash-on-Cash Return
2.5%
Cap rate
0.5%
Rent to Value Ratio
Active
$699,999
4
bds
|
3
ba
|
3,231
sqft
|
built
2014
7364 Marbury St, Las Vegas, NV 89166
$-1,724
Cash flow
-12.8%
Cash-on-Cash Return
2.7%
Cap rate
0.4%
Rent to Value Ratio
Active
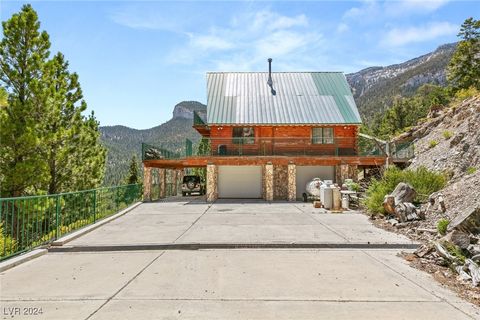
$1,250,000
2
bds
|
1
ba
|
1,174
sqft
|
built
1996
4730 Cougar Ridge Trl, Mount Charleston, NV 89124
$-3,957
Cash flow
-16.5%
Cash-on-Cash Return
1.9%
Cap rate
0.2%
Rent to Value Ratio
Active
$1,150,000
4
bds
|
4
ba
|
3,807
sqft
|
built
2015
3428 Iron Hagen Ct, Las Vegas, NV 89141
$-2,773
Cash flow
-12.6%
Cash-on-Cash Return
2.8%
Cap rate
0.4%
Rent to Value Ratio
Active
$659,000
4
bds
|
3
ba
|
2,345
sqft
|
built
2019
330 Meadow Brush Pl, Henderson, NV 89011
$-1,166
Cash flow
-9.2%
Cash-on-Cash Return
3.6%
Cap rate
0.5%
Rent to Value Ratio
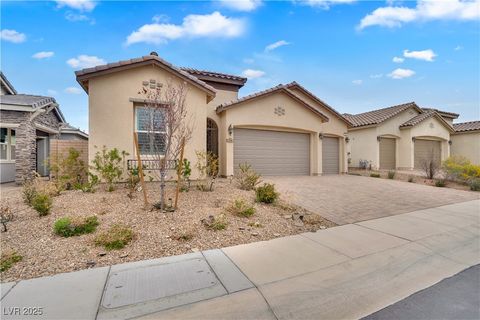
Active
$295,000
3
bds
|
2
ba
|
1,437
sqft
|
built
2003
7135 S Durango Dr, Las Vegas, NV 89113
$-603
Cash flow
-10.7%
Cash-on-Cash Return
3.2%
Cap rate
0.6%
Rent to Value Ratio
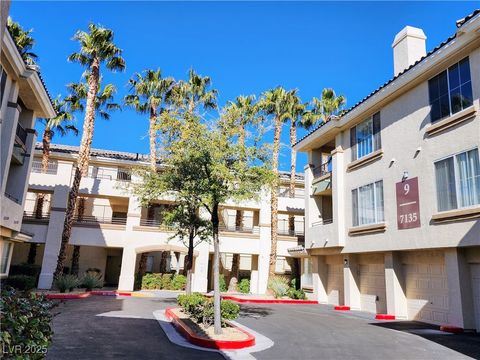
Active
$275,000
2
bds
|
2
ba
|
1,070
sqft
|
built
2006
8985 S Durango Dr, Las Vegas, NV 89113
$-437
Cash flow
-8.3%
Cash-on-Cash Return
3.8%
Cap rate
0.6%
Rent to Value Ratio
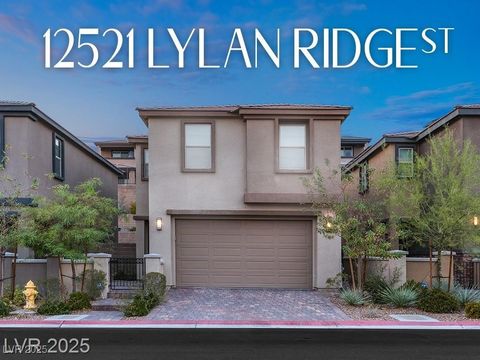
Active
$629,000
3
bds
|
3
ba
|
1,781
sqft
|
built
2019
12521 Lylan Ridge St, Las Vegas, NV 89138
$-1,432
Cash flow
-11.9%
Cash-on-Cash Return
2.9%
Cap rate
0.4%
Rent to Value Ratio
Active
$959,000
3
bds
|
3
ba
|
2,500
sqft
|
built
1990
8224 Horseshoe Bend Ln, Las Vegas, NV 89113
$-2,877
Cash flow
-15.7%
Cash-on-Cash Return
2.1%
Cap rate
0.4%
Rent to Value Ratio
Active
$839,500
3
bds
|
3
ba
|
2,509
sqft
|
built
2005
12276 Caminita Pl, Las Vegas, NV 89138
$-1,943
Cash flow
-12.1%
Cash-on-Cash Return
2.9%
Cap rate
0.4%
Rent to Value Ratio
Active
$665,000
4
bds
|
3
ba
|
2,661
sqft
|
built
2006
1740 Flores Ln, Henderson, NV 89012
$-1,390
Cash flow
-10.9%
Cash-on-Cash Return
3.2%
Cap rate
0.5%
Rent to Value Ratio
Active
$695,000
4
bds
|
4
ba
|
3,364
sqft
|
built
2011
2188 Anserville Ave, Henderson, NV 89044
$-1,763
Cash flow
-13.2%
Cash-on-Cash Return
2.6%
Cap rate
0.4%
Rent to Value Ratio
Active
$479,900
3
bds
|
3
ba
|
1,770
sqft
|
built
1995
8712 Texas Bronco Ave, Las Vegas, NV 89129
$-886
Cash flow
-9.6%
Cash-on-Cash Return
3.5%
Cap rate
0.5%
Rent to Value Ratio
Active
$485,000
4
bds
|
0
ba
|
1,480
sqft
|
built
1942
333 N 13th St, Las Vegas, NV 89101
$-1,499
Cash flow
-16.1%
Cash-on-Cash Return
2.0%
Cap rate
0.3%
Rent to Value Ratio