Tulsa County Investment Properties for Sale
Browse homes for sale and investment properties in Tulsa County. Refine your search by price, property type, or more.
Best cash flowing properties in Tulsa County
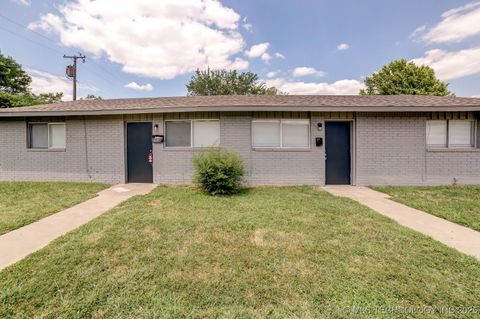
Active
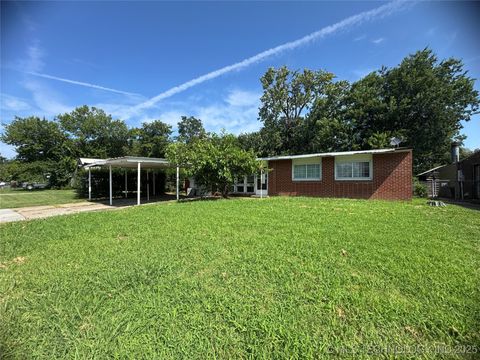
$65,000
4
bds
|
1
ba
|
1,014
sqft
|
built
1954
7847 E Latimer Pl, Tulsa, OK 74115
$823
Cash flow
14.8%
Cash-on-Cash Return
15.2%
Cap rate
2.0%
Rent to Value Ratio

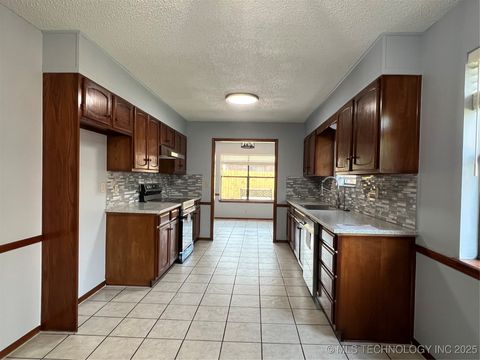
Active
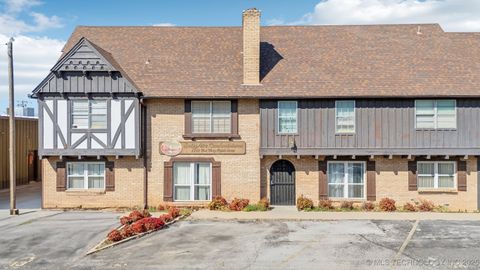
$144,900
3
bds
|
2
ba
|
1,825
sqft
|
built
1940
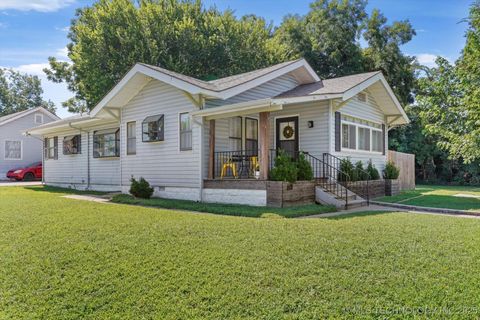
5904 E 7th St, Tulsa, OK 74112
$304
Cash flow
10.9%
Cash-on-Cash Return
8.2%
Cap rate
1.1%
Rent to Value Ratio
1,016 out of 1,343 properties for sale in Tulsa County
Limited Results Shown
Create a free account, or log in to reveal all property listings and enjoy the complete experience.
Active
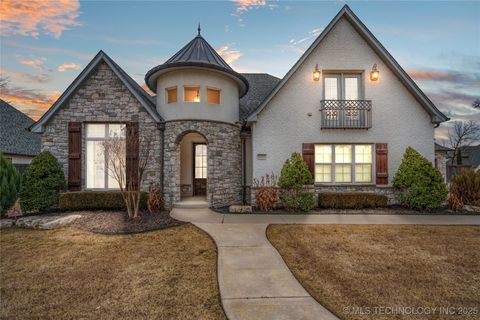
$729,000
4
bds
|
5
ba
|
3,943
sqft
|
built
2014
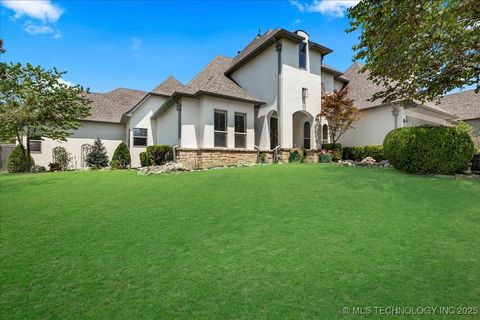
6683 E 122nd Pl S, Bixby, OK 74008
$-1,311
Cash flow
-9.4%
Cash-on-Cash Return
3.5%
Cap rate
0.6%
Rent to Value Ratio
Active
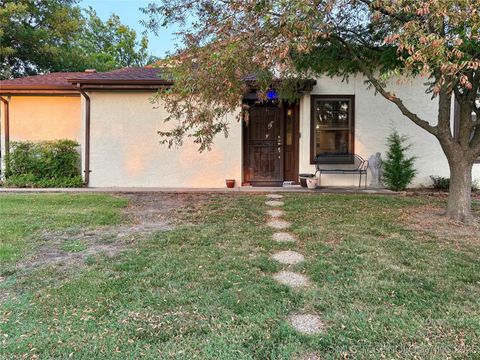
$115,000
1
bds
|
1
ba
|
649
sqft
|
built
1965
1313 E 48th St, Tulsa, OK 74105
$-78
Cash flow
-3.5%
Cash-on-Cash Return
4.9%
Cap rate
1.0%
Rent to Value Ratio
Active
$140,000
2
bds
|
2
ba
|
1,315
sqft
|
built
1985
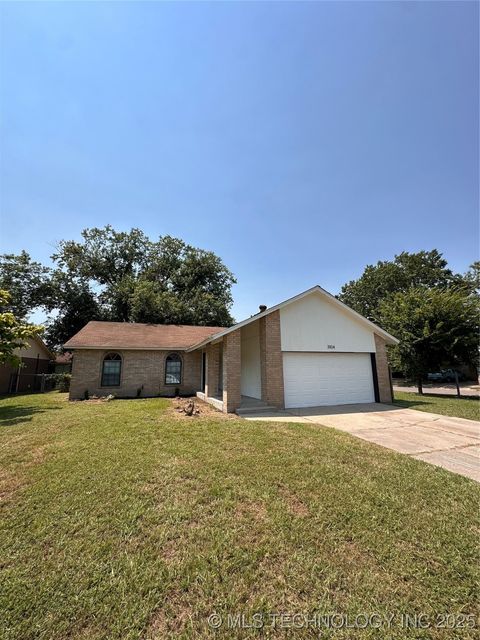
13512 E 30th St, Tulsa, OK 74134
$-79
Cash flow
-2.9%
Cash-on-Cash Return
5.0%
Cap rate
1.0%
Rent to Value Ratio
Active
$329,000
3
bds
|
1
ba
|
1,807
sqft
|
built
1935
259 Waverly Dr, Tulsa, OK 74104
$-295
Cash flow
-4.7%
Cash-on-Cash Return
4.6%
Cap rate
0.7%
Rent to Value Ratio
Active
$470,000
3
bds
|
2
ba
|
1,646
sqft
|
built
1930
1528 S Columbia Pl, Tulsa, OK 74104
$-1,275
Cash flow
-14.2%
Cash-on-Cash Return
2.4%
Cap rate
0.4%
Rent to Value Ratio
Active
$179,900
3
bds
|
2
ba
|
941
sqft
|
built
1930
2823 E 1st St, Tulsa, OK 74104
$-152
Cash flow
-4.4%
Cash-on-Cash Return
4.7%
Cap rate
0.7%
Rent to Value Ratio
Active
$305,000
4
bds
|
2
ba
|
2,326
sqft
|
built
1972
6983 S Oswego Ave, Tulsa, OK 74136
$-323
Cash flow
-5.5%
Cash-on-Cash Return
4.4%
Cap rate
0.7%
Rent to Value Ratio
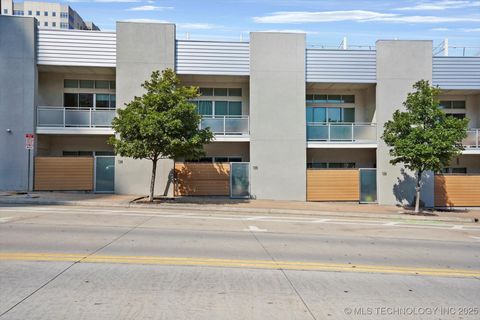
Active
$225,000
1
bds
|
1
ba
|
910
sqft
|
built
2014
130 S Boulder Ave, Tulsa, OK 74103
$27
Cash flow
0.6%
Cash-on-Cash Return
5.8%
Cap rate
0.8%
Rent to Value Ratio
Active
$328,590
4
bds
|
3
ba
|
2,434
sqft
|
built
1983
8519 E 64th St, Tulsa, OK 74133
$-575
Cash flow
-9.1%
Cash-on-Cash Return
3.6%
Cap rate
0.5%
Rent to Value Ratio
Active
$165,000
4
bds
|
2
ba
|
1,512
sqft
|
built
1965
1070 N Irvington Ave, Tulsa, OK 74115
$-10
Cash flow
-0.3%
Cash-on-Cash Return
5.6%
Cap rate
0.8%
Rent to Value Ratio
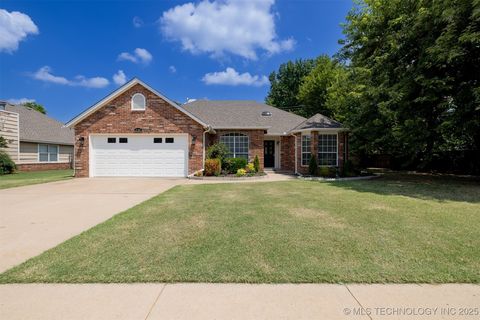
Active
$299,000
3
bds
|
2
ba
|
1,911
sqft
|
built
1996
4717 S Ash Ave, Broken Arrow, OK 74011
$-368
Cash flow
-6.4%
Cash-on-Cash Return
4.2%
Cap rate
0.6%
Rent to Value Ratio
Active
$2,100,000
4
bds
|
6
ba
|
7,260
sqft
|
built
1999
11428 S Sandusky Ave, Tulsa, OK 74137
$-8,717
Cash flow
-21.7%
Cash-on-Cash Return
0.7%
Cap rate
0.2%
Rent to Value Ratio
Active
$427,500
3
bds
|
3
ba
|
1,973
sqft
|
built
1993
2445 E 17th Pl, Tulsa, OK 74104
$-622
Cash flow
-7.6%
Cash-on-Cash Return
3.9%
Cap rate
0.6%
Rent to Value Ratio
Active
$335,000
4
bds
|
2
ba
|
2,076
sqft
|
built
2012
13520 S Poplar Ct, Glenpool, OK 74033
$-488
Cash flow
-7.6%
Cash-on-Cash Return
3.9%
Cap rate
0.6%
Rent to Value Ratio
Active
$1,695,000
4
bds
|
5
ba
|
4,651
sqft
|
built
1994
2616 E 33rd St, Tulsa, OK 74105
$-5,234
Cash flow
-16.1%
Cash-on-Cash Return
2.0%
Cap rate
0.4%
Rent to Value Ratio
Active
$330,000
4
bds
|
2
ba
|
1,961
sqft
|
built
2010
2003 E 133rd Ct, Bixby, OK 74008
$-437
Cash flow
-6.9%
Cash-on-Cash Return
4.1%
Cap rate
0.6%
Rent to Value Ratio
Active
$214,900
3
bds
|
2
ba
|
1,294
sqft
|
built
1958
8421 E 133rd St S, Bixby, OK 74008
$-168
Cash flow
-4.1%
Cash-on-Cash Return
4.7%
Cap rate
0.7%
Rent to Value Ratio
Active
$375,000
3
bds
|
2
ba
|
1,720
sqft
|
built
1957
5125 E 27th Pl, Tulsa, OK 74114
$-849
Cash flow
-11.8%
Cash-on-Cash Return
3.0%
Cap rate
0.4%
Rent to Value Ratio
Active
$250,000
4
bds
|
2
ba
|
2,041
sqft
|
built
1983
3305 W Quincy St, Broken Arrow, OK 74012
$-130
Cash flow
-2.7%
Cash-on-Cash Return
5.1%
Cap rate
0.7%
Rent to Value Ratio
Active
$149,000
2
bds
|
2
ba
|
1,064
sqft
|
built
1982
9009 S Delaware Ave, Tulsa, OK 74137
$-167
Cash flow
-5.8%
Cash-on-Cash Return
4.3%
Cap rate
0.9%
Rent to Value Ratio
Active
$215,000
2
bds
|
1
ba
|
1,140
sqft
|
built
1940
1417 S Quebec Ave, Tulsa, OK 74112
$-248
Cash flow
-6.0%
Cash-on-Cash Return
4.3%
Cap rate
0.7%
Rent to Value Ratio
Active
$799,000
4
bds
|
3
ba
|
2,705
sqft
|
built
1939
3019 S Boston Ct, Tulsa, OK 74114
$-1,882
Cash flow
-12.3%
Cash-on-Cash Return
2.9%
Cap rate
0.5%
Rent to Value Ratio
Active
$289,900
3
bds
|
2
ba
|
1,774
sqft
|
built
1974
7740 S 72nd East Ave, Tulsa, OK 74133
$-394
Cash flow
-7.1%
Cash-on-Cash Return
4.0%
Cap rate
0.6%
Rent to Value Ratio
Active
$240,000
3
bds
|
2
ba
|
1,300
sqft
|
built
1920
601 S Yorktown Ave, Tulsa, OK 74104
$-265
Cash flow
-5.8%
Cash-on-Cash Return
4.4%
Cap rate
0.6%
Rent to Value Ratio
Active
$230,000
3
bds
|
2
ba
|
1,225
sqft
|
built
1975
3104 S 115th East Ave, Tulsa, OK 74146
$-236
Cash flow
-5.4%
Cash-on-Cash Return
4.4%
Cap rate
0.6%
Rent to Value Ratio
Active
$283,500
3
bds
|
2
ba
|
1,439
sqft
|
built
2023
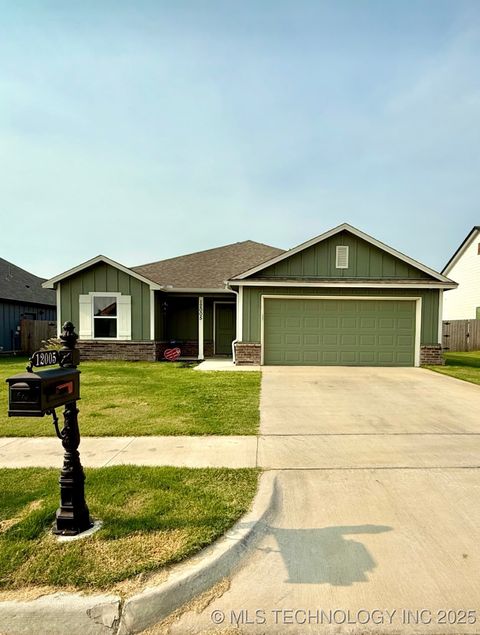
12005 E 108th Pl N, Owasso, OK 74055
$-213
Cash flow
-3.9%
Cash-on-Cash Return
4.8%
Cap rate
0.6%
Rent to Value Ratio
Active
$769,900
5
bds
|
6
ba
|
5,363
sqft
|
built
2007
7207 E 112th Pl S, Bixby, OK 74008
$-1,398
Cash flow
-9.5%
Cash-on-Cash Return
3.5%
Cap rate
0.6%
Rent to Value Ratio
Active
$314,500
4
bds
|
2
ba
|
1,849
sqft
|
built
2017
10329 S Nathan St, Jenks, OK 74037
$-564
Cash flow
-9.4%
Cash-on-Cash Return
3.5%
Cap rate
0.6%
Rent to Value Ratio
Active
$314,000
4
bds
|
3
ba
|
2,401
sqft
|
built
1996
115 S Redbud Pl, Broken Arrow, OK 74012
$-244
Cash flow
-4.1%
Cash-on-Cash Return
4.7%
Cap rate
0.7%
Rent to Value Ratio
Active
$624,900
5
bds
|
4
ba
|
3,552
sqft
|
built
2022
14460 S College Ave, Bixby, OK 74008
$-789
Cash flow
-6.6%
Cash-on-Cash Return
4.2%
Cap rate
0.6%
Rent to Value Ratio

Active
$274,900
2
bds
|
2
ba
|
1,370
sqft
|
built
1938
1425 N Denver Ave, Tulsa, OK 74106
$-624
Cash flow
-11.8%
Cash-on-Cash Return
3.0%
Cap rate
0.5%
Rent to Value Ratio
Active
$280,000
3
bds
|
2
ba
|
1,758
sqft
|
built
1999
10903 E 95th St N, Owasso, OK 74055
$-253
Cash flow
-4.7%
Cash-on-Cash Return
4.6%
Cap rate
0.6%
Rent to Value Ratio
Active
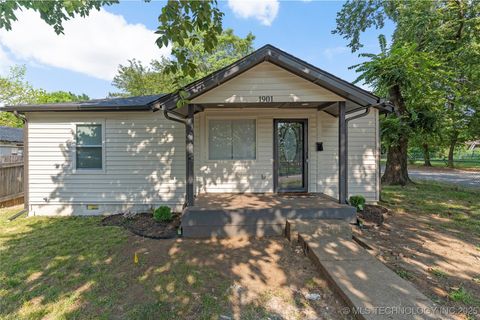
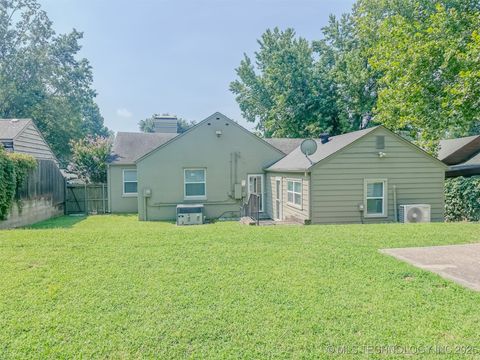
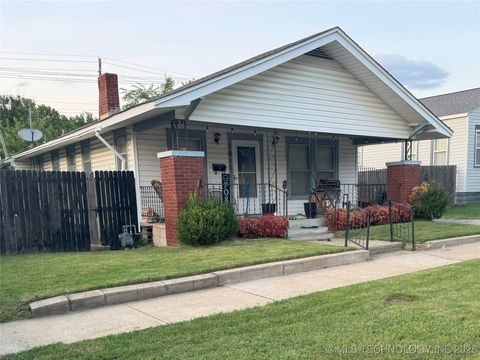
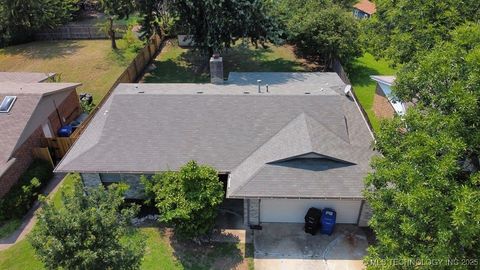
$155,000
3
bds
|
1
ba
|
909
sqft
|
built
1940
1901 N Atlanta Ave, Tulsa, OK 74110
$55
Cash flow
1.9%
Cash-on-Cash Return
6.1%
Cap rate
0.8%
Rent to Value Ratio
Active
$395,000
3
bds
|
2
ba
|
1,805
sqft
|
built
1936
1237 E 31st Ct, Tulsa, OK 74105
$-700
Cash flow
-9.2%
Cash-on-Cash Return
3.6%
Cap rate
0.5%
Rent to Value Ratio
Active
$185,000
3
bds
|
2
ba
|
1,312
sqft
|
built
1920
1811 W Easton Ct, Tulsa, OK 74127
$-99
Cash flow
-2.8%
Cash-on-Cash Return
5.0%
Cap rate
0.7%
Rent to Value Ratio
Active
$208,000
3
bds
|
1
ba
|
1,050
sqft
|
built
1978
2600 S Sycamore Ave, Broken Arrow, OK 74012
$-63
Cash flow
-1.6%
Cash-on-Cash Return
5.3%
Cap rate
0.8%
Rent to Value Ratio
Active
$334,900
4
bds
|
2
ba
|
2,406
sqft
|
built
1957
5127 S Columbia Ave, Tulsa, OK 74105
$-463
Cash flow
-7.2%
Cash-on-Cash Return
4.0%
Cap rate
0.6%
Rent to Value Ratio
Active
$400,000
6
bds
|
9
ba
|
7,659
sqft
|
built
2023
3514 S Yale Ave, Tulsa, OK 74135
$-453
Cash flow
-5.9%
Cash-on-Cash Return
4.3%
Cap rate
0.6%
Rent to Value Ratio