Ormond Beach, FL Investment Properties for Sale
Browse homes for sale and investment properties in Ormond Beach, FL. Refine your search by price, property type, or more.
Best cash flowing properties in Ormond Beach, FL

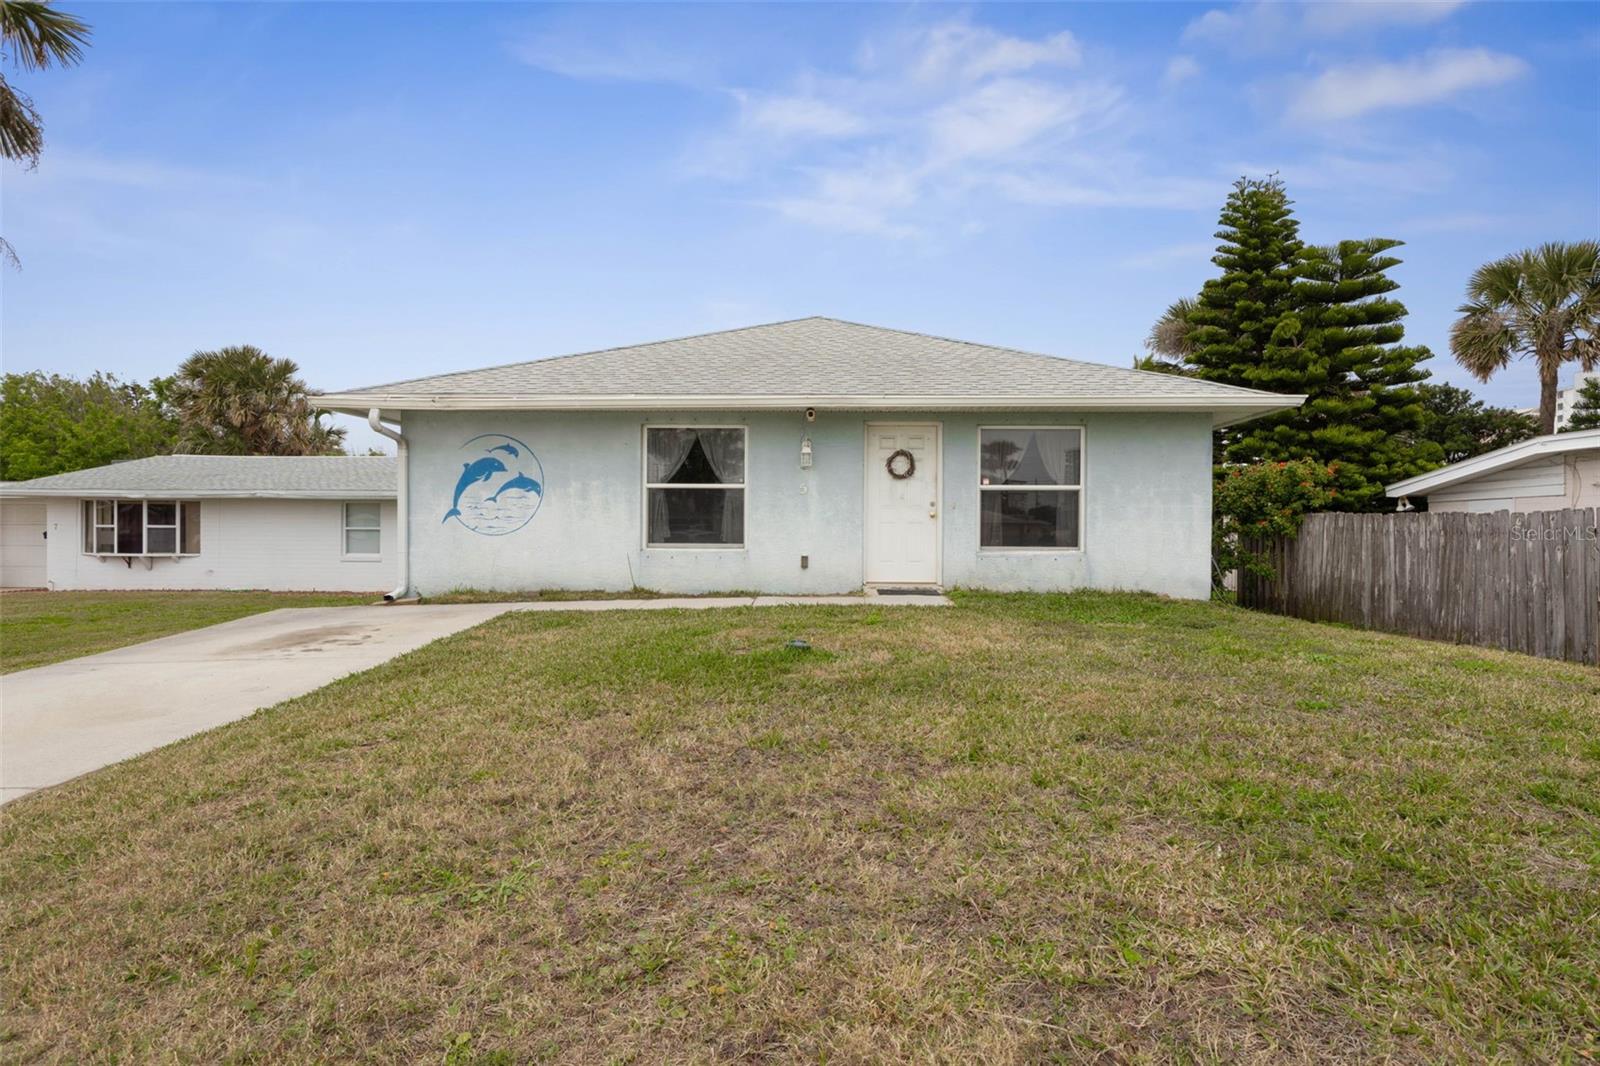
Active
$140,000
2
bds
|
3
ba
|
1,252
sqft
|
built
1973
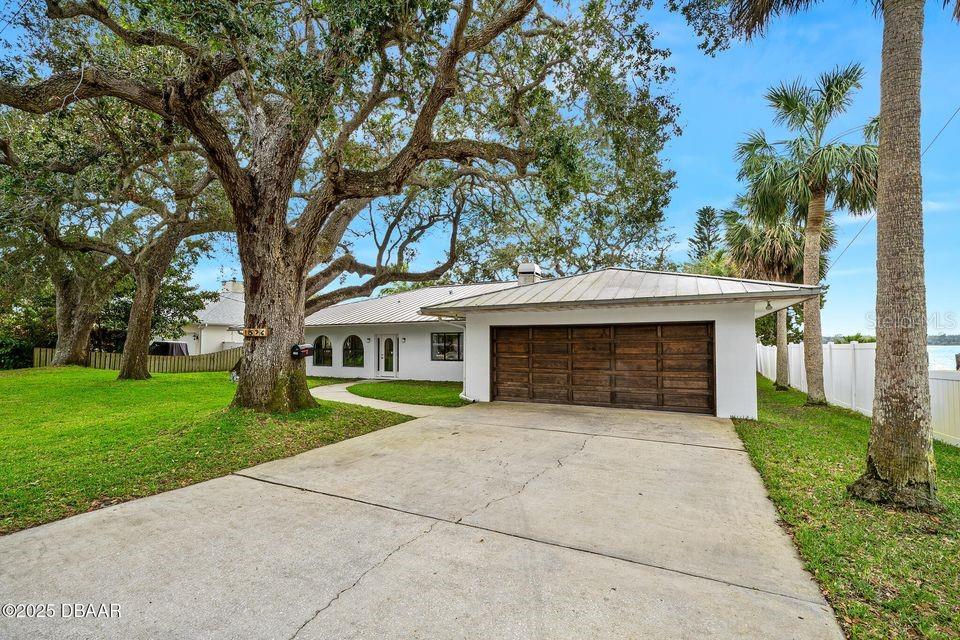
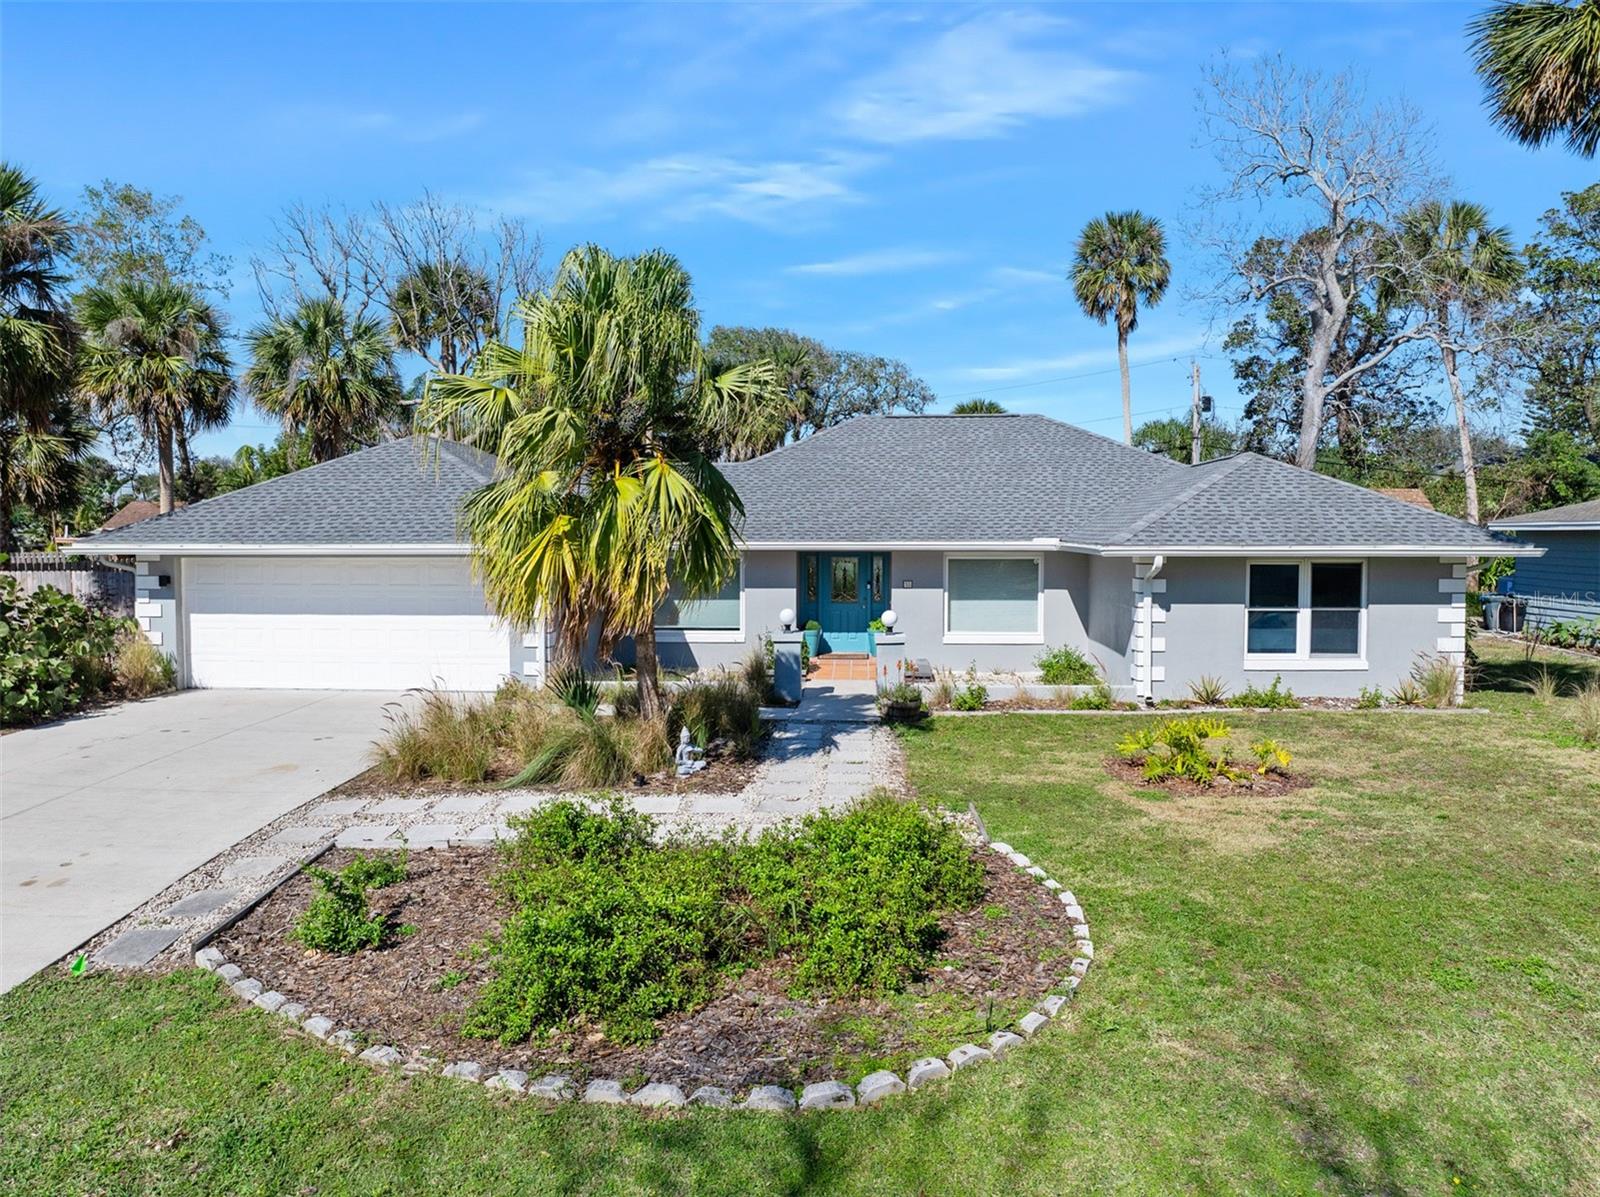
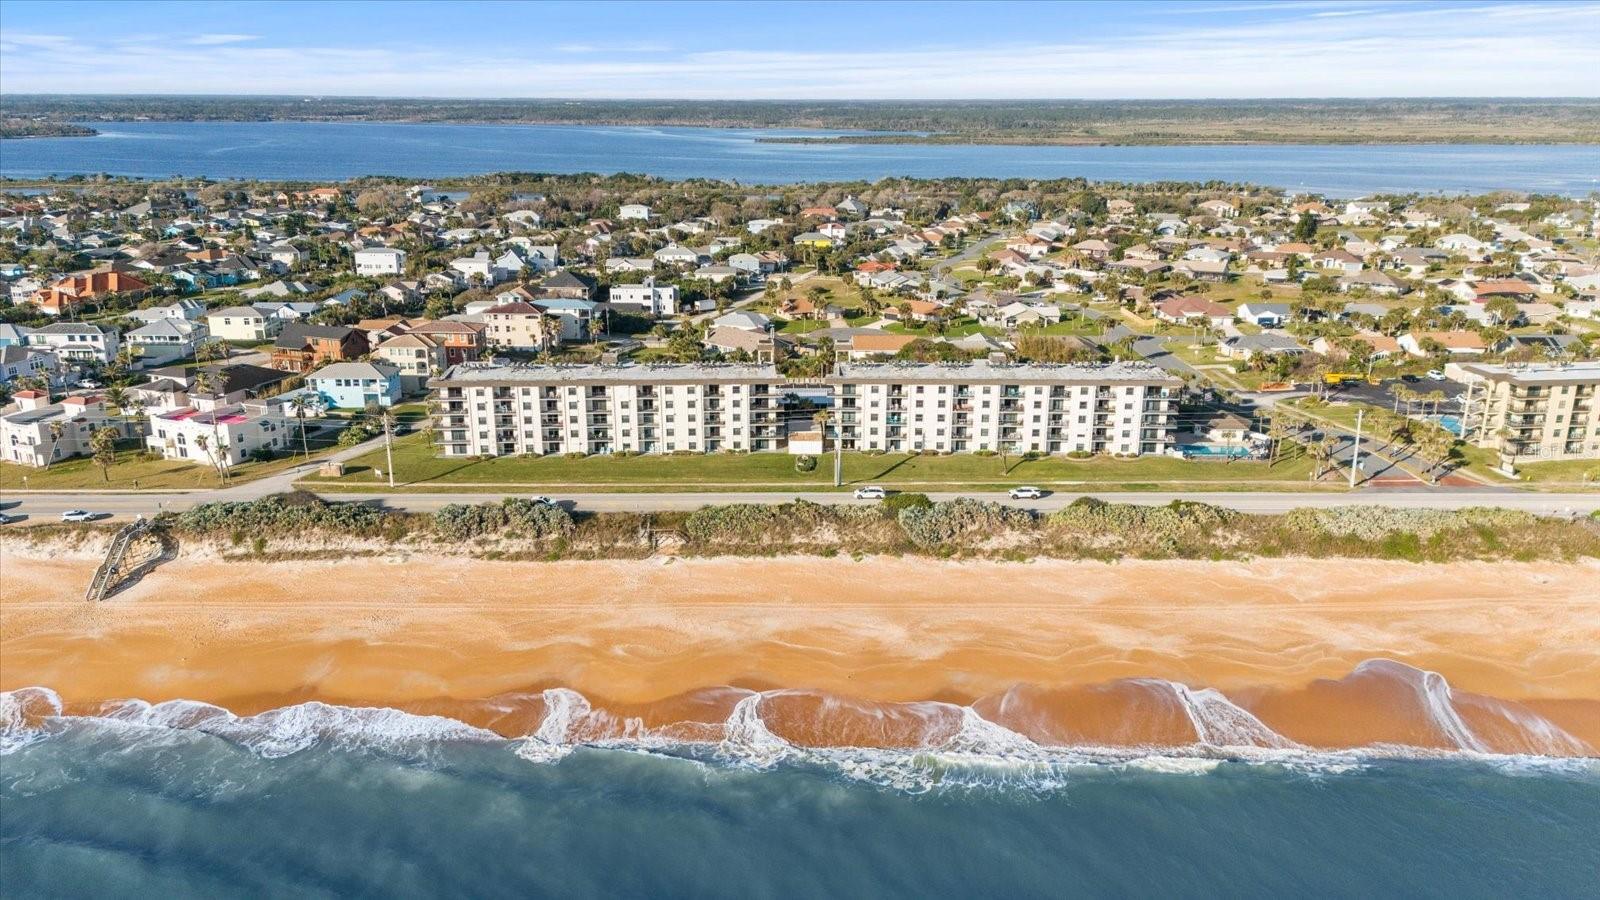
5500 Ocean Shore Blvd, Ormond Beach, FL 32176
$160
Cash flow
6.0%
Cash-on-Cash Return
7.5%
Cap rate
1.1%
Rent to Value Ratio
Active
$210,000
2
bds
|
2
ba
|
1,100
sqft
|
built
1984
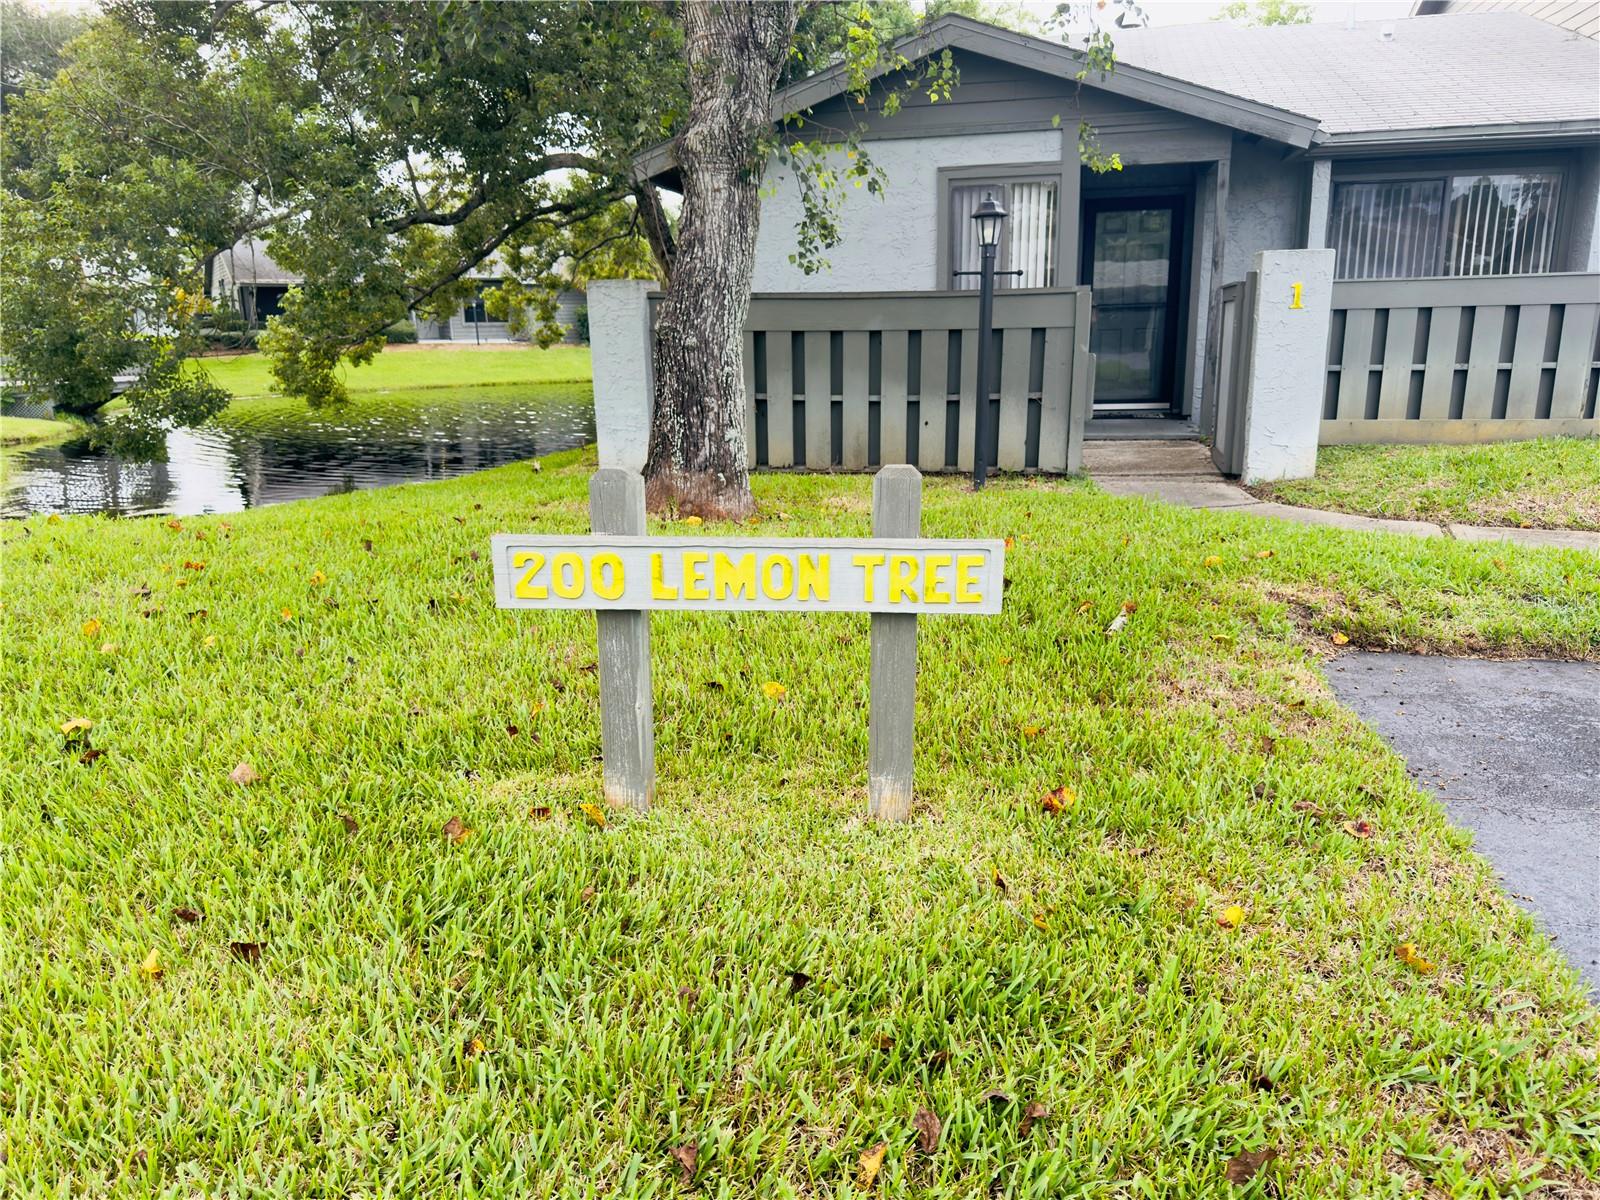
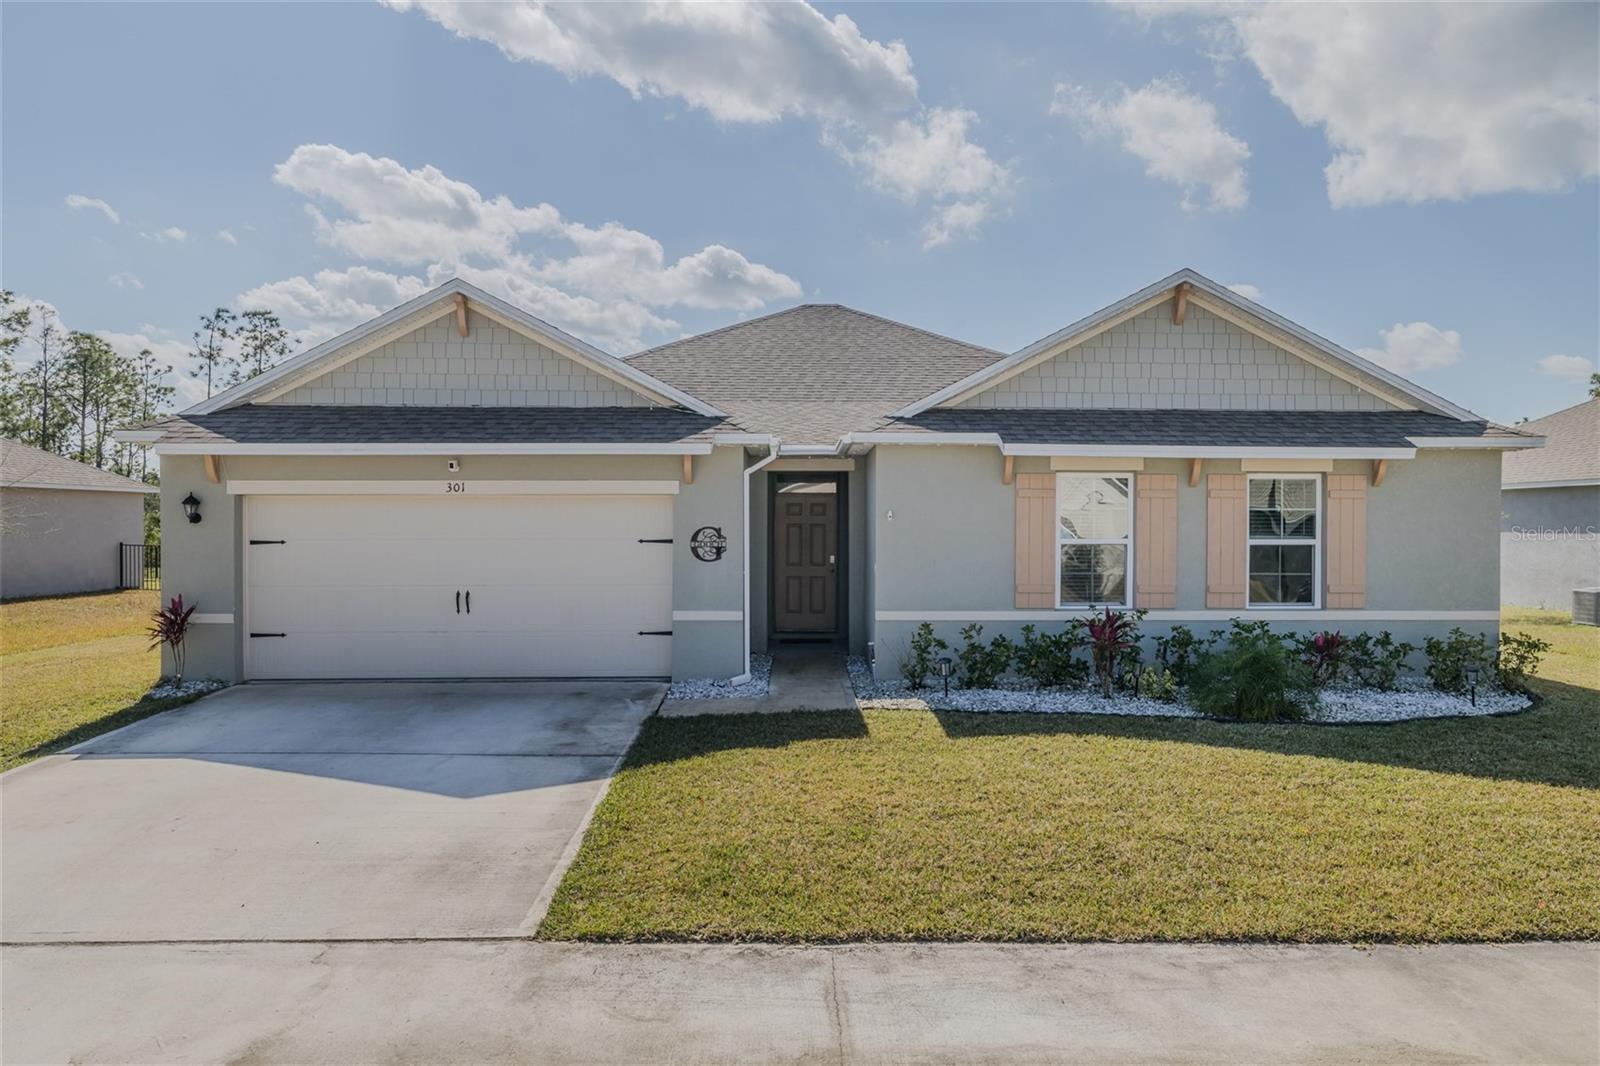
200 Lemon Tree Ln, Ormond Beach, FL 32174
$126
Cash flow
3.1%
Cash-on-Cash Return
6.9%
Cap rate
0.9%
Rent to Value Ratio
265 out of 305 properties for sale in Ormond Beach, FL
Limited Results Shown
Create a free account, or log in to reveal all property listings and enjoy the complete experience.
Active
$399,000
3
bds
|
2
ba
|
1,376
sqft
|
built
1962
20 Warwick Ave, Ormond Beach, FL 32174
$-1,181
Cash flow
-15.4%
Cash-on-Cash Return
2.6%
Cap rate
0.4%
Rent to Value Ratio
Active
$350,000
3
bds
|
2
ba
|
1,610
sqft
|
built
1957
11 Briggs Dr, Ormond Beach, FL 32176
$-616
Cash flow
-9.2%
Cash-on-Cash Return
4.0%
Cap rate
0.7%
Rent to Value Ratio
Active
$849,900
4
bds
|
3
ba
|
2,745
sqft
|
built
2023
510 Stirling Bridge Dr, Ormond Beach, FL 32174
$-2,286
Cash flow
-14.0%
Cash-on-Cash Return
2.9%
Cap rate
0.5%
Rent to Value Ratio
Active
$329,000
3
bds
|
2
ba
|
1,684
sqft
|
built
2006
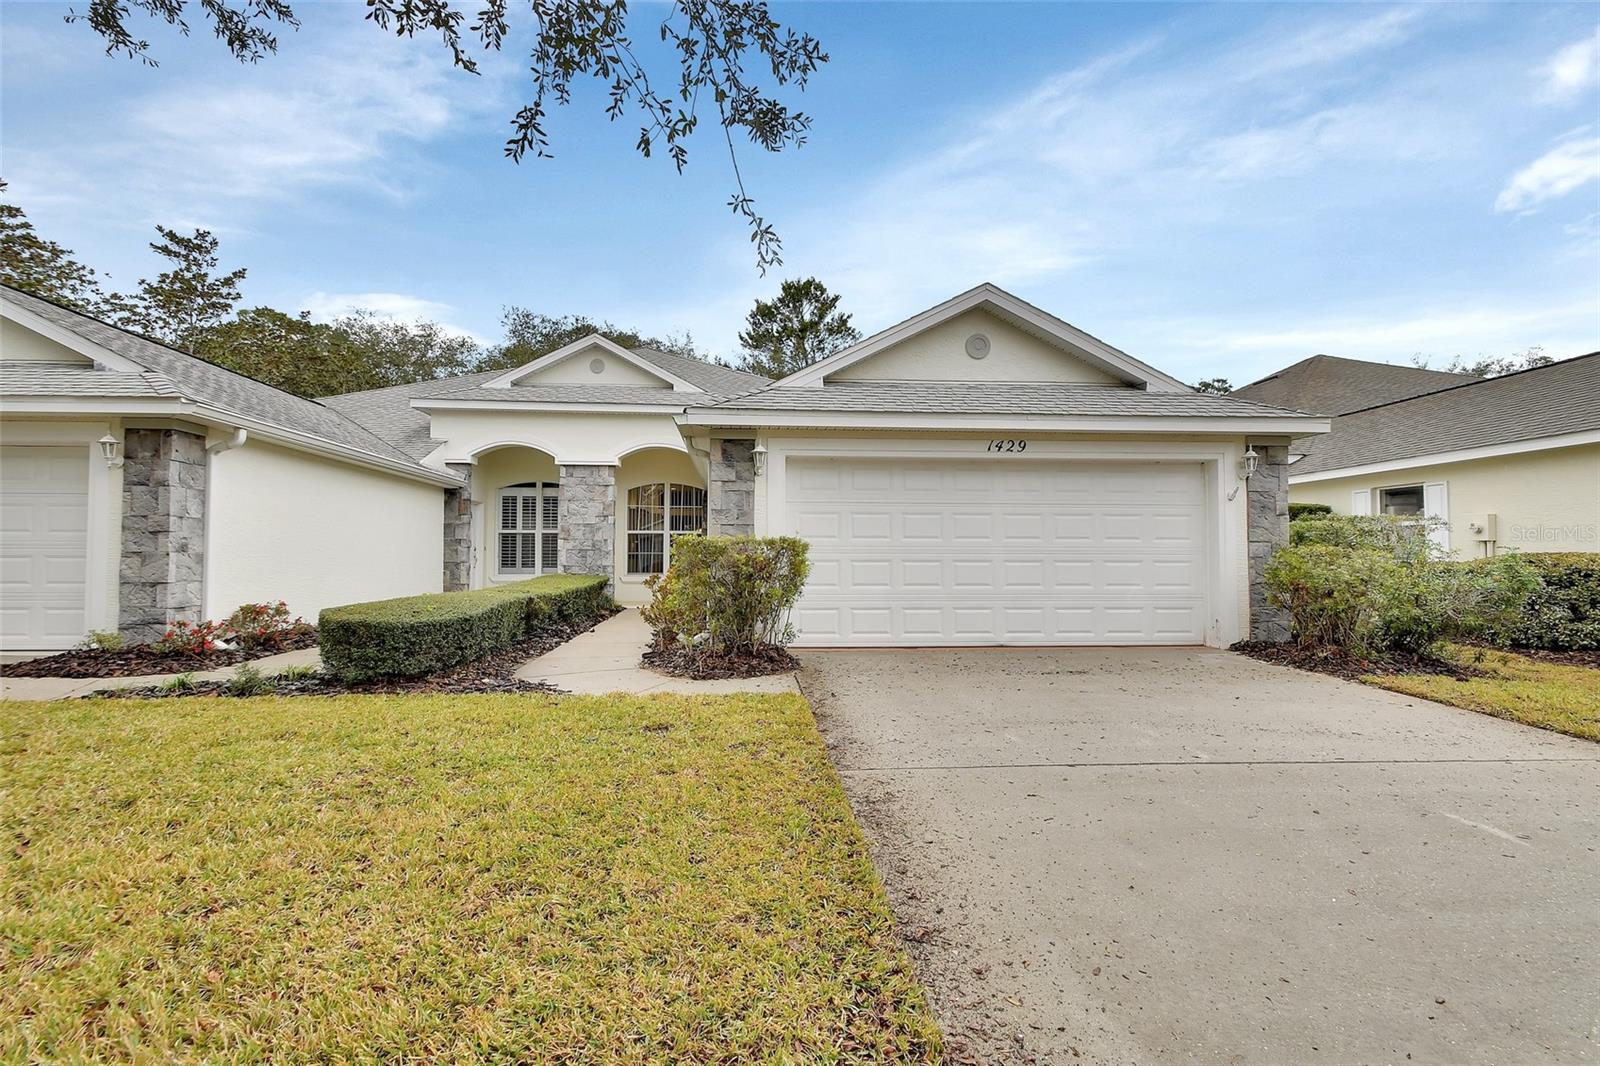
1429 Carlow Cir, Ormond Beach, FL 32174
$-736
Cash flow
-11.7%
Cash-on-Cash Return
3.5%
Cap rate
0.7%
Rent to Value Ratio
Active
$299,000
2
bds
|
2
ba
|
1,475
sqft
|
built
1984
195 Deer Lake Cir, Ormond Beach, FL 32174
$-343
Cash flow
-6.0%
Cash-on-Cash Return
4.8%
Cap rate
0.7%
Rent to Value Ratio
Active
$210,000
2
bds
|
2
ba
|
1,100
sqft
|
built
1984
200 Lemon Tree Ln, Ormond Beach, FL 32174
$126
Cash flow
3.1%
Cash-on-Cash Return
6.9%
Cap rate
0.9%
Rent to Value Ratio

Active
$535,000
5
bds
|
3
ba
|
1,737
sqft
|
built
1964
40 Juniper Dr, Ormond Beach, FL 32176
$-928
Cash flow
-9.0%
Cash-on-Cash Return
4.1%
Cap rate
0.6%
Rent to Value Ratio
Active
$458,000
3
bds
|
2
ba
|
1,392
sqft
|
built
1961
18 Silk Oaks Dr, Ormond Beach, FL 32176
$-823
Cash flow
-9.4%
Cash-on-Cash Return
4.0%
Cap rate
0.6%
Rent to Value Ratio
Active
$2,450,000
4
bds
|
3
ba
|
5,750
sqft
|
built
1994
1405 Oak Forest Dr, Ormond Beach, FL 32174
$-11,555
Cash flow
-24.6%
Cash-on-Cash Return
0.5%
Cap rate
0.2%
Rent to Value Ratio
Pending
$1,250,000
3
bds
|
3
ba
|
3,667
sqft
|
built
1953
1596 John Anderson Dr, Ormond Beach, FL 32176
$-3,846
Cash flow
-16.1%
Cash-on-Cash Return
2.5%
Cap rate
0.4%
Rent to Value Ratio
Active
$459,900
3
bds
|
3
ba
|
2,078
sqft
|
built
2023
17 Longridge Ln, Ormond Beach, FL 32174
$-1,225
Cash flow
-13.9%
Cash-on-Cash Return
3.0%
Cap rate
0.6%
Rent to Value Ratio
Active
$369,000
2
bds
|
2
ba
|
1,510
sqft
|
built
2017
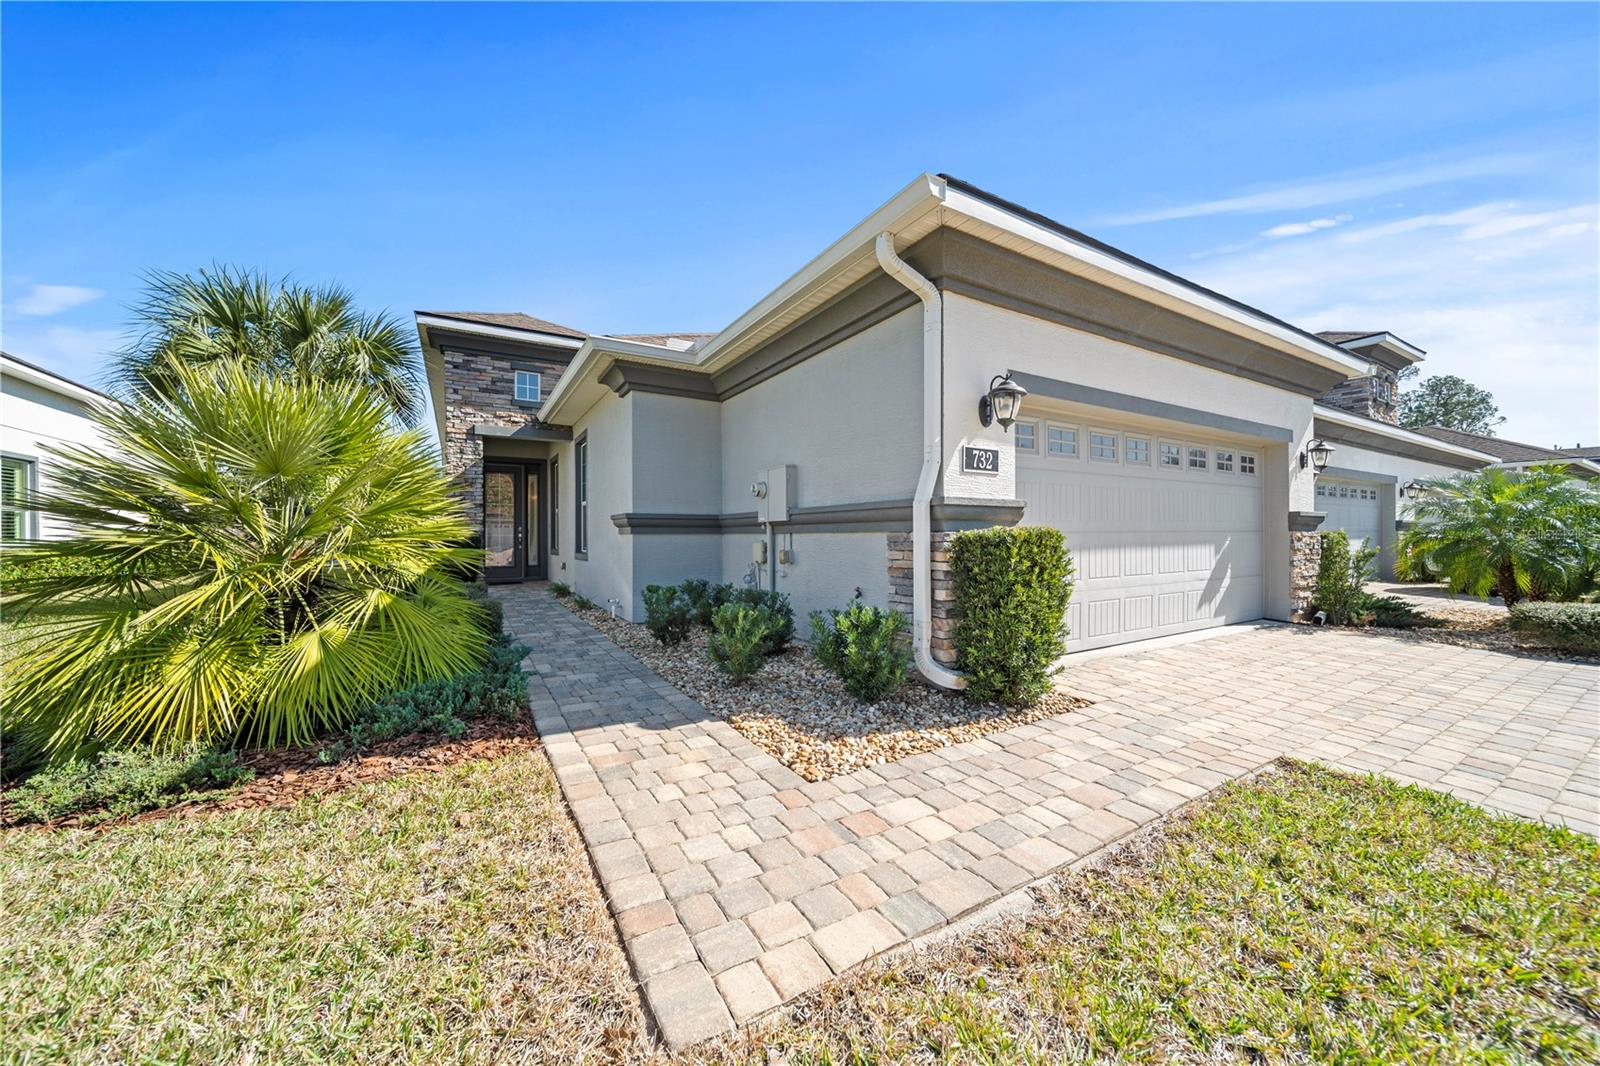
732 Aldenham Ln, Ormond Beach, FL 32174
$-917
Cash flow
-13.0%
Cash-on-Cash Return
3.2%
Cap rate
0.7%
Rent to Value Ratio
Active
$460,000
2
bds
|
2
ba
|
1,562
sqft
|
built
2021
131 Longridge Ln, Ormond Beach, FL 32174
$-1,112
Cash flow
-12.6%
Cash-on-Cash Return
3.2%
Cap rate
0.6%
Rent to Value Ratio
Active
$294,900
3
bds
|
2
ba
|
1,362
sqft
|
built
1967
354 Fir St, Ormond Beach, FL 32174
$-210
Cash flow
-3.7%
Cash-on-Cash Return
5.3%
Cap rate
0.8%
Rent to Value Ratio
Active
$479,900
4
bds
|
3
ba
|
2,298
sqft
|
built
2023
2236 Oconnel Dr, Ormond Beach, FL 32174
$-617
Cash flow
-6.7%
Cash-on-Cash Return
4.6%
Cap rate
0.7%
Rent to Value Ratio
Active
$345,000
3
bds
|
2
ba
|
1,701
sqft
|
built
1997
1187 Athlone Way, Ormond Beach, FL 32174
$-516
Cash flow
-7.8%
Cash-on-Cash Return
4.4%
Cap rate
0.7%
Rent to Value Ratio
Active
$619,400
3
bds
|
3
ba
|
2,188
sqft
|
built
1960
681 N Halifax Dr, Ormond Beach, FL 32176
$-971
Cash flow
-8.2%
Cash-on-Cash Return
4.3%
Cap rate
0.6%
Rent to Value Ratio
Active
$575,900
4
bds
|
3
ba
|
2,082
sqft
|
built
1975
13 Sandcastle Dr, Ormond Beach, FL 32176
$-859
Cash flow
-7.8%
Cash-on-Cash Return
4.4%
Cap rate
0.6%
Rent to Value Ratio
Active
$426,999
4
bds
|
2
ba
|
2,334
sqft
|
built
2022
301 Sunset Point Dr, Ormond Beach, FL 32174
$-811
Cash flow
-9.9%
Cash-on-Cash Return
3.9%
Cap rate
0.7%
Rent to Value Ratio
Active
$273,700
2
bds
|
2
ba
|
1,087
sqft
|
built
1973
2100 Ocean Shore Blvd, Ormond Beach, FL 32176
$-415
Cash flow
-7.9%
Cash-on-Cash Return
4.3%
Cap rate
0.7%
Rent to Value Ratio
Active
$875,000
4
bds
|
3
ba
|
2,592
sqft
|
built
2022
307 Stirling Bridge Dr, Ormond Beach, FL 32174
$-1,889
Cash flow
-11.3%
Cash-on-Cash Return
3.6%
Cap rate
0.6%
Rent to Value Ratio
Active
$295,000
2
bds
|
2
ba
|
1,152
sqft
|
built
2010
5 Alamanda Dr, Ormond Beach, FL 32176
$3
Cash flow
0.1%
Cash-on-Cash Return
6.2%
Cap rate
0.8%
Rent to Value Ratio
Active
$499,900
3
bds
|
2
ba
|
1,943
sqft
|
built
2000
39 Ormond Green Blvd, Ormond Beach, FL 32174
$-920
Cash flow
-9.6%
Cash-on-Cash Return
3.9%
Cap rate
0.6%
Rent to Value Ratio
Active
$450,000
2
bds
|
2
ba
|
1,342
sqft
|
built
1974
111 S Atlantic Ave, Ormond Beach, FL 32176
$-753
Cash flow
-8.7%
Cash-on-Cash Return
4.1%
Cap rate
0.6%
Rent to Value Ratio

Active
$467,500
2
bds
|
2
ba
|
1,721
sqft
|
built
1955
55 Neptune Ave, Ormond Beach, FL 32176
$-760
Cash flow
-8.5%
Cash-on-Cash Return
4.2%
Cap rate
0.7%
Rent to Value Ratio
Active
$1,200,000
3
bds
|
2
ba
|
1,380
sqft
|
built
1957
8 Ocean Dr, Ormond Beach, FL 32176
$-4,339
Cash flow
-18.9%
Cash-on-Cash Return
1.8%
Cap rate
0.4%
Rent to Value Ratio
Active
$674,000
3
bds
|
3
ba
|
2,402
sqft
|
built
2020
209 Heatherwood Ct, Ormond Beach, FL 32174
$-1,665
Cash flow
-12.9%
Cash-on-Cash Return
3.2%
Cap rate
0.6%
Rent to Value Ratio
Active
$349,000
2
bds
|
2
ba
|
1,562
sqft
|
built
2018
830 Aldenham Ln, Ormond Beach, FL 32174
$-553
Cash flow
-8.3%
Cash-on-Cash Return
4.2%
Cap rate
0.7%
Rent to Value Ratio
Active
$299,900
2
bds
|
2
ba
|
1,275
sqft
|
built
1986
3370 Ocean Shore Blvd, Ormond Beach, FL 32176
$-206
Cash flow
-3.6%
Cash-on-Cash Return
5.3%
Cap rate
0.8%
Rent to Value Ratio

Active
$550,000
3
bds
|
2
ba
|
2,082
sqft
|
built
1982
395 S Atlantic Ave, Ormond Beach, FL 32176
$-1,899
Cash flow
-18.0%
Cash-on-Cash Return
2.0%
Cap rate
0.6%
Rent to Value Ratio
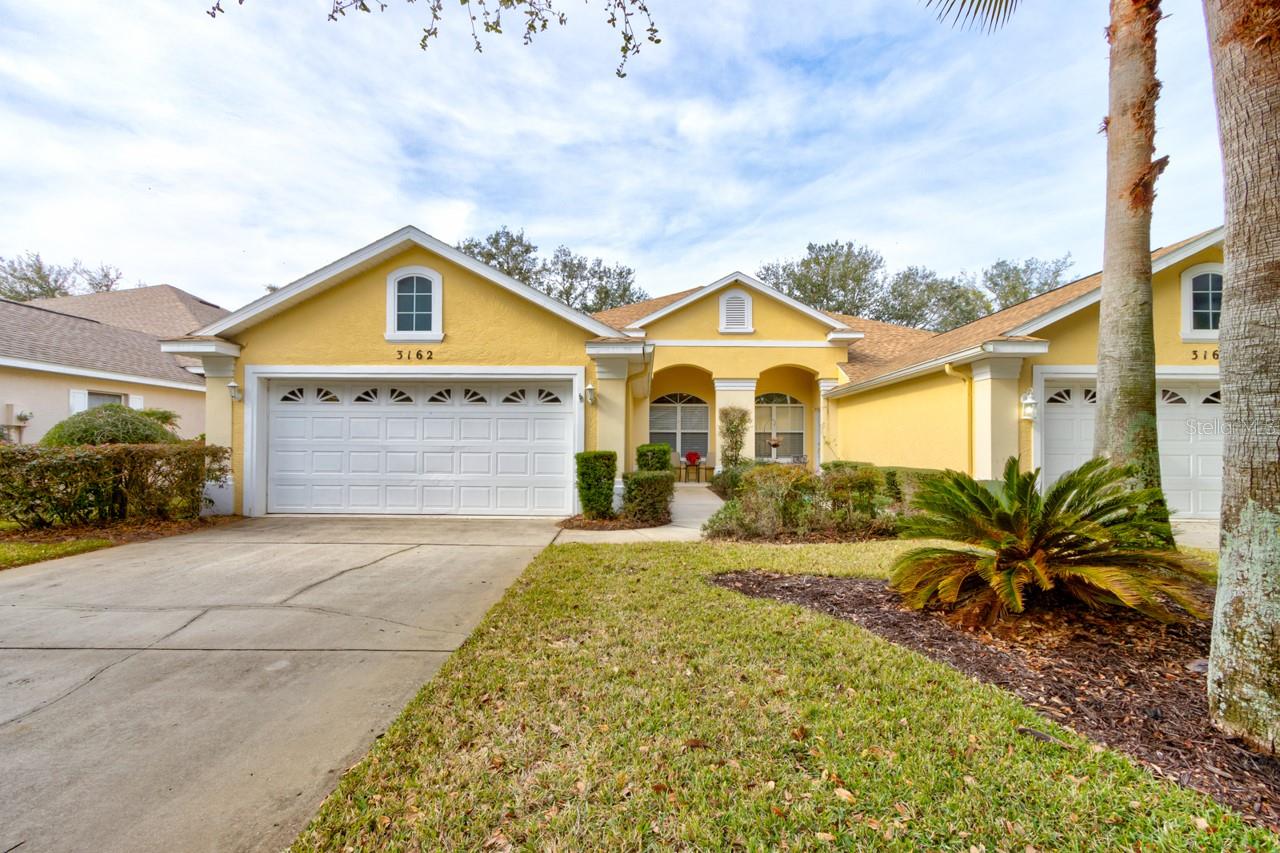
Active
$310,000
3
bds
|
2
ba
|
1,684
sqft
|
built
2001
3162 Kailani Ct, Ormond Beach, FL 32174
$-718
Cash flow
-12.1%
Cash-on-Cash Return
3.4%
Cap rate
0.7%
Rent to Value Ratio
Active
$249,900
3
bds
|
1
ba
|
1,213
sqft
|
built
1961
432 Sauls St, Ormond Beach, FL 32174
$-178
Cash flow
-3.7%
Cash-on-Cash Return
5.3%
Cap rate
0.8%
Rent to Value Ratio
Pending
$369,900
3
bds
|
2
ba
|
1,952
sqft
|
built
2002
12 Peruvian Ln, Ormond Beach, FL 32174
$-326
Cash flow
-4.6%
Cash-on-Cash Return
5.1%
Cap rate
0.7%
Rent to Value Ratio
Active
$430,000
3
bds
|
2
ba
|
1,489
sqft
|
built
1967
1017 Parkwood Dr, Ormond Beach, FL 32174
$-711
Cash flow
-8.6%
Cash-on-Cash Return
4.2%
Cap rate
0.7%
Rent to Value Ratio
Active
$874,900
4
bds
|
4
ba
|
2,449
sqft
|
built
2022
350 Stirling Bridge Dr, Ormond Beach, FL 32174
$-1,687
Cash flow
-10.1%
Cash-on-Cash Return
3.8%
Cap rate
0.6%
Rent to Value Ratio
Active
$340,000
2
bds
|
2
ba
|
873
sqft
|
built
1991
3100 Ocean Shore Blvd, Ormond Beach, FL 32176
$-581
Cash flow
-8.9%
Cash-on-Cash Return
4.1%
Cap rate
0.6%
Rent to Value Ratio
Active
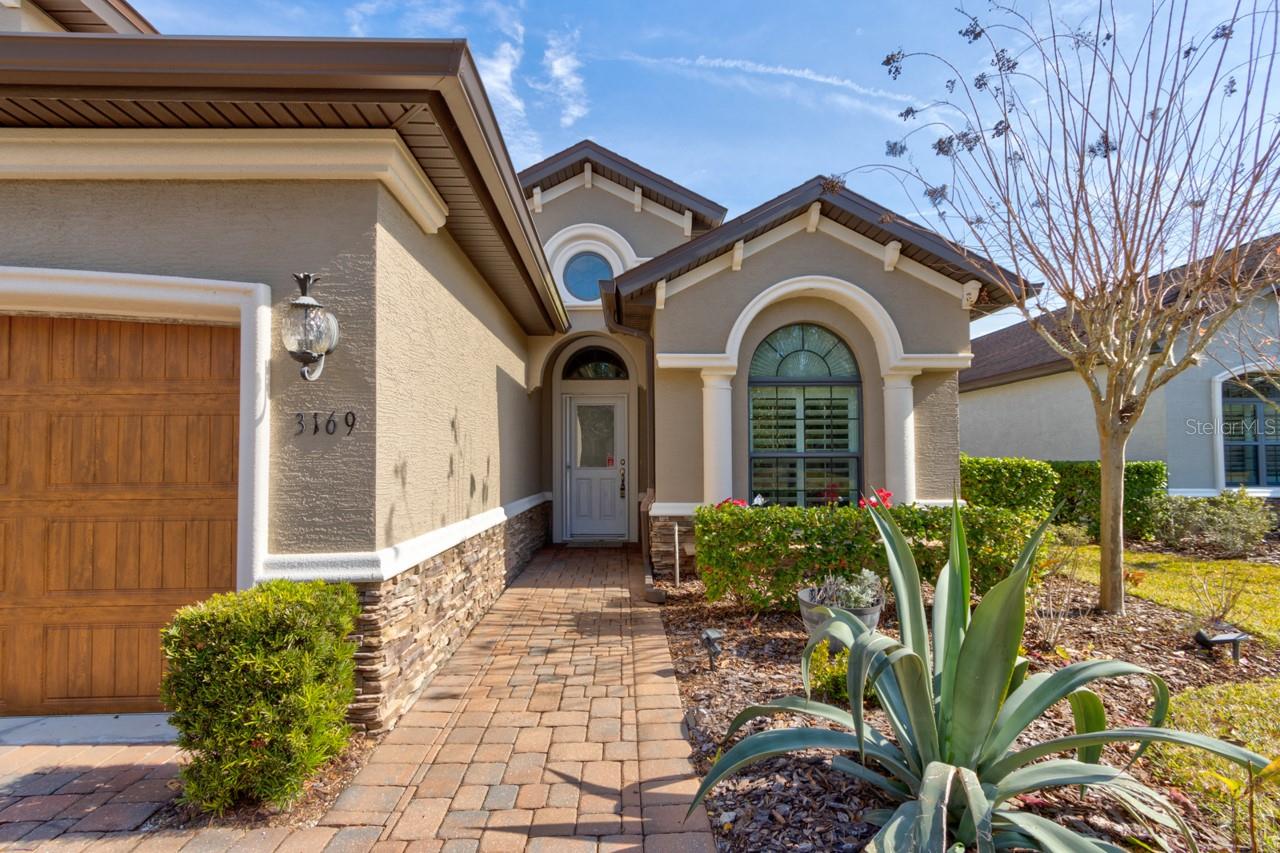
$433,000
3
bds
|
2
ba
|
1,919
sqft
|
built
2014
3169 Connemara Dr, Ormond Beach, FL 32174
$-901
Cash flow
-10.9%
Cash-on-Cash Return
3.6%
Cap rate
0.6%
Rent to Value Ratio
Active
$330,000
2
bds
|
2
ba
|
1,296
sqft
|
built
1958
142 Seton Trl, Ormond Beach, FL 32176
$-361
Cash flow
-5.7%
Cash-on-Cash Return
4.8%
Cap rate
0.8%
Rent to Value Ratio
Active
$485,000
3
bds
|
2
ba
|
2,032
sqft
|
built
2004
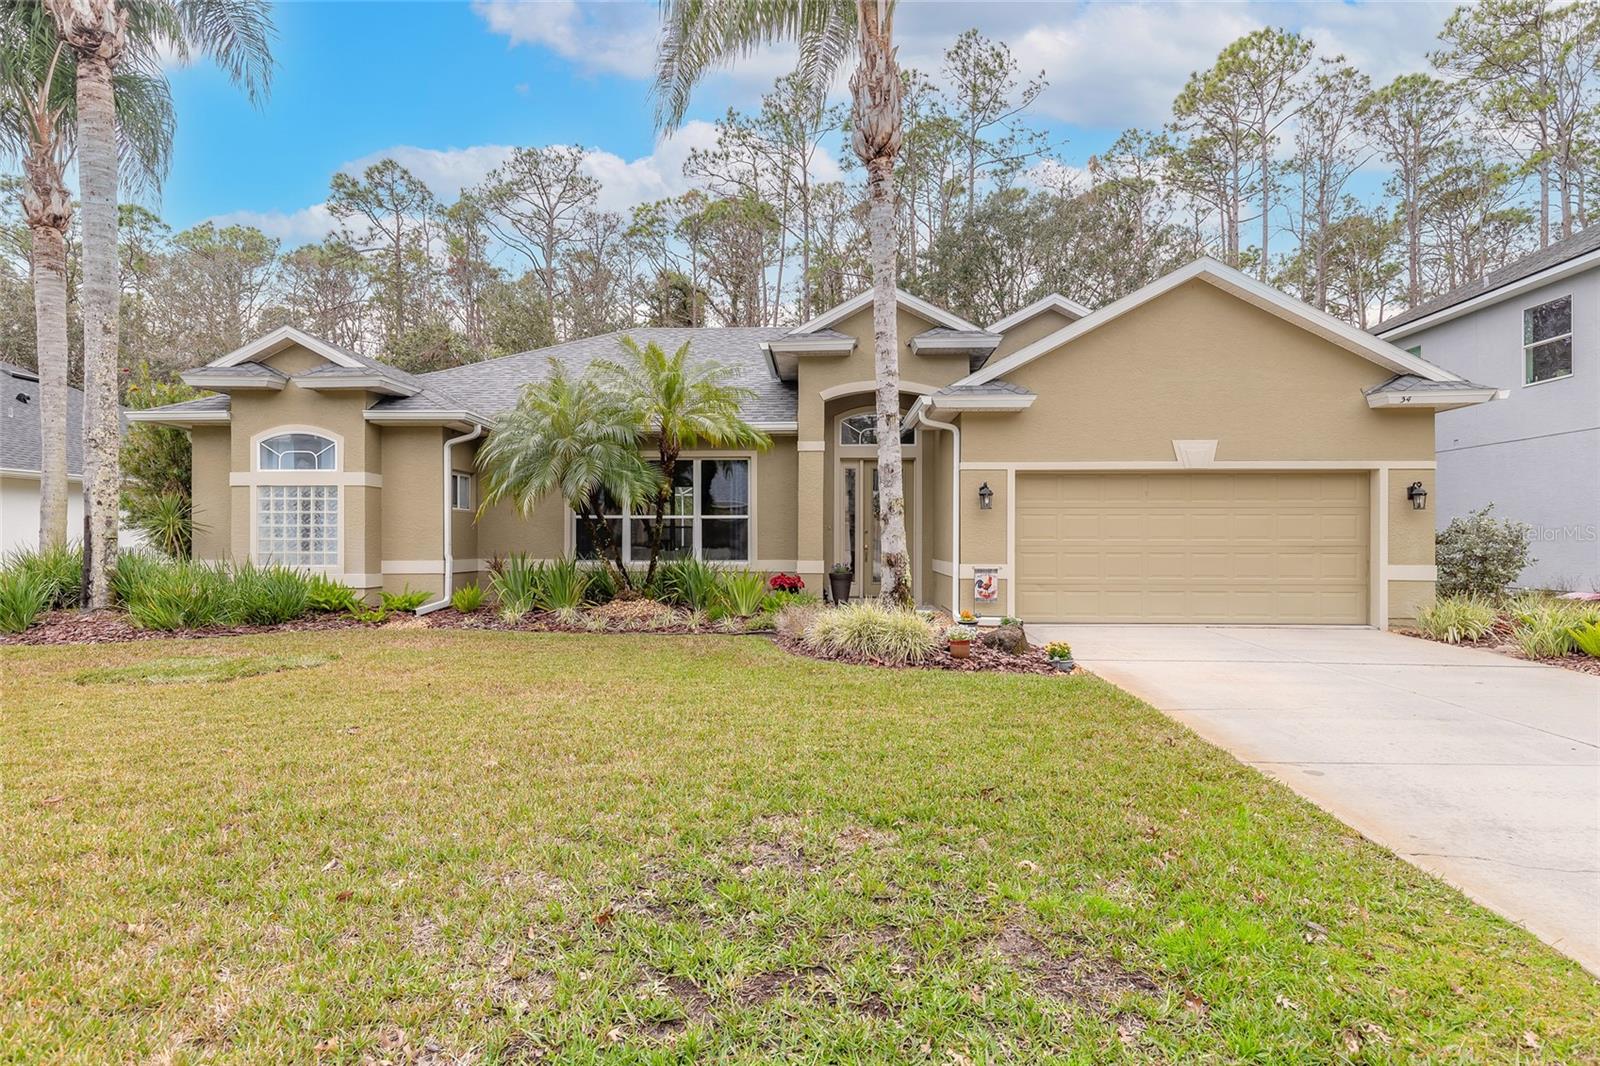
34 Black Creek Way, Ormond Beach, FL 32174
$-754
Cash flow
-8.1%
Cash-on-Cash Return
4.3%
Cap rate
0.6%
Rent to Value Ratio
Active
$140,000
2
bds
|
3
ba
|
1,252
sqft
|
built
1973
5500 Ocean Shore Blvd, Ormond Beach, FL 32176
$160
Cash flow
6.0%
Cash-on-Cash Return
7.5%
Cap rate
1.1%
Rent to Value Ratio