Ormond Beach, FL Investment Properties for Sale
Browse homes for sale and investment properties in Ormond Beach, FL. Refine your search by price, property type, or more.
Best cash flowing properties in Ormond Beach, FL
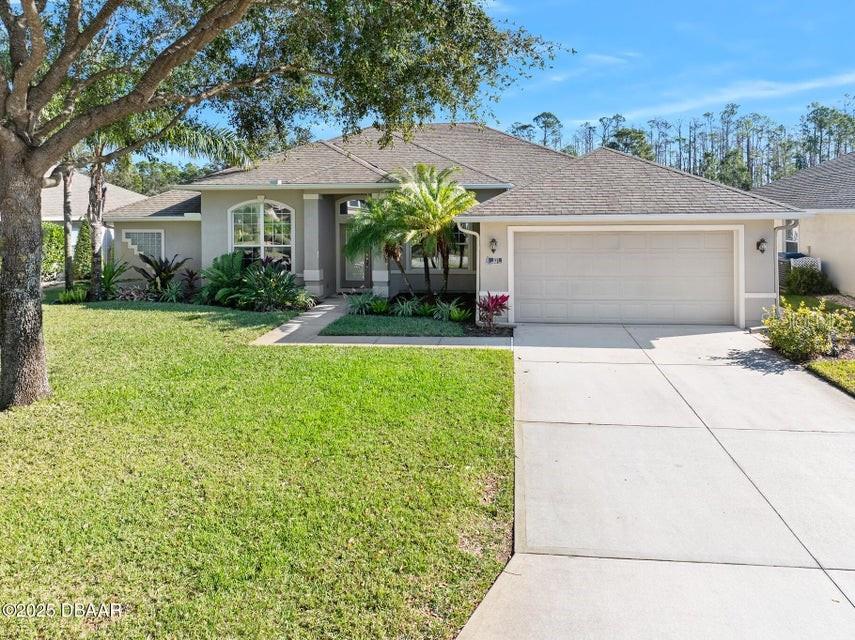
Active
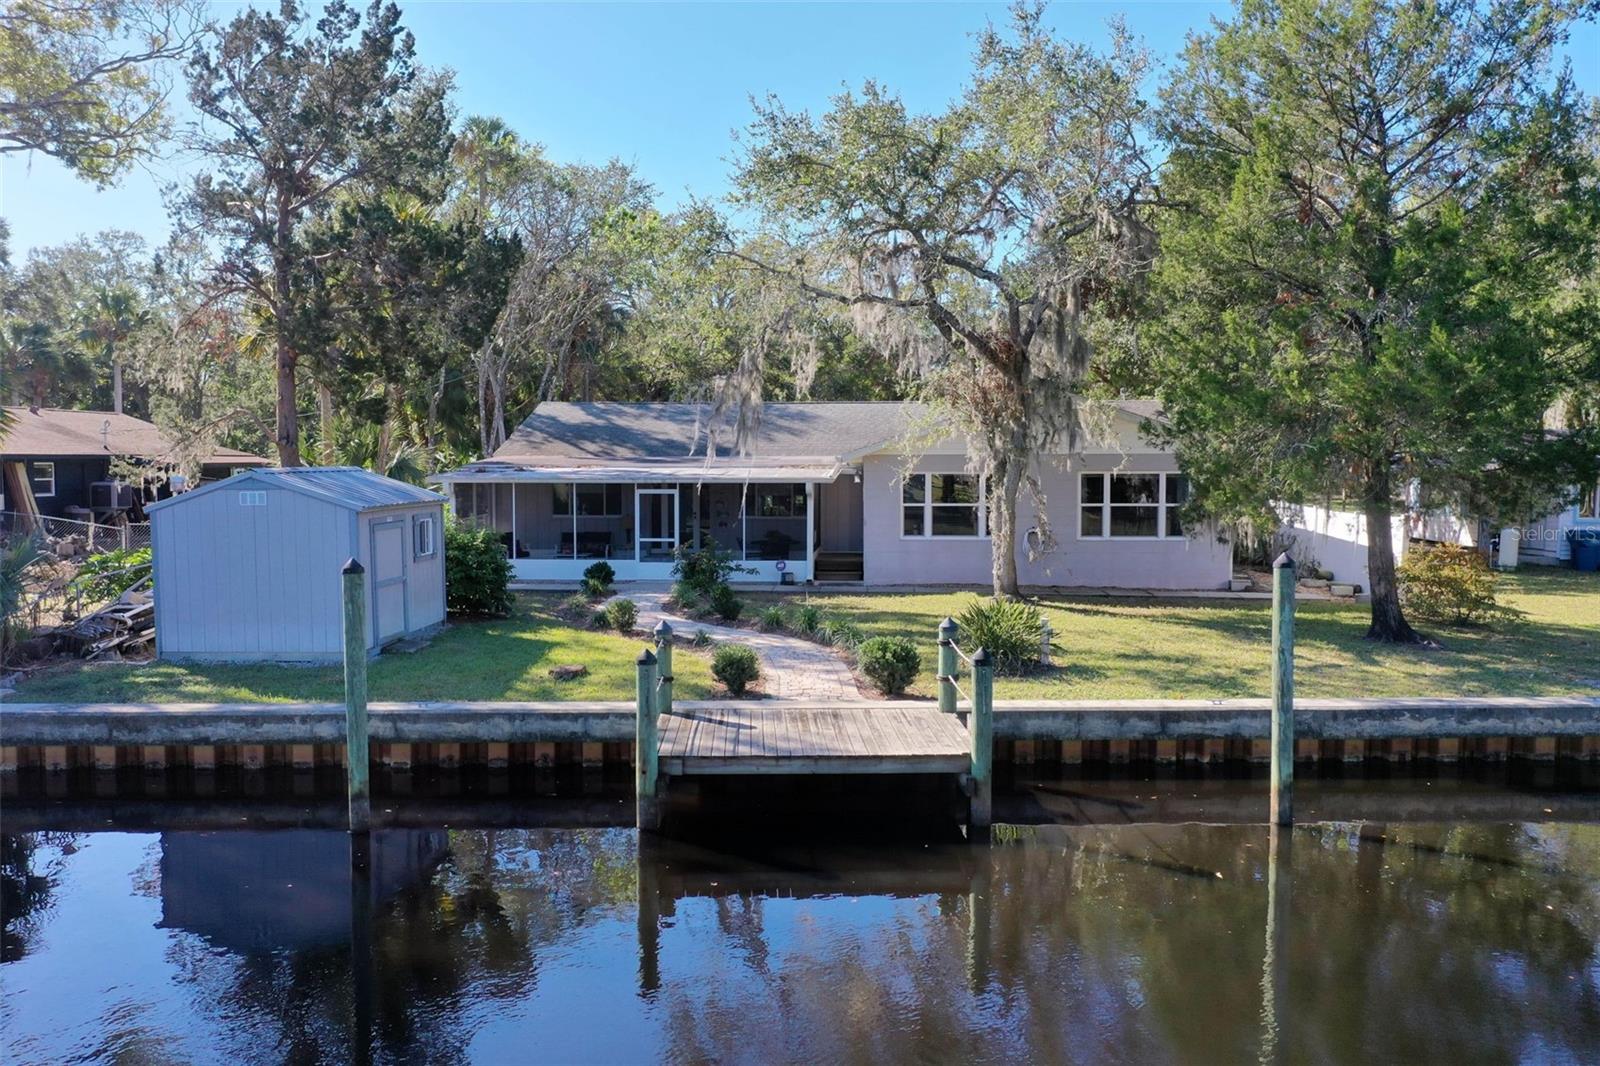
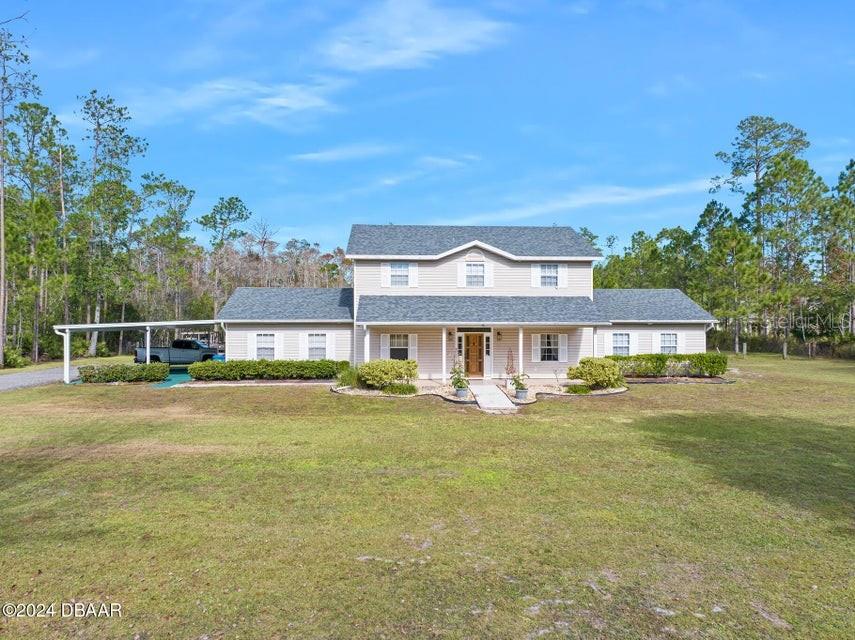
$245,900
4
bds
|
2
ba
|
1,431
sqft
|
built
1947
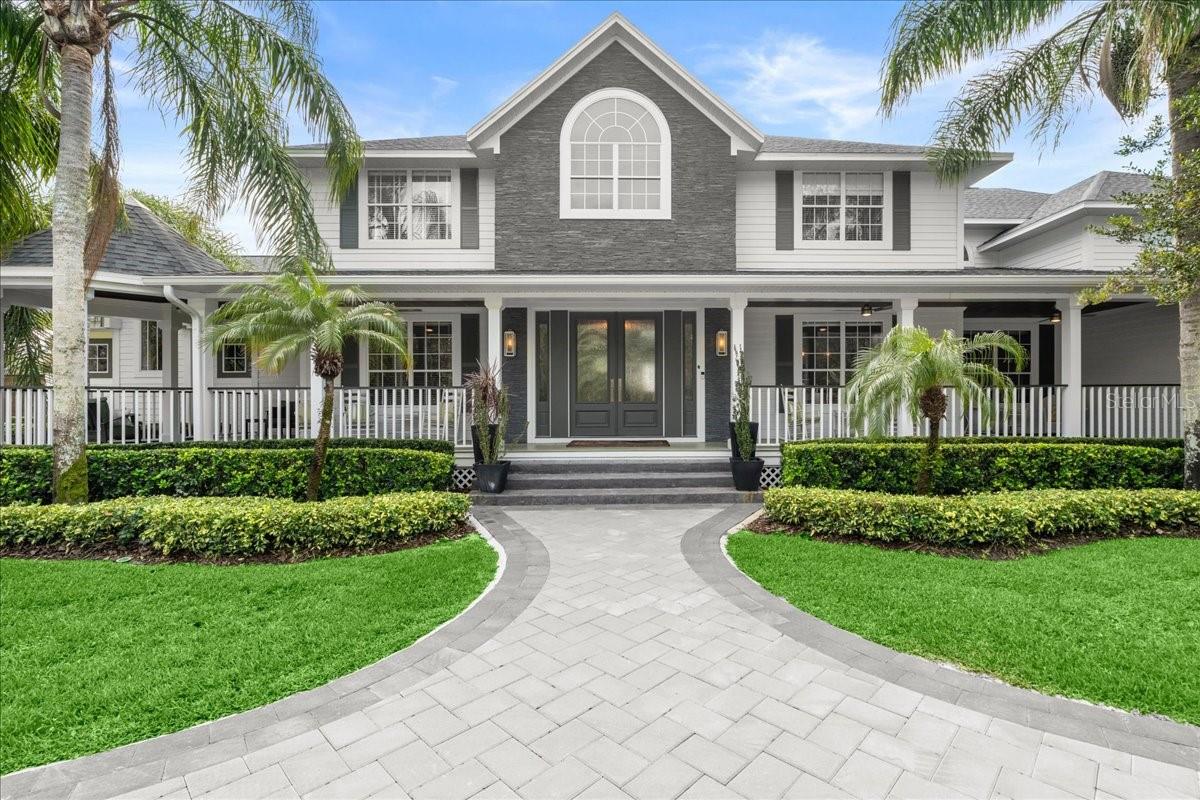
1740 Palm Rd, Ormond Beach, FL 32174
$-51
Cash flow
-1.1%
Cash-on-Cash Return
5.9%
Cap rate
0.9%
Rent to Value Ratio
Active
$229,900
2
bds
|
2
ba
|
952
sqft
|
built
1973
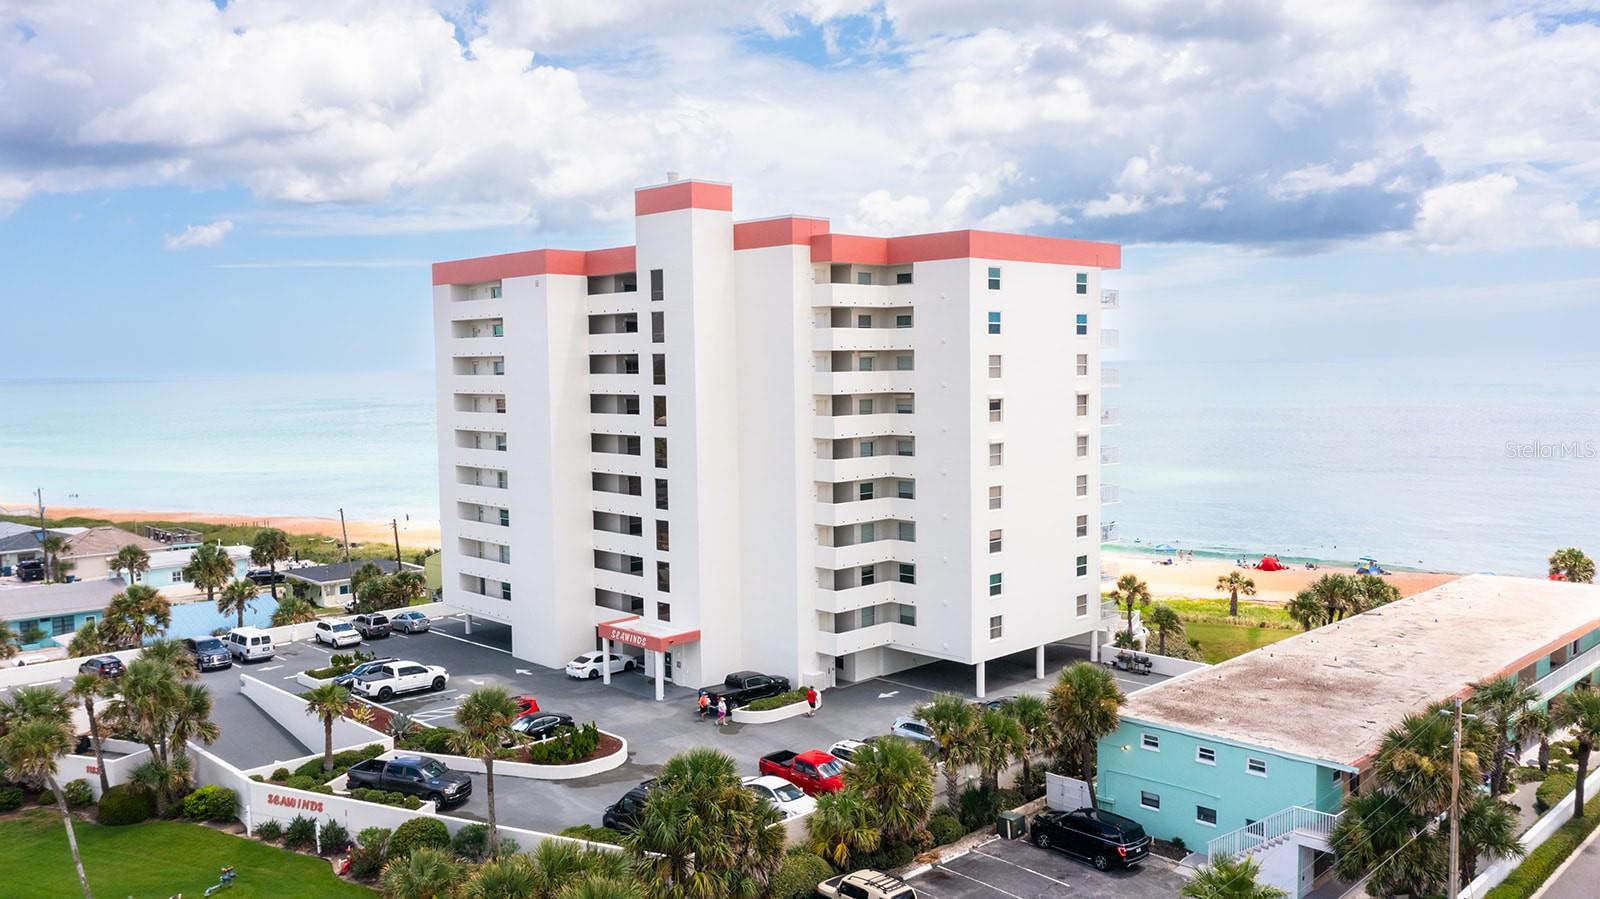
1510 Ocean Shore Blvd, Ormond Beach, FL 32176
$-63
Cash flow
-1.4%
Cash-on-Cash Return
5.8%
Cap rate
0.9%
Rent to Value Ratio
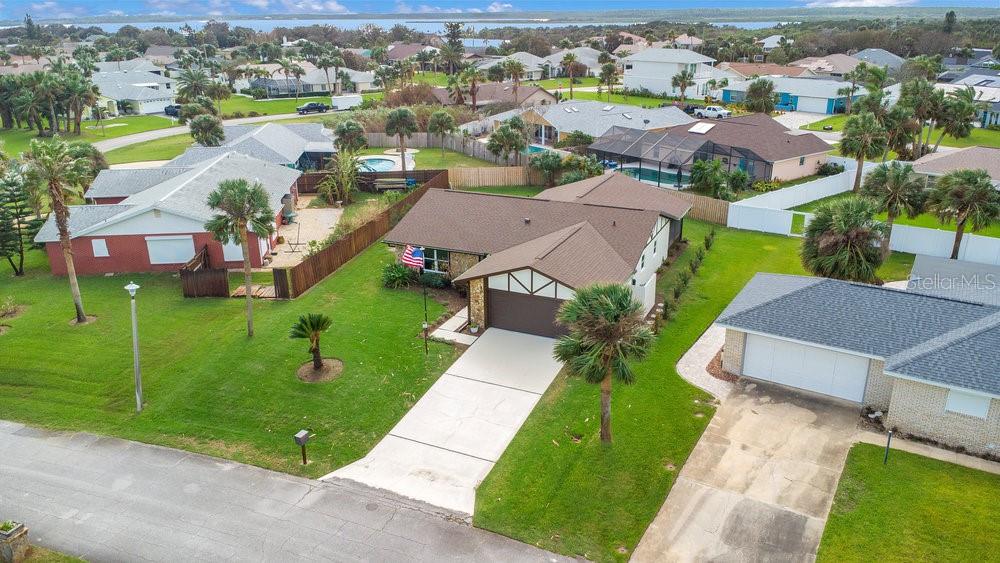
265 out of 305 properties for sale in Ormond Beach, FL
Limited Results Shown
Create a free account, or log in to reveal all property listings and enjoy the complete experience.
Active
$355,000
3
bds
|
2
ba
|
1,695
sqft
|
built
2019
3238 Bailey Ann Dr, Ormond Beach, FL 32174
$-569
Cash flow
-8.4%
Cash-on-Cash Return
4.2%
Cap rate
0.7%
Rent to Value Ratio
Active
$330,000
3
bds
|
3
ba
|
1,696
sqft
|
built
1978
235 Pine Cone Trl, Ormond Beach, FL 32174
$-281
Cash flow
-4.4%
Cash-on-Cash Return
5.1%
Cap rate
0.8%
Rent to Value Ratio

Active
$328,500
3
bds
|
2
ba
|
1,684
sqft
|
built
2005
3019 Glin Cir, Ormond Beach, FL 32174
$-654
Cash flow
-10.4%
Cash-on-Cash Return
3.8%
Cap rate
0.7%
Rent to Value Ratio
Active
$599,900
4
bds
|
3
ba
|
2,852
sqft
|
built
1990
56 Winding Creek Way, Ormond Beach, FL 32174
$-1,056
Cash flow
-9.2%
Cash-on-Cash Return
4.0%
Cap rate
0.6%
Rent to Value Ratio
Active
$325,000
2
bds
|
2
ba
|
1,386
sqft
|
built
1986
5 Jasmine Run, Ormond Beach, FL 32174
$-412
Cash flow
-6.6%
Cash-on-Cash Return
4.6%
Cap rate
0.7%
Rent to Value Ratio
Active
$325,900
2
bds
|
2
ba
|
1,818
sqft
|
built
1954
469 S Halifax Dr, Ormond Beach, FL 32176
$-276
Cash flow
-4.4%
Cash-on-Cash Return
5.1%
Cap rate
0.7%
Rent to Value Ratio
Active
$429,000
3
bds
|
2
ba
|
1,919
sqft
|
built
2016
3189 Connemara Dr, Ormond Beach, FL 32174
$-630
Cash flow
-7.7%
Cash-on-Cash Return
4.4%
Cap rate
0.7%
Rent to Value Ratio
Active
$531,900
3
bds
|
2
ba
|
2,151
sqft
|
built
2010
1221 Harwick Ln, Ormond Beach, FL 32174
$-1,010
Cash flow
-9.9%
Cash-on-Cash Return
3.9%
Cap rate
0.6%
Rent to Value Ratio
Active
$599,000
3
bds
|
2
ba
|
1,827
sqft
|
built
1980
4 Sea Hawk Dr, Ormond Beach, FL 32176
$-685
Cash flow
-6.0%
Cash-on-Cash Return
4.8%
Cap rate
0.6%
Rent to Value Ratio

Active
$5,000,000
6
bds
|
7
ba
|
7,371
sqft
|
built
2020
2627 John Anderson Dr, Ormond Beach, FL 32176
$-22,527
Cash flow
-23.5%
Cash-on-Cash Return
0.7%
Cap rate
0.1%
Rent to Value Ratio
Active
$499,000
4
bds
|
3
ba
|
2,288
sqft
|
built
1992
105 Barrier Isle Dr, Ormond Beach, FL 32176
$-1,041
Cash flow
-10.9%
Cash-on-Cash Return
3.6%
Cap rate
0.6%
Rent to Value Ratio
Active
$495,000
3
bds
|
2
ba
|
1,503
sqft
|
built
1968
15 Longfellow Cir, Ormond Beach, FL 32176
$-499
Cash flow
-5.3%
Cash-on-Cash Return
4.9%
Cap rate
0.6%
Rent to Value Ratio
Active
$550,000
3
bds
|
3
ba
|
1,837
sqft
|
built
1968
1069 Indigo Rd, Ormond Beach, FL 32174
$-1,234
Cash flow
-11.7%
Cash-on-Cash Return
3.5%
Cap rate
0.6%
Rent to Value Ratio
Active
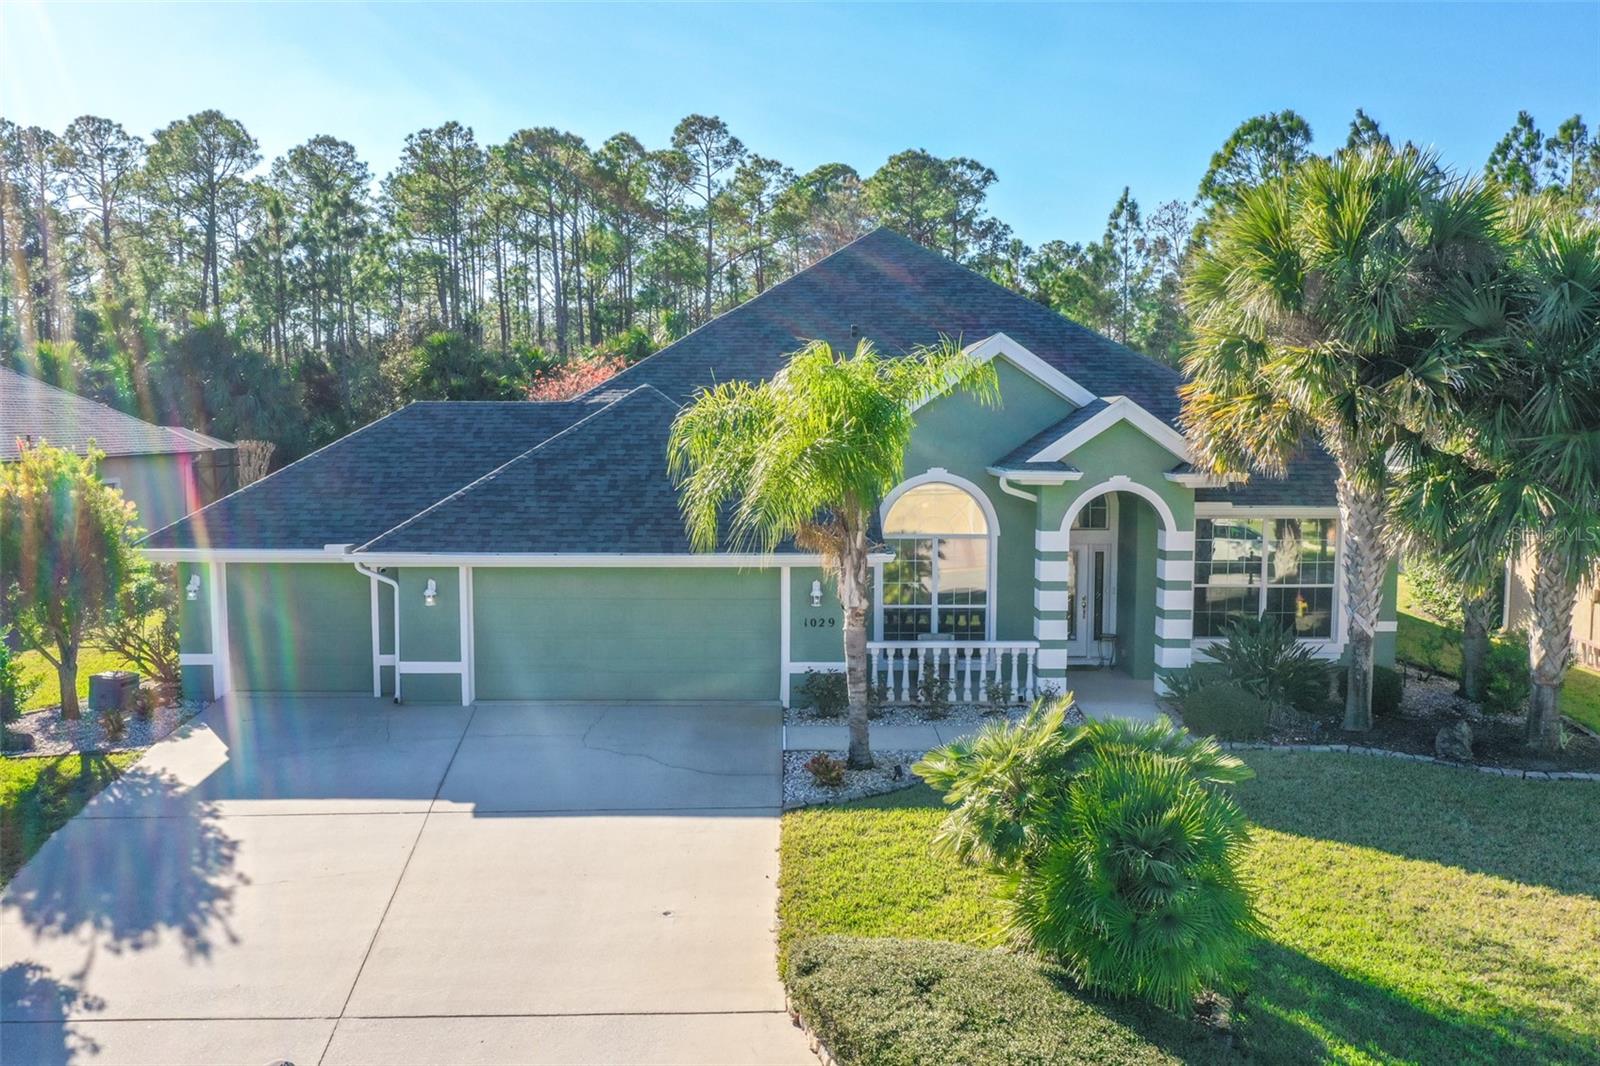
$575,000
4
bds
|
2
ba
|
2,575
sqft
|
built
2004
1029 Stone Lake Dr, Ormond Beach, FL 32174
$-899
Cash flow
-8.2%
Cash-on-Cash Return
4.3%
Cap rate
0.7%
Rent to Value Ratio
Active
$339,900
2
bds
|
1
ba
|
972
sqft
|
built
1951
71 Brooks Dr, Ormond Beach, FL 32176
$-337
Cash flow
-5.2%
Cash-on-Cash Return
5.0%
Cap rate
0.7%
Rent to Value Ratio
Active
$592,400
5
bds
|
4
ba
|
3,018
sqft
|
built
1985
417 Main Trl, Ormond Beach, FL 32174
$-424
Cash flow
-3.7%
Cash-on-Cash Return
5.3%
Cap rate
0.7%
Rent to Value Ratio
Active
$439,000
2
bds
|
2
ba
|
1,150
sqft
|
built
1981
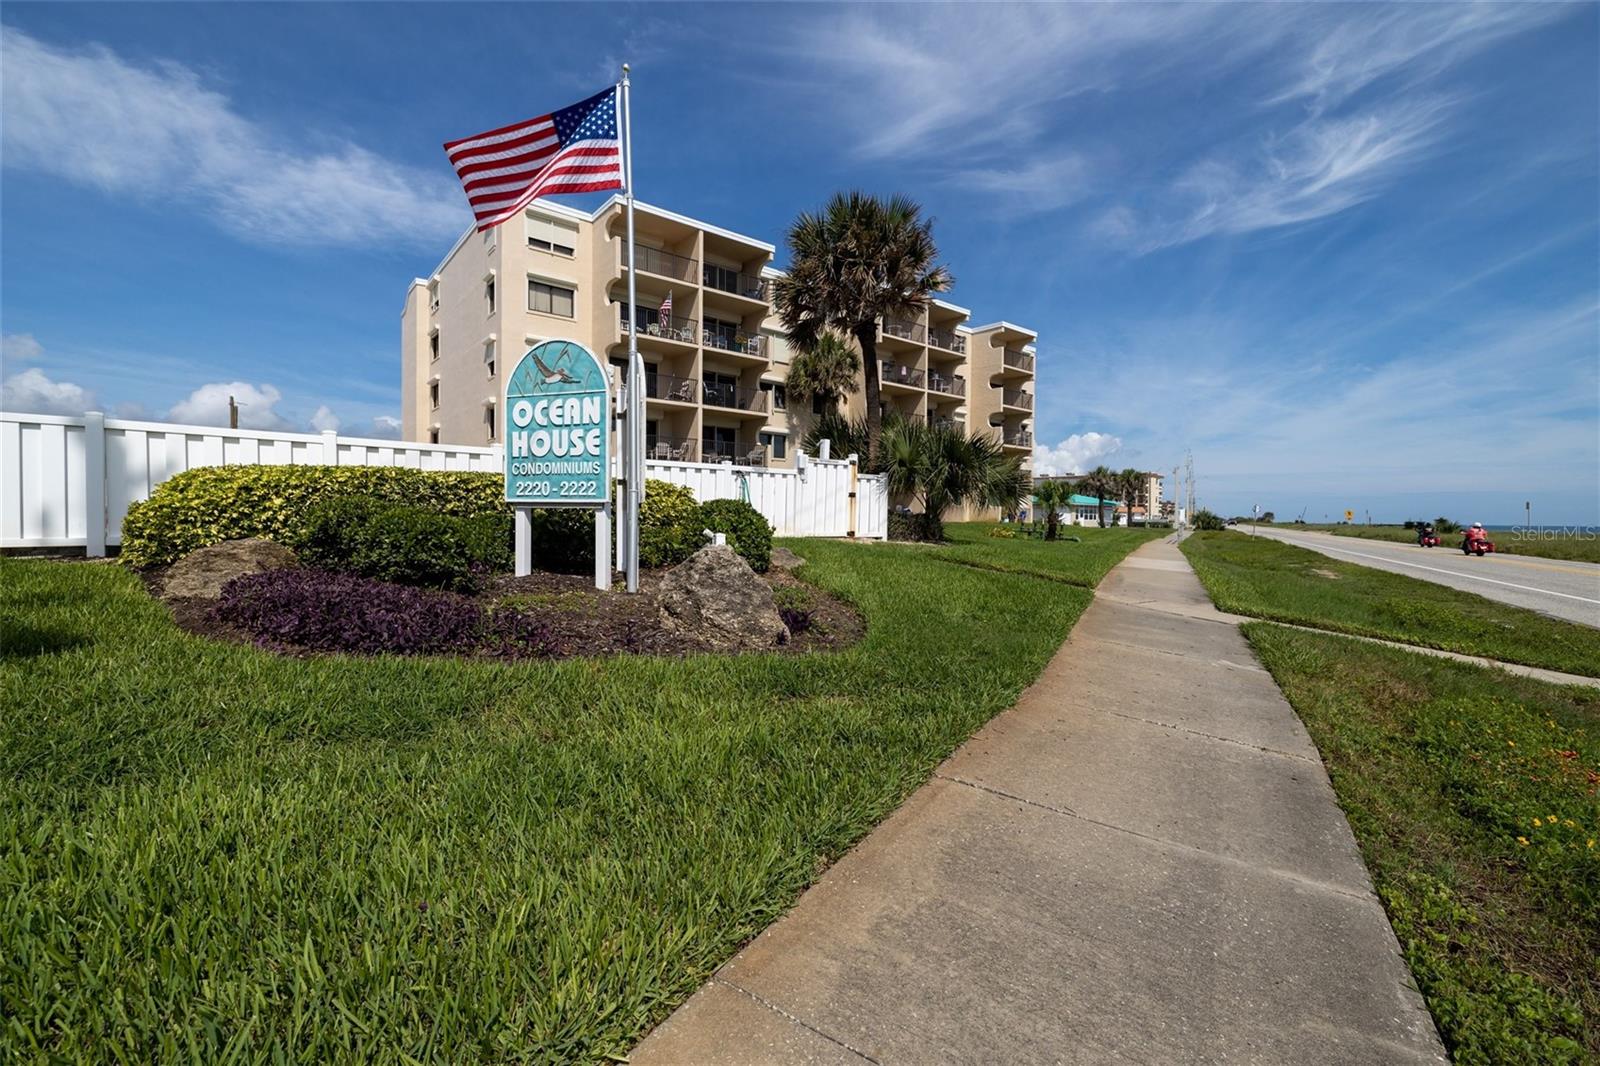
2222 Ocean Shore Blvd, Ormond Beach, FL 32176
$-1,296
Cash flow
-15.4%
Cash-on-Cash Return
2.6%
Cap rate
0.7%
Rent to Value Ratio
Active
$717,000
4
bds
|
3
ba
|
2,861
sqft
|
built
1994
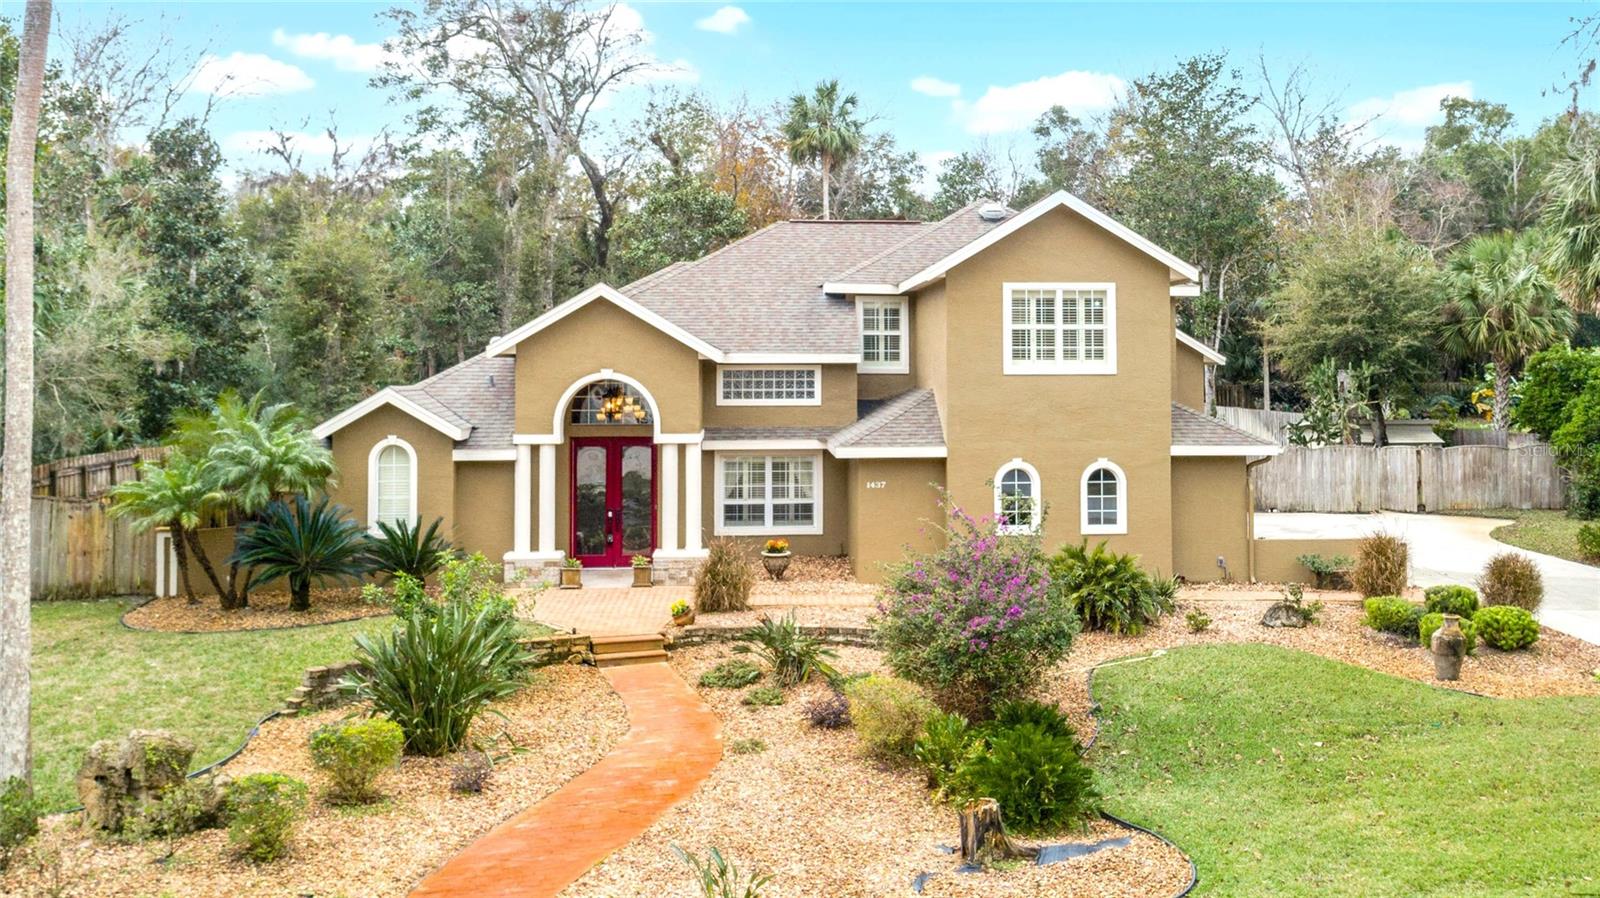
1437 Pecos Dr, Ormond Beach, FL 32174
$-1,422
Cash flow
-10.3%
Cash-on-Cash Return
3.8%
Cap rate
0.5%
Rent to Value Ratio
Active
$345,000
2
bds
|
3
ba
|
2,312
sqft
|
built
1987
5 Treetop Trl, Ormond Beach, FL 32174
$-175
Cash flow
-2.6%
Cash-on-Cash Return
5.5%
Cap rate
0.8%
Rent to Value Ratio
Active
$399,000
3
bds
|
2
ba
|
1,695
sqft
|
built
2020
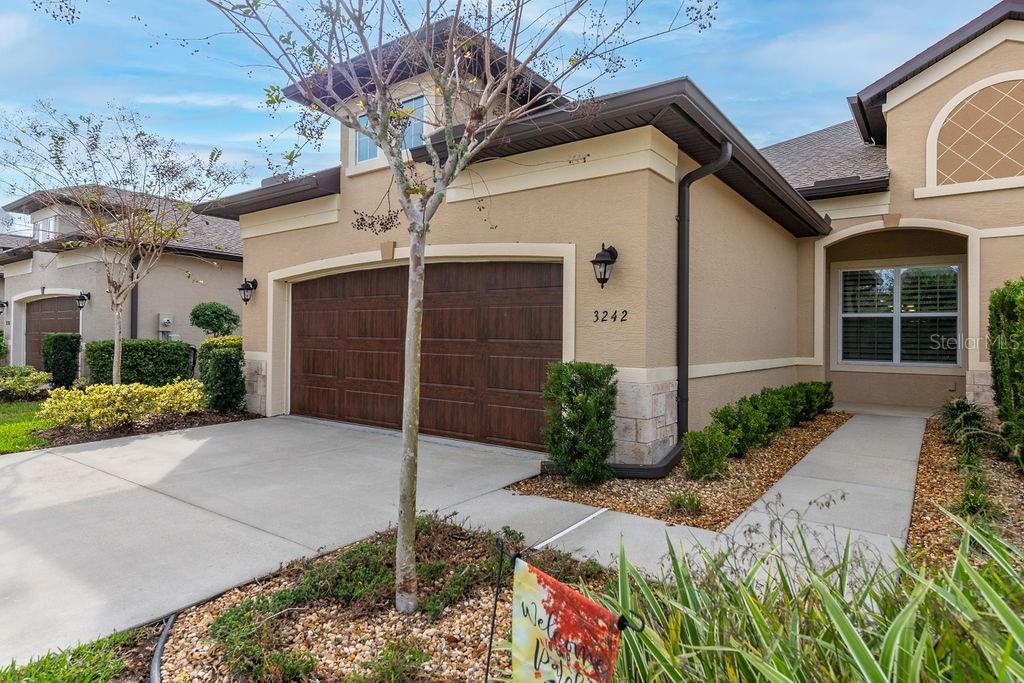
3242 Bailey Ann Dr, Ormond Beach, FL 32174
$-801
Cash flow
-10.5%
Cash-on-Cash Return
3.7%
Cap rate
0.6%
Rent to Value Ratio
Active
$448,000
2
bds
|
2
ba
|
1,020
sqft
|
built
1970
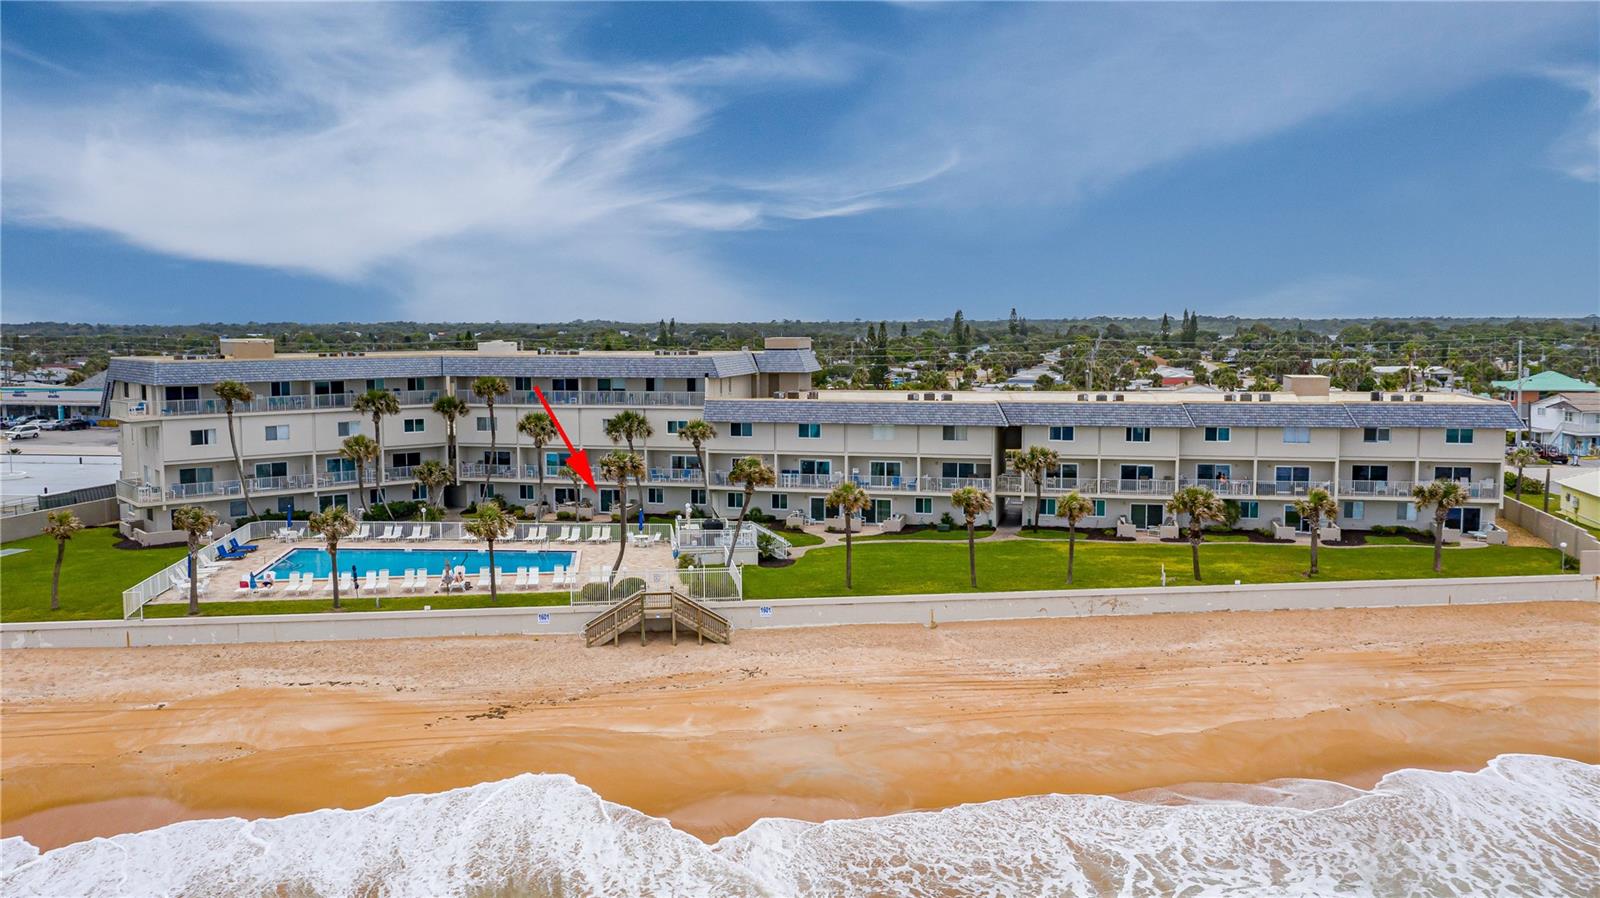
1601 Ocean Shore Blvd, Ormond Beach, FL 32176
$-1,853
Cash flow
-21.6%
Cash-on-Cash Return
1.2%
Cap rate
0.6%
Rent to Value Ratio
Active
$315,000
3
bds
|
2
ba
|
1,260
sqft
|
built
1957
164 Laurie Dr, Ormond Beach, FL 32176
$-615
Cash flow
-10.2%
Cash-on-Cash Return
3.8%
Cap rate
0.6%
Rent to Value Ratio
Active
$464,900
2
bds
|
2
ba
|
1,198
sqft
|
built
1995
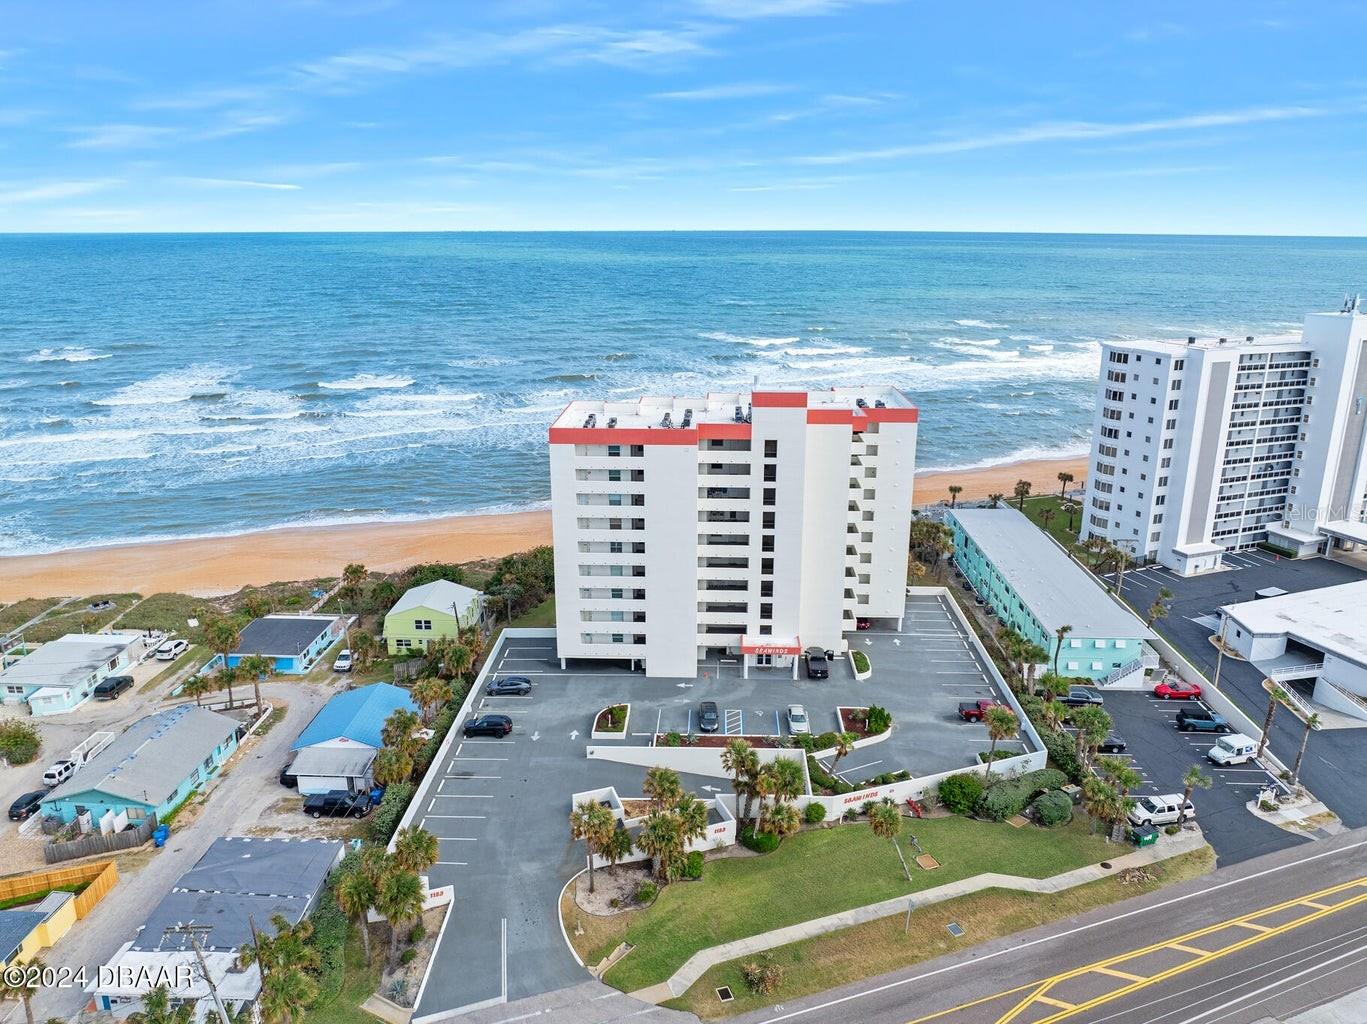
1183 Ocean Shore Blvd, Ormond Beach, FL 32176
$-890
Cash flow
-10.0%
Cash-on-Cash Return
3.8%
Cap rate
0.6%
Rent to Value Ratio
Active
$325,000
3
bds
|
2
ba
|
1,420
sqft
|
built
1985
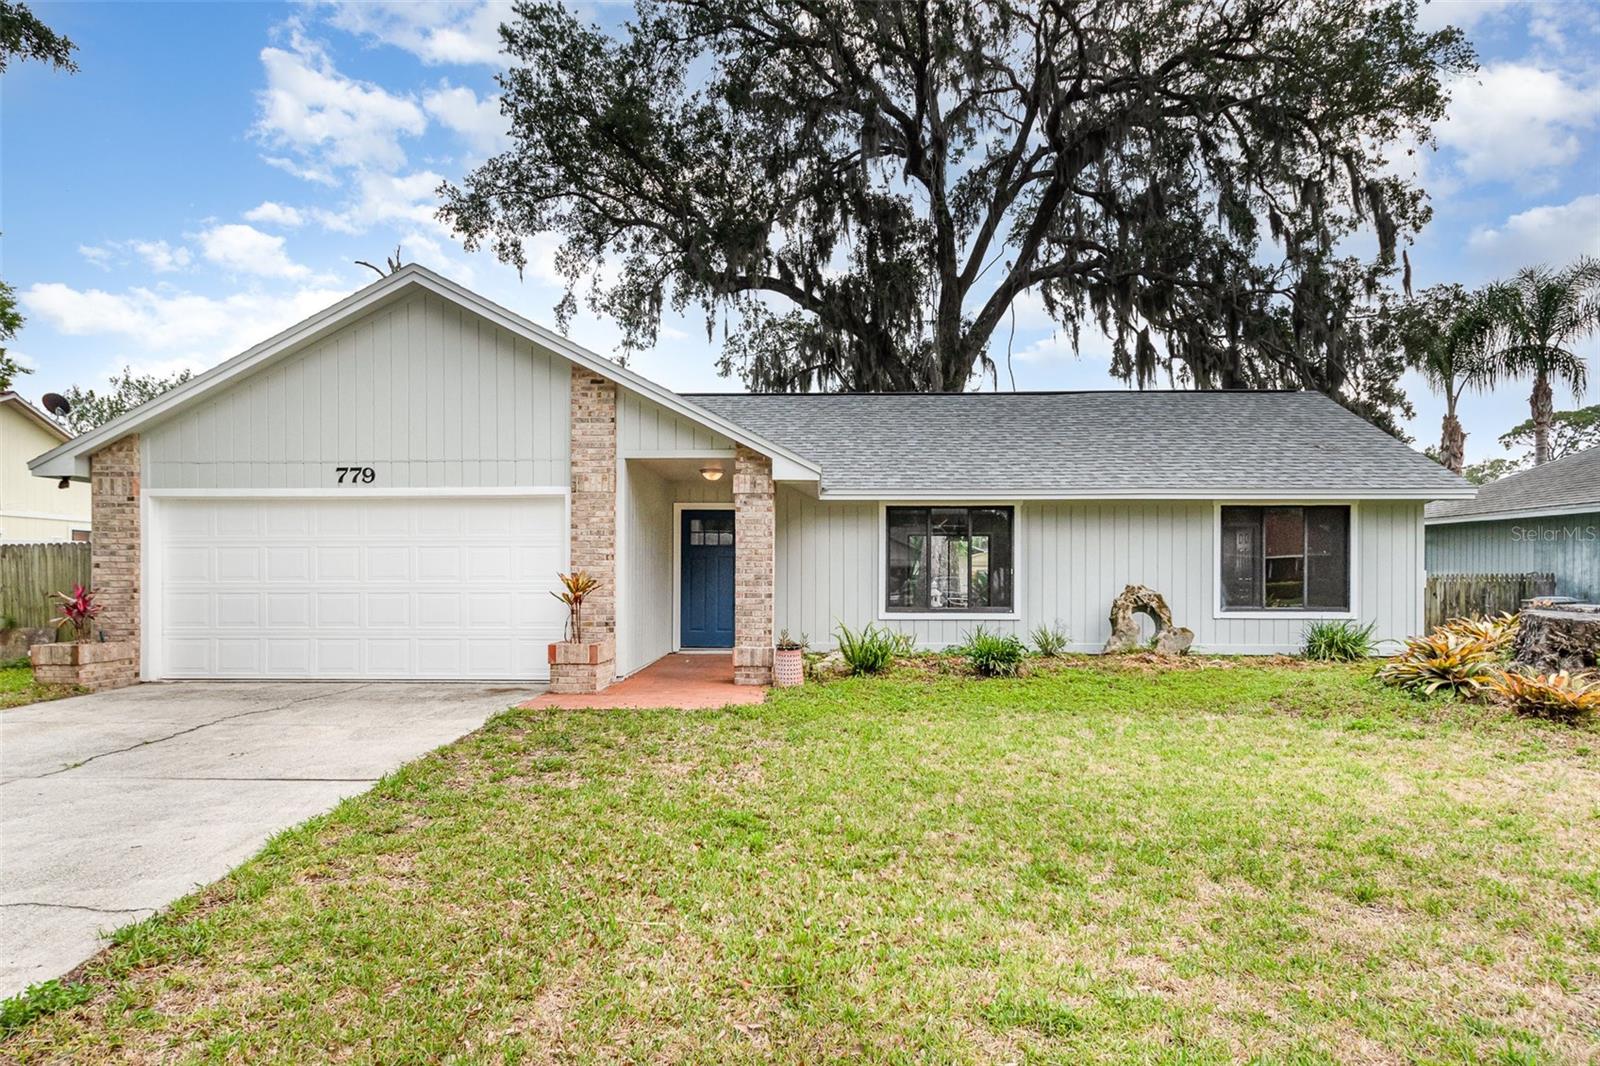
779 Victoria Cir E, Ormond Beach, FL 32174
$-240
Cash flow
-3.9%
Cash-on-Cash Return
5.3%
Cap rate
0.8%
Rent to Value Ratio
Active
$699,000
5
bds
|
4
ba
|
3,264
sqft
|
built
2001
3782 Pine Cone Ln, Ormond Beach, FL 32174
$-1,541
Cash flow
-11.5%
Cash-on-Cash Return
3.5%
Cap rate
0.5%
Rent to Value Ratio
Active
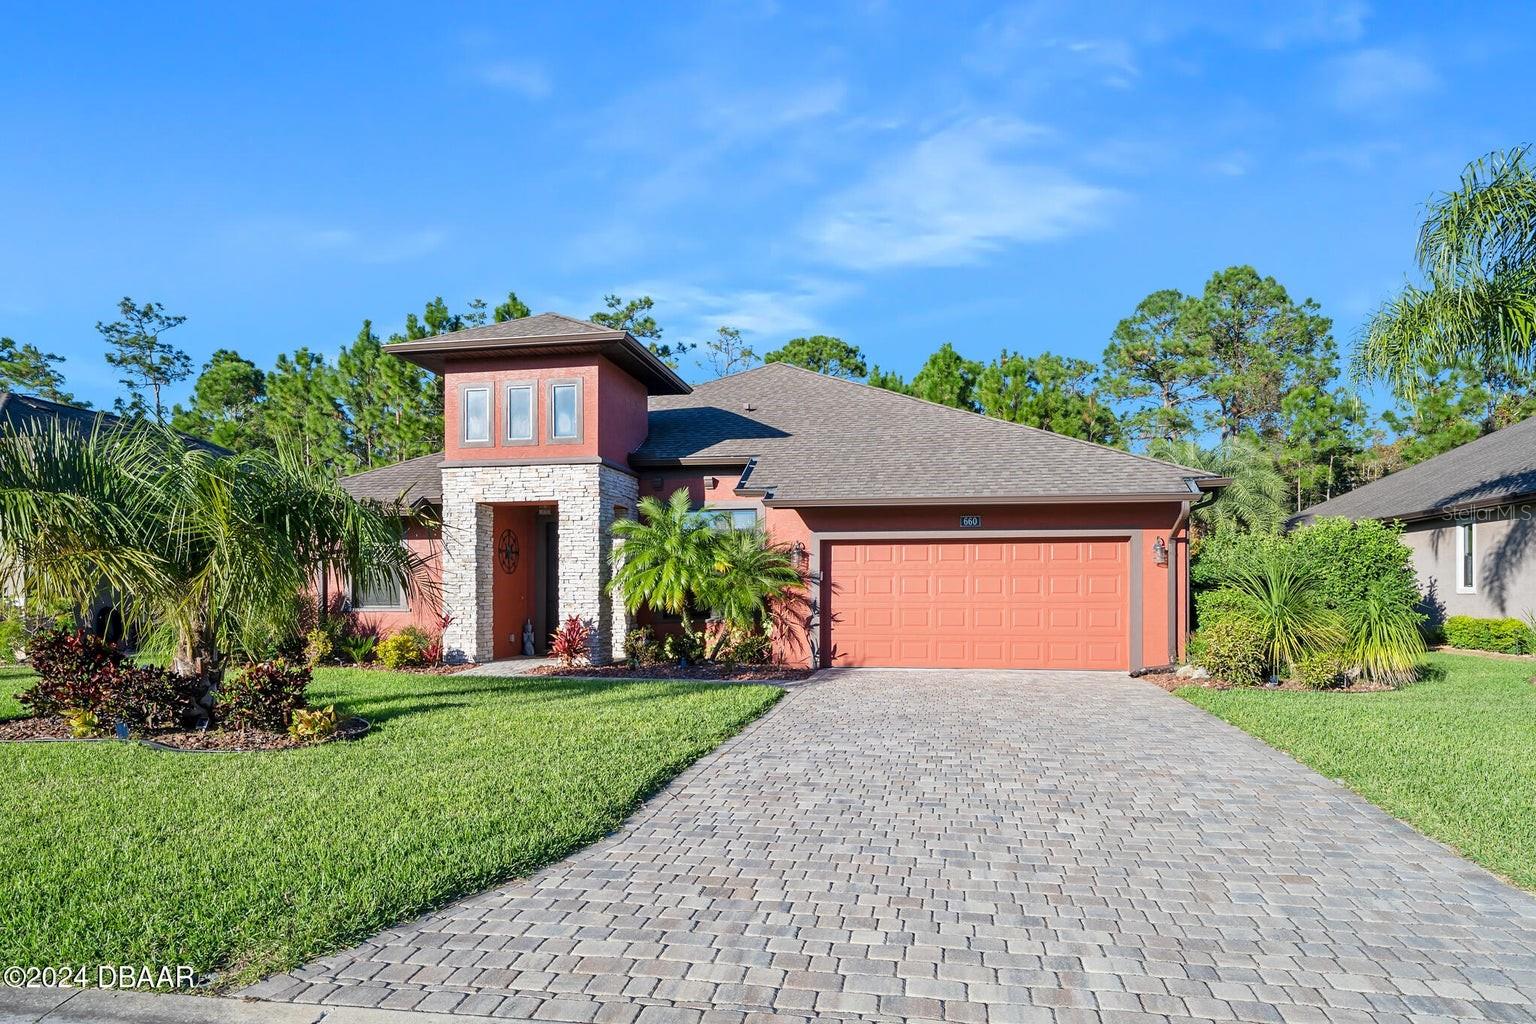
$674,975
3
bds
|
3
ba
|
2,668
sqft
|
built
2018
660 Aldenham Ln, Ormond Beach, FL 32174
$-1,315
Cash flow
-10.2%
Cash-on-Cash Return
3.8%
Cap rate
0.6%
Rent to Value Ratio
Active
$474,900
3
bds
|
3
ba
|
2,137
sqft
|
built
2022
76 Longridge Ln, Ormond Beach, FL 32174
$-1,001
Cash flow
-11.0%
Cash-on-Cash Return
3.6%
Cap rate
0.7%
Rent to Value Ratio
Active
$369,000
2
bds
|
3
ba
|
2,619
sqft
|
built
1986
7 Jasmine Run, Ormond Beach, FL 32174
$-186
Cash flow
-2.6%
Cash-on-Cash Return
5.5%
Cap rate
0.8%
Rent to Value Ratio
Active
$348,000
2
bds
|
2
ba
|
1,225
sqft
|
built
1974
1415 Ocean Shore Blvd, Ormond Beach, FL 32176
$-345
Cash flow
-5.2%
Cash-on-Cash Return
5.0%
Cap rate
0.7%
Rent to Value Ratio
Active
$760,000
3
bds
|
3
ba
|
2,586
sqft
|
built
2005
3404 Rexford Cir, Ormond Beach, FL 32174
$-1,155
Cash flow
-7.9%
Cash-on-Cash Return
4.3%
Cap rate
0.5%
Rent to Value Ratio
Active
$339,900
2
bds
|
2
ba
|
1,825
sqft
|
built
2007
1653 N US Highway 1, Ormond Beach, FL 32174
$-66
Cash flow
-1.0%
Cash-on-Cash Return
5.9%
Cap rate
0.8%
Rent to Value Ratio
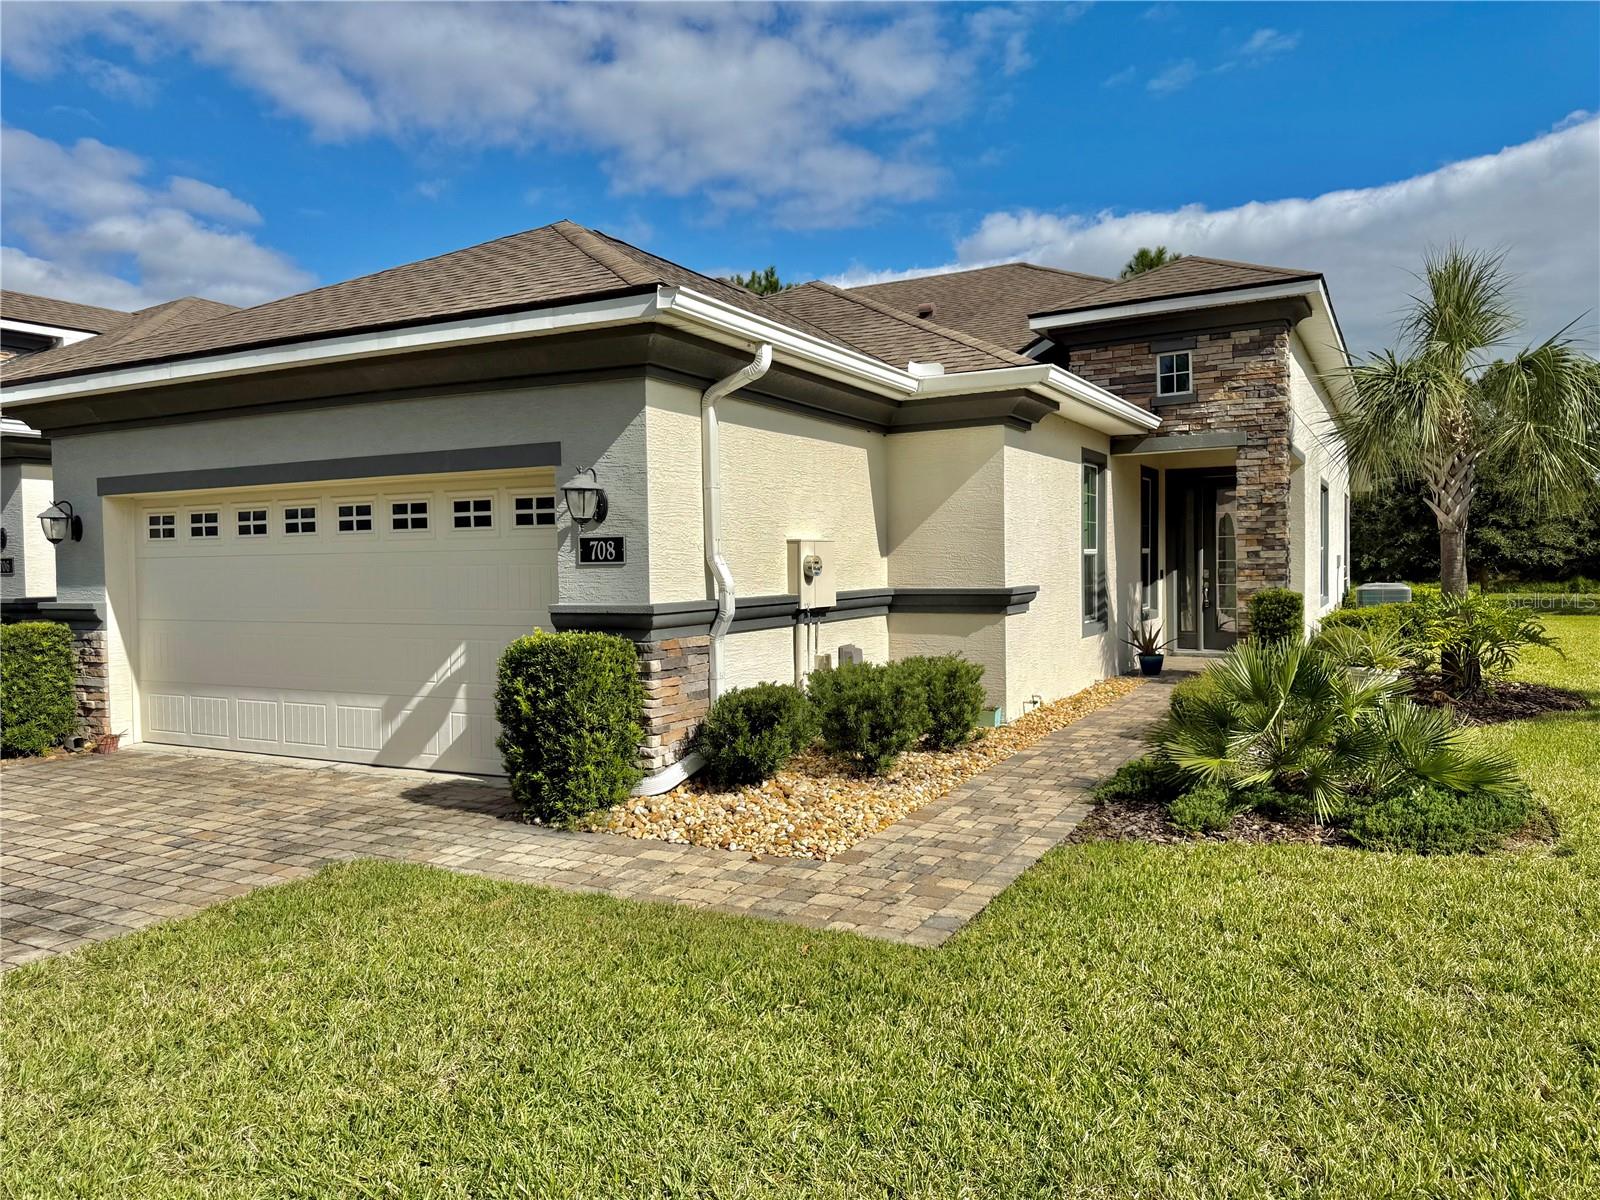
Active
$330,000
2
bds
|
2
ba
|
1,510
sqft
|
built
2017
708 Aldenham Ln, Ormond Beach, FL 32174
$-652
Cash flow
-10.3%
Cash-on-Cash Return
3.8%
Cap rate
0.7%
Rent to Value Ratio
Active
$245,900
4
bds
|
2
ba
|
1,431
sqft
|
built
1947
1740 Palm Rd, Ormond Beach, FL 32174
$-51
Cash flow
-1.1%
Cash-on-Cash Return
5.9%
Cap rate
0.9%
Rent to Value Ratio
Active
$479,900
2
bds
|
2
ba
|
1,200
sqft
|
built
1995
1183 Ocean Shore Blvd, Ormond Beach, FL 32176
$-844
Cash flow
-9.2%
Cash-on-Cash Return
4.0%
Cap rate
0.6%
Rent to Value Ratio
Active
$1,049,999
5
bds
|
5
ba
|
4,390
sqft
|
built
2002
36 Allenwood Look, Ormond Beach, FL 32174
$-2,189
Cash flow
-10.9%
Cash-on-Cash Return
3.6%
Cap rate
0.5%
Rent to Value Ratio
Active
$229,900
2
bds
|
2
ba
|
952
sqft
|
built
1973
1510 Ocean Shore Blvd, Ormond Beach, FL 32176
$-63
Cash flow
-1.4%
Cash-on-Cash Return
5.8%
Cap rate
0.9%
Rent to Value Ratio
Active
$925,000
3
bds
|
3
ba
|
2,778
sqft
|
built
2022
53 Marden Dr, Ormond Beach, FL 32176
$-2,303
Cash flow
-13.0%
Cash-on-Cash Return
3.2%
Cap rate
0.5%
Rent to Value Ratio
Active
$404,900
3
bds
|
2
ba
|
2,050
sqft
|
built
2000
29 Gale Ln, Ormond Beach, FL 32174
$-470
Cash flow
-6.1%
Cash-on-Cash Return
4.8%
Cap rate
0.7%
Rent to Value Ratio
Active
$3,595,000
8
bds
|
7
ba
|
12,632
sqft
|
built
1996
4 Broadcreek Cir, Ormond Beach, FL 32174
$-14,588
Cash flow
-21.2%
Cash-on-Cash Return
1.3%
Cap rate
0.2%
Rent to Value Ratio
Active
$459,900
2
bds
|
2
ba
|
1,200
sqft
|
built
1979
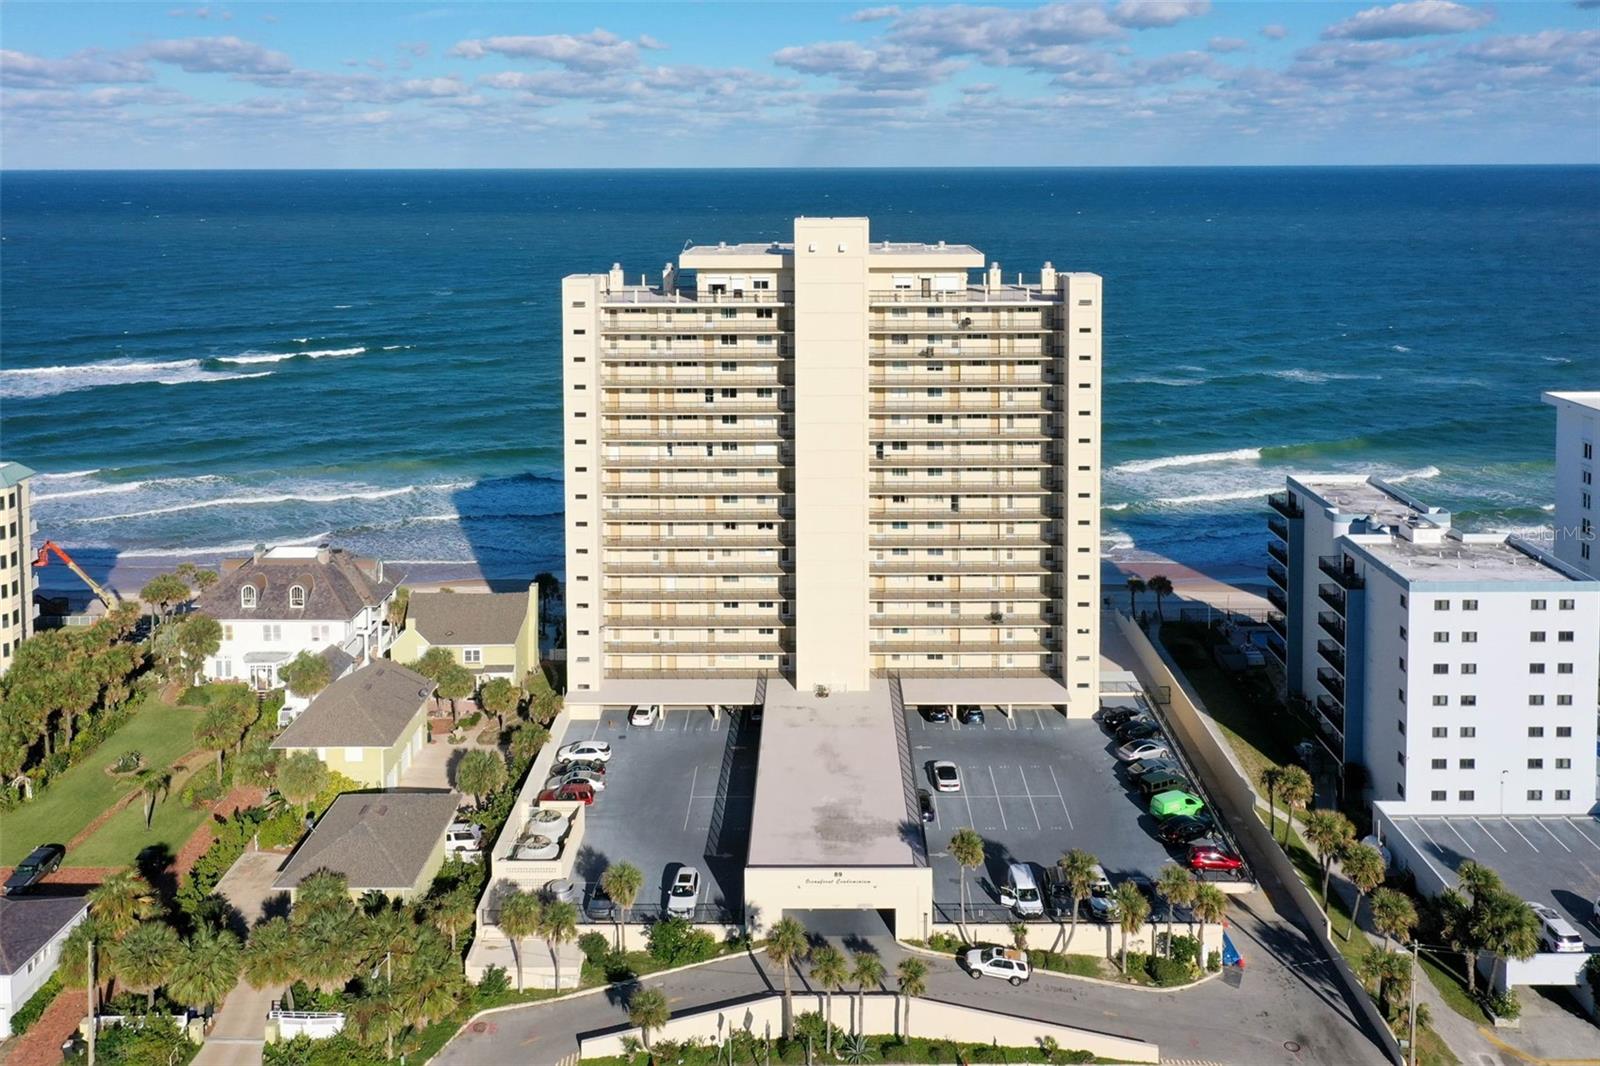
89 S Atlantic Ave, Ormond Beach, FL 32176
$-602
Cash flow
-6.8%
Cash-on-Cash Return
4.6%
Cap rate
0.6%
Rent to Value Ratio