Ormond Beach, FL Investment Properties for Sale
Browse homes for sale and investment properties in Ormond Beach, FL. Refine your search by price, property type, or more.
Best cash flowing properties in Ormond Beach, FL

Active
$449,000
4
bds
|
2
ba
|
2,468
sqft
|
built
1978
121 Willow Bend Ln, Ormond Beach, FL 32174
$-159
Cash flow
-1.8%
Cash-on-Cash Return
5.9%
Cap rate
0.8%
Rent to Value Ratio

Active
$399,999
3
bds
|
2
ba
|
2,078
sqft
|
built
1991
74 Kingsley Ln, Ormond Beach, FL 32174
$-175
Cash flow
-2.3%
Cash-on-Cash Return
5.8%
Cap rate
0.8%
Rent to Value Ratio
265 out of 305 properties for sale in Ormond Beach, FL
Limited Results Shown
Create a free account, or log in to reveal all property listings and enjoy the complete experience.
Active
$399,999
3
bds
|
2
ba
|
2,078
sqft
|
built
1991
74 Kingsley Ln, Ormond Beach, FL 32174
$-175
Cash flow
-2.3%
Cash-on-Cash Return
5.8%
Cap rate
0.8%
Rent to Value Ratio

Active
$449,900
3
bds
|
2
ba
|
1,762
sqft
|
built
2014
645 Elk River Dr, Ormond Beach, FL 32174
$-1,060
Cash flow
-12.3%
Cash-on-Cash Return
3.5%
Cap rate
0.6%
Rent to Value Ratio

Active
$525,000
3
bds
|
2
ba
|
2,186
sqft
|
built
2001
3709 Donegal Cir, Ormond Beach, FL 32174
$-1,144
Cash flow
-11.4%
Cash-on-Cash Return
3.7%
Cap rate
0.6%
Rent to Value Ratio
Active
$4,000,000
5
bds
|
5
ba
|
5,001
sqft
|
built
2000
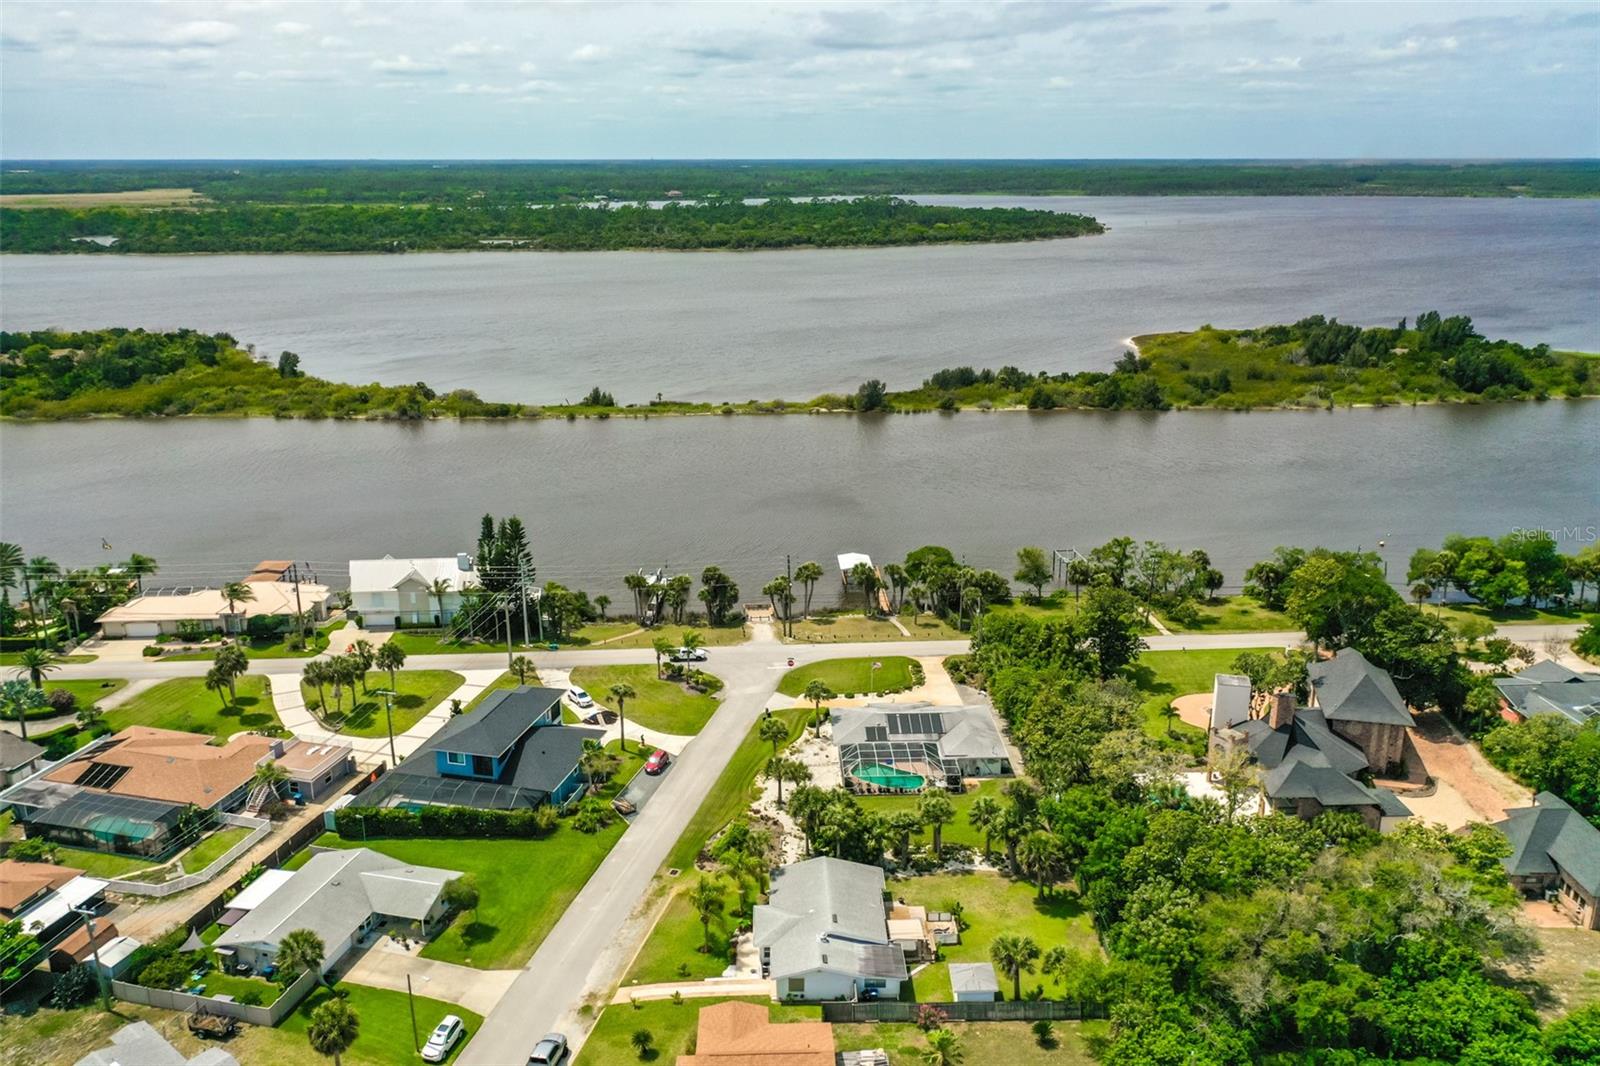
70 Riverside Dr, Ormond Beach, FL 32176
$-17,125
Cash flow
-22.3%
Cash-on-Cash Return
1.1%
Cap rate
0.2%
Rent to Value Ratio

Active
$349,000
2
bds
|
2
ba
|
1,344
sqft
|
built
1982
2600 Ocean Shore Blvd, Ormond Beach, FL 32176
$-491
Cash flow
-7.3%
Cash-on-Cash Return
4.6%
Cap rate
0.7%
Rent to Value Ratio
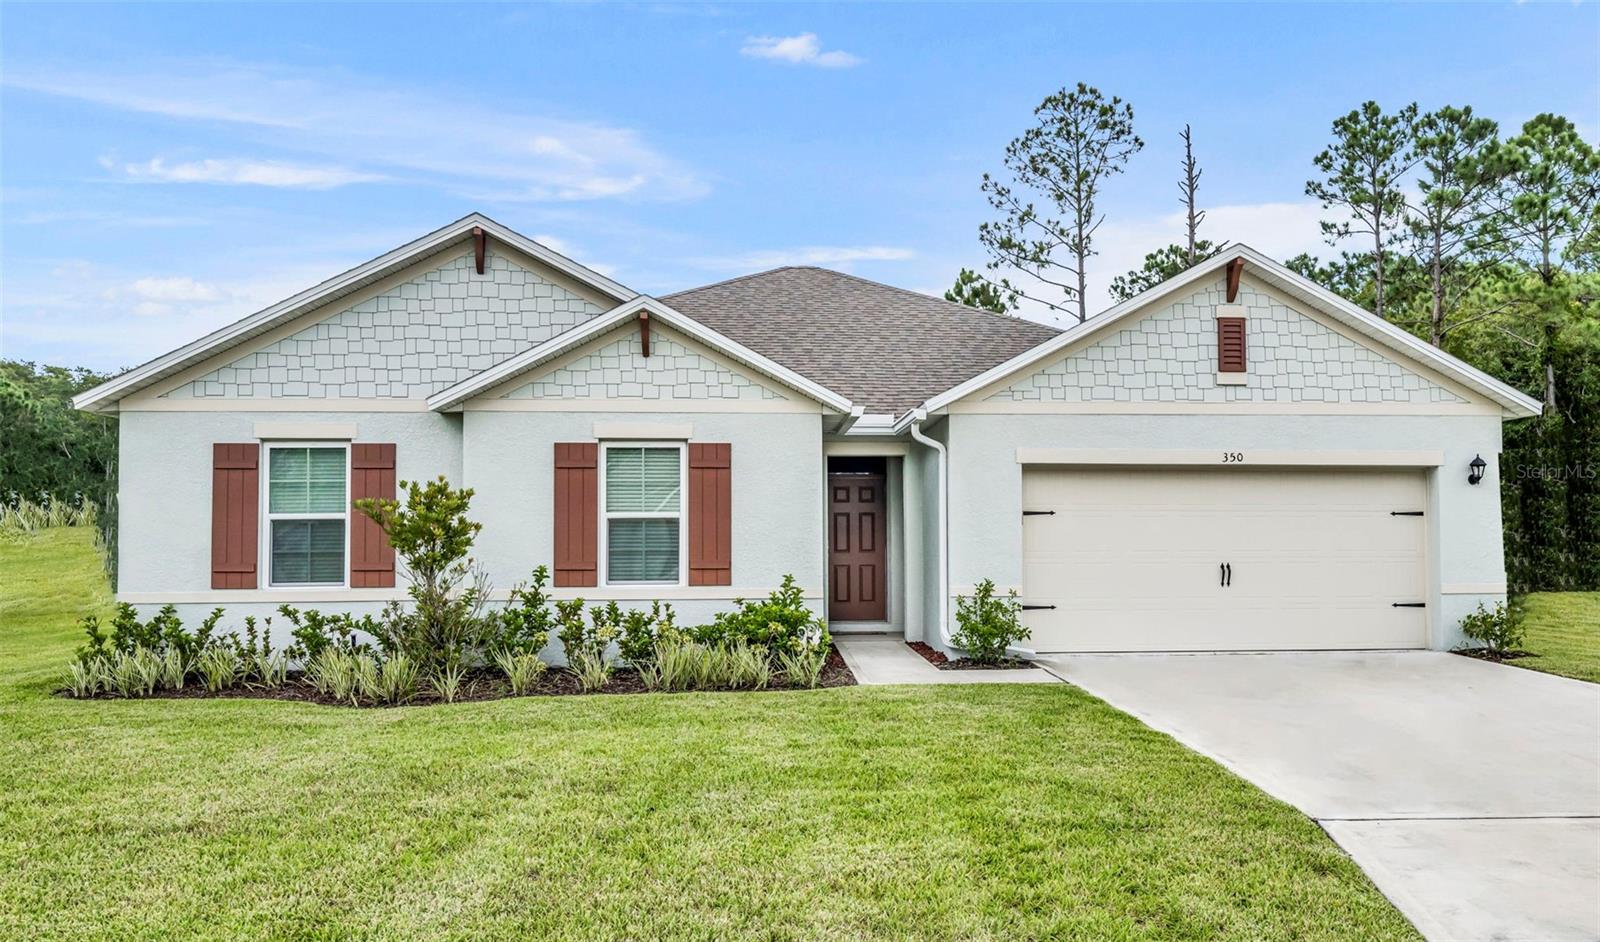
Active
$420,000
4
bds
|
2
ba
|
2,101
sqft
|
built
2022
350 Sunset Point Dr, Ormond Beach, FL 32174
$-734
Cash flow
-9.1%
Cash-on-Cash Return
4.2%
Cap rate
0.7%
Rent to Value Ratio
Active
$449,900
3
bds
|
2
ba
|
1,903
sqft
|
built
1963
10 Juniper Dr, Ormond Beach, FL 32176
$-817
Cash flow
-9.5%
Cash-on-Cash Return
4.1%
Cap rate
0.6%
Rent to Value Ratio
Active
$283,400
3
bds
|
2
ba
|
1,548
sqft
|
built
1977
1119 Indigo Rd, Ormond Beach, FL 32174
$-448
Cash flow
-8.2%
Cash-on-Cash Return
4.4%
Cap rate
0.7%
Rent to Value Ratio

Active
$739,000
4
bds
|
3
ba
|
3,327
sqft
|
built
2008
28 Dormer Dr, Ormond Beach, FL 32174
$-1,353
Cash flow
-9.6%
Cash-on-Cash Return
4.1%
Cap rate
0.5%
Rent to Value Ratio
Active
$645,000
4
bds
|
2
ba
|
2,766
sqft
|
built
2013
309 Chesham St, Ormond Beach, FL 32174
$-1,958
Cash flow
-15.8%
Cash-on-Cash Return
2.6%
Cap rate
0.5%
Rent to Value Ratio
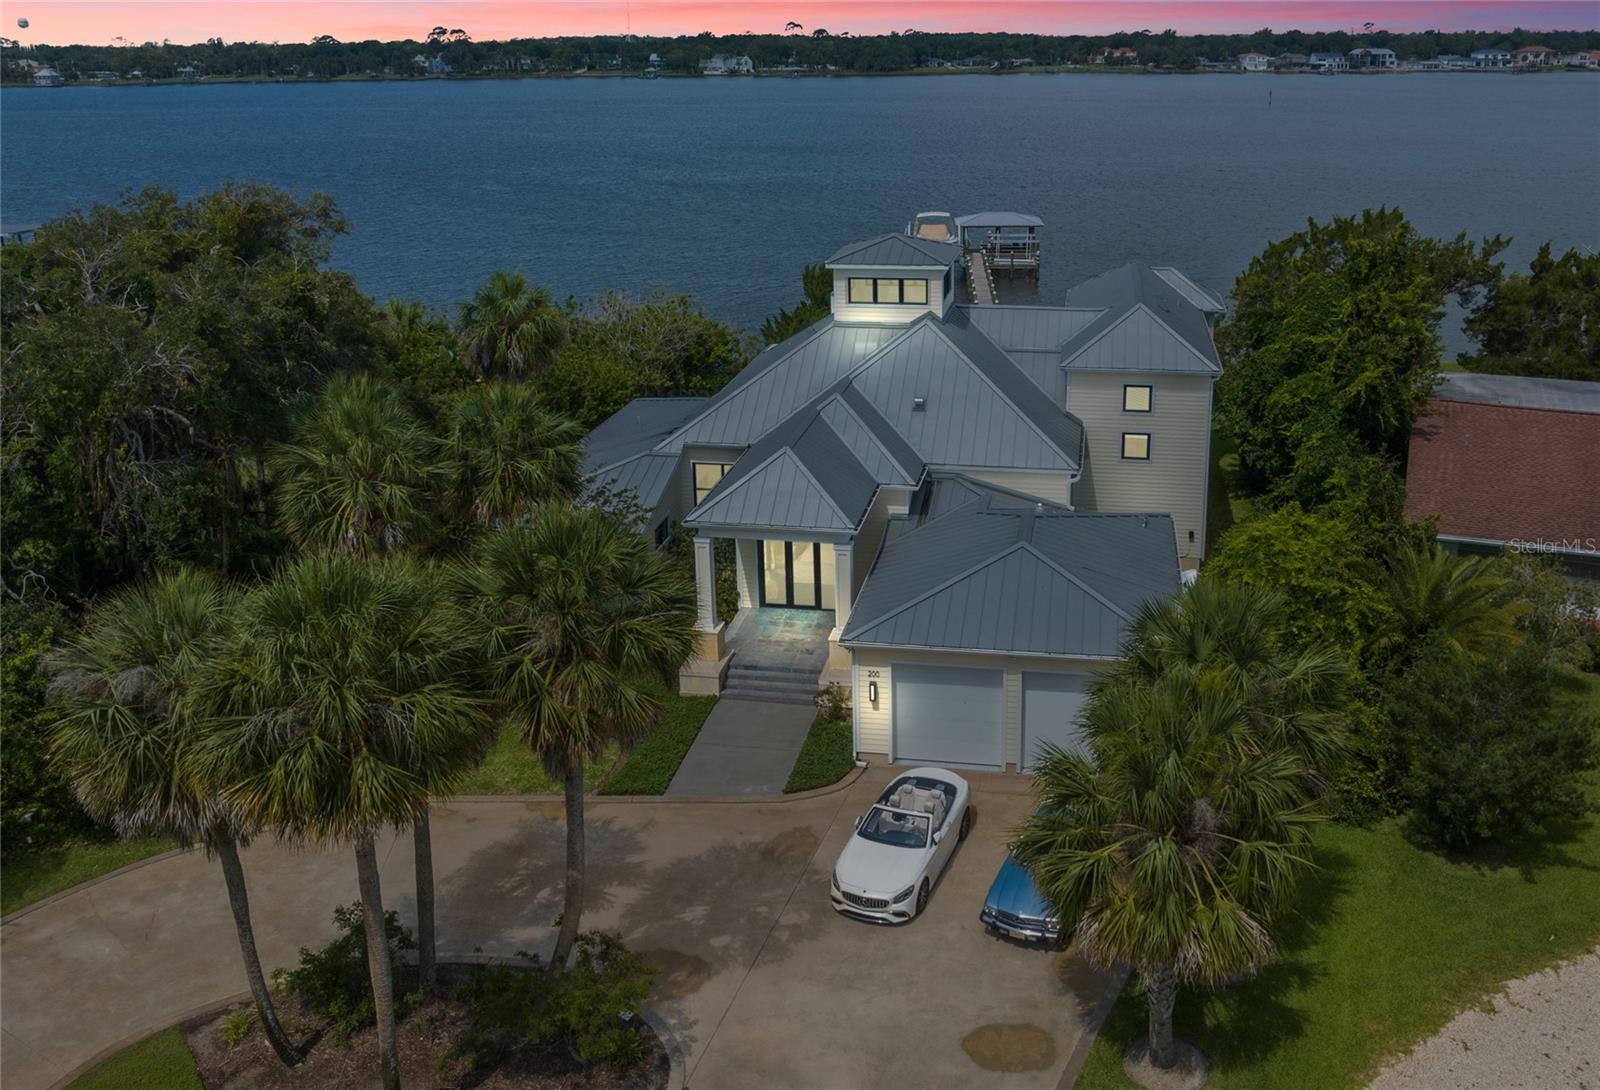
Active
$2,500,000
3
bds
|
4
ba
|
3,856
sqft
|
built
1963
200 John Anderson Dr, Ormond Beach, FL 32176
$-9,729
Cash flow
-20.3%
Cash-on-Cash Return
1.6%
Cap rate
0.3%
Rent to Value Ratio

Active
$375,000
3
bds
|
2
ba
|
1,394
sqft
|
built
1955
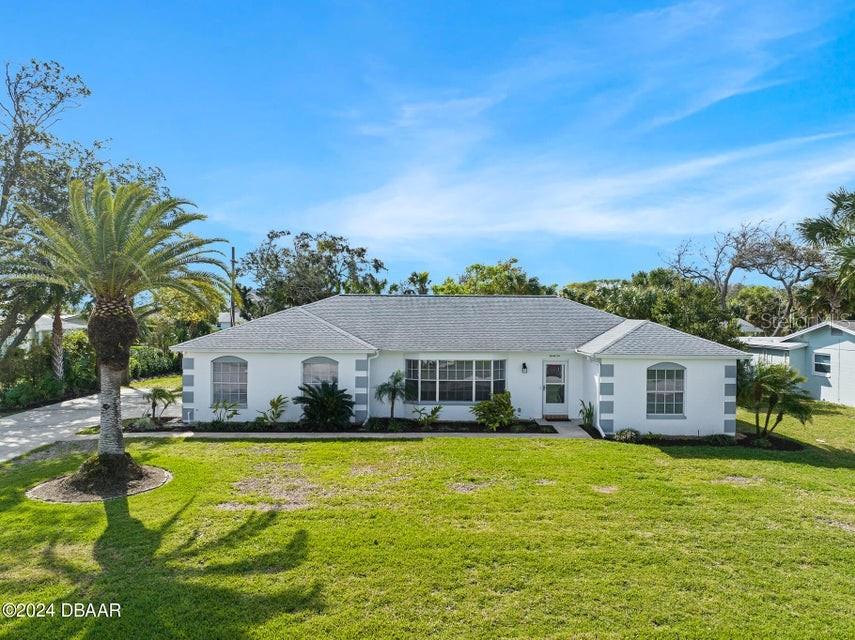
54 Palmetto Dr, Ormond Beach, FL 32176
$-395
Cash flow
-5.5%
Cash-on-Cash Return
5.0%
Cap rate
0.7%
Rent to Value Ratio
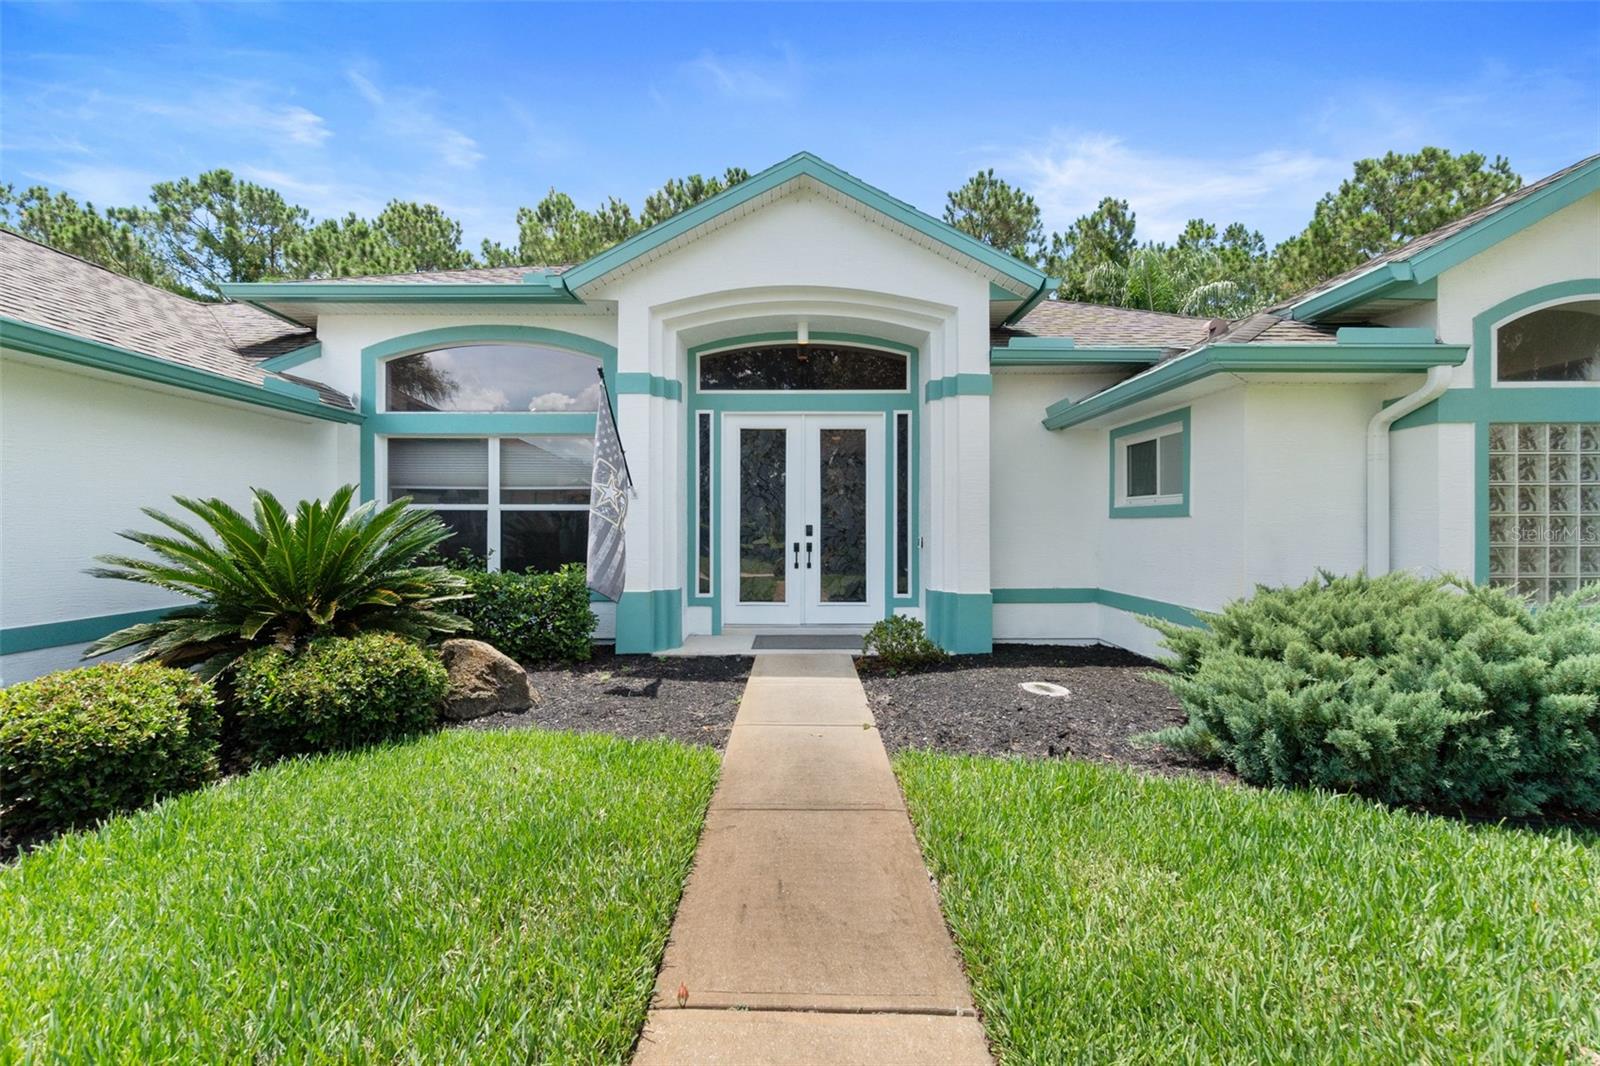
Active
$549,900
3
bds
|
2
ba
|
2,117
sqft
|
built
2002
1273 Sunningdale Ln, Ormond Beach, FL 32174
$-1,114
Cash flow
-10.6%
Cash-on-Cash Return
3.9%
Cap rate
0.7%
Rent to Value Ratio
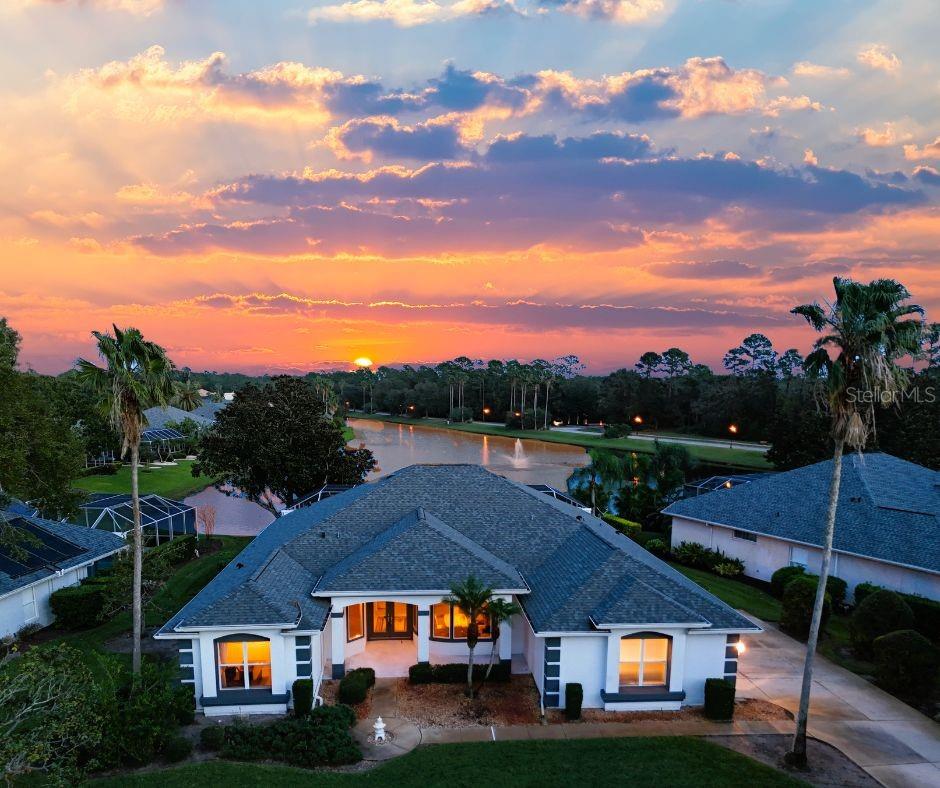
Active
$635,000
4
bds
|
4
ba
|
2,633
sqft
|
built
1998
4 Lakewood Dr, Ormond Beach, FL 32174
$-910
Cash flow
-7.5%
Cash-on-Cash Return
4.6%
Cap rate
0.6%
Rent to Value Ratio

Active
$495,000
3
bds
|
2
ba
|
1,894
sqft
|
built
2013
3240 Tralee Dr, Ormond Beach, FL 32174
$-1,378
Cash flow
-14.5%
Cash-on-Cash Return
2.9%
Cap rate
0.6%
Rent to Value Ratio
Active
$2,999,990
5
bds
|
4
ba
|
5,013
sqft
|
built
1966
717 Ocean Shore Blvd, Ormond Beach, FL 32176
$-12,856
Cash flow
-22.4%
Cash-on-Cash Return
1.1%
Cap rate
0.3%
Rent to Value Ratio
Active
$449,000
4
bds
|
2
ba
|
2,468
sqft
|
built
1978
121 Willow Bend Ln, Ormond Beach, FL 32174
$-159
Cash flow
-1.8%
Cash-on-Cash Return
5.9%
Cap rate
0.8%
Rent to Value Ratio
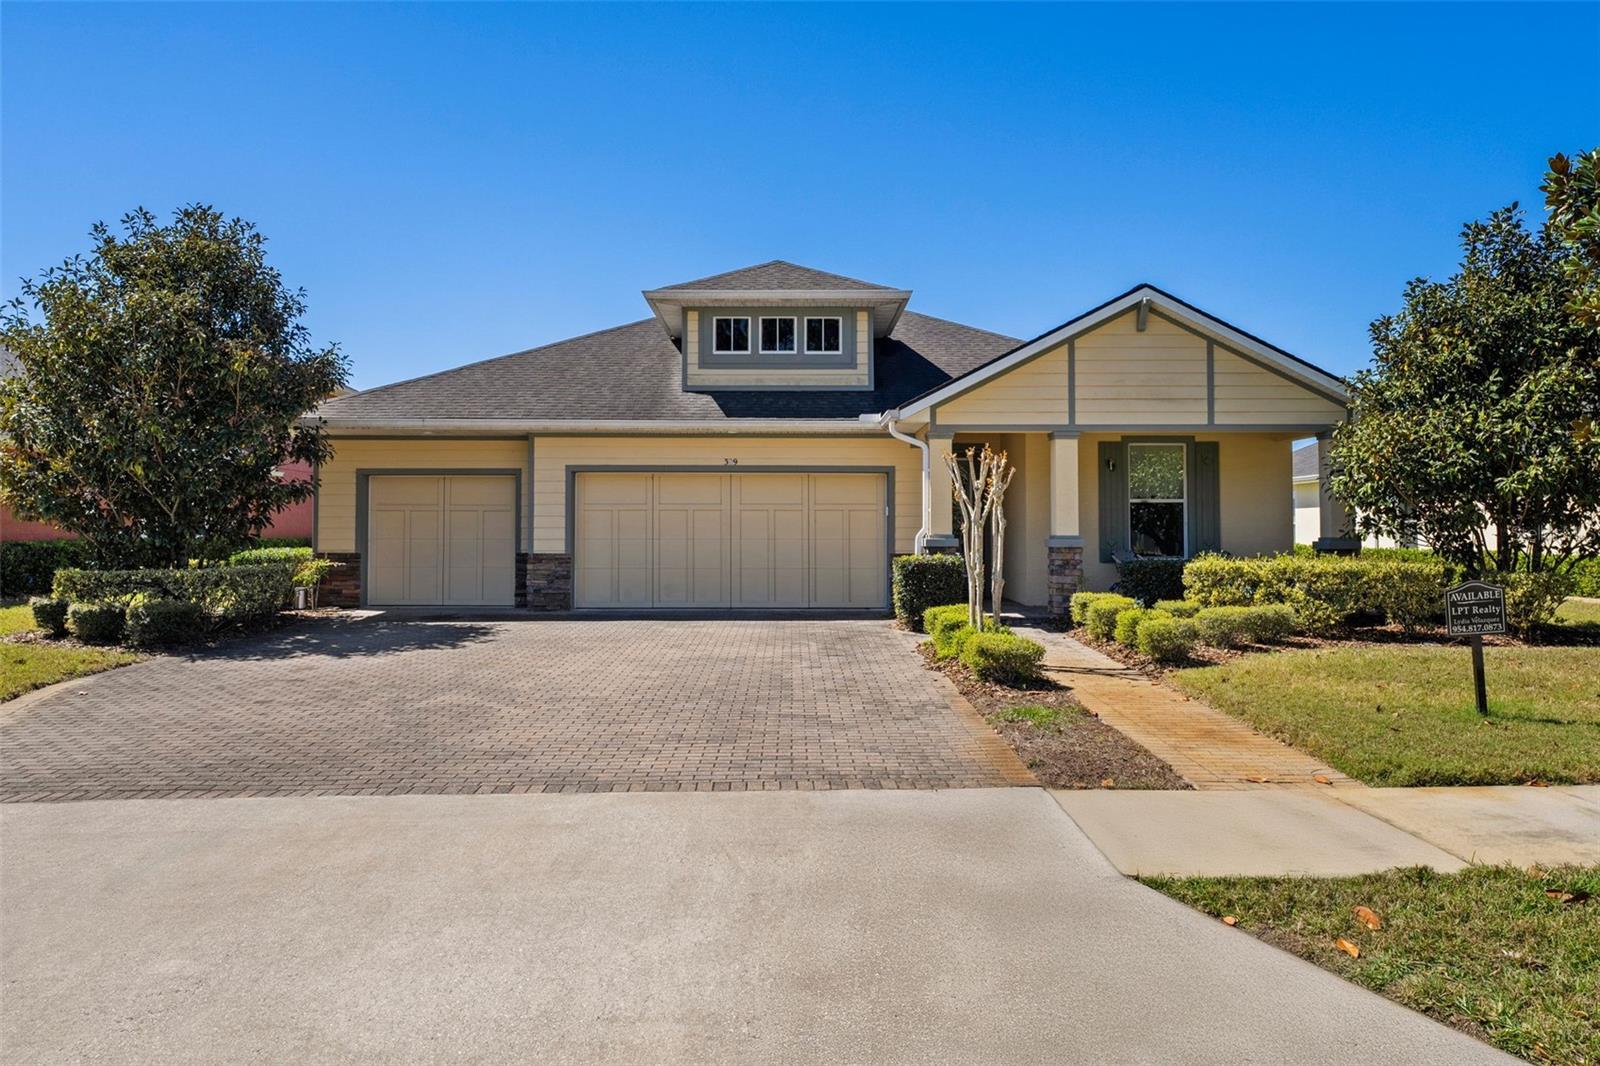
Active
$699,000
4
bds
|
3
ba
|
2,568
sqft
|
built
2022
379 Stirling Bridge Dr, Ormond Beach, FL 32174
$-1,840
Cash flow
-13.7%
Cash-on-Cash Return
3.1%
Cap rate
0.6%
Rent to Value Ratio
Active
$474,400
3
bds
|
2
ba
|
1,360
sqft
|
built
1980
59 Chippingwood Ln, Ormond Beach, FL 32176
$-794
Cash flow
-8.7%
Cash-on-Cash Return
4.3%
Cap rate
0.6%
Rent to Value Ratio
Active
$635,599
3
bds
|
2
ba
|
2,029
sqft
|
built
1996
3 Seabridge Dr, Ormond Beach, FL 32176
$-1,603
Cash flow
-13.2%
Cash-on-Cash Return
3.3%
Cap rate
0.6%
Rent to Value Ratio
Active
$380,000
3
bds
|
2
ba
|
1,276
sqft
|
built
1962
45 San Jose Dr, Ormond Beach, FL 32176
$-371
Cash flow
-5.1%
Cash-on-Cash Return
5.1%
Cap rate
0.7%
Rent to Value Ratio
Active
$698,500
4
bds
|
2
ba
|
2,552
sqft
|
built
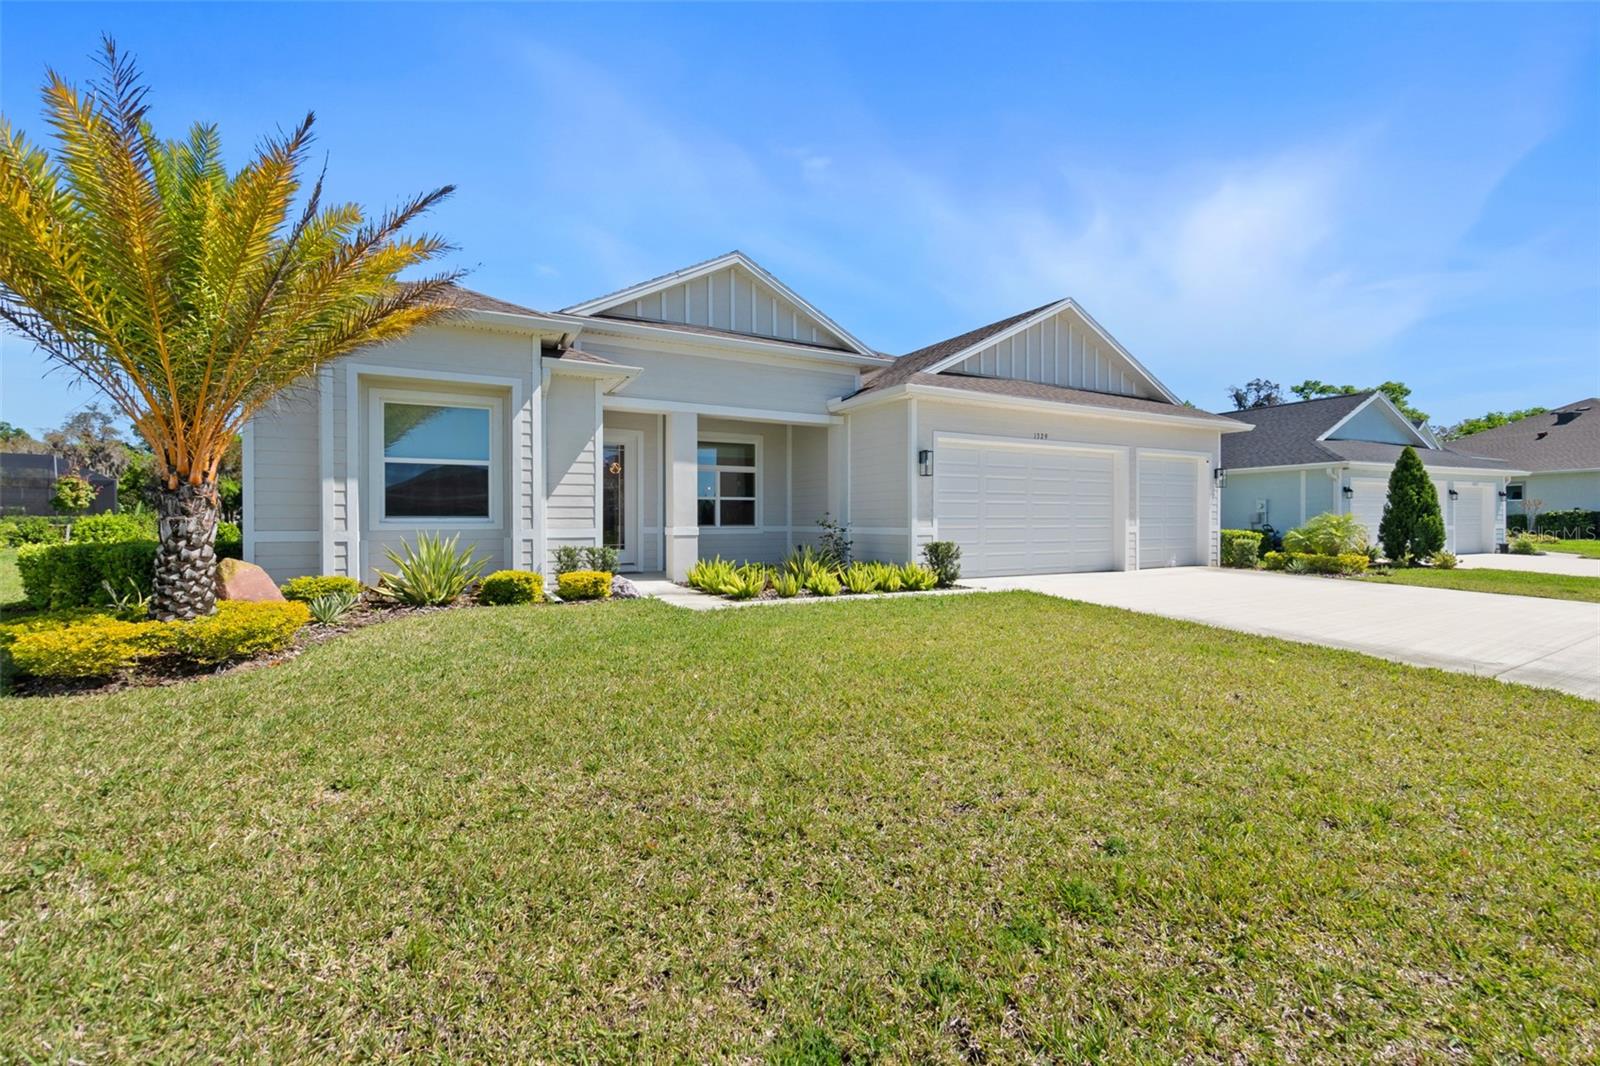
2022
1329 Tullamore Blvd, Ormond Beach, FL 32174
$-1,587
Cash flow
-11.9%
Cash-on-Cash Return
3.6%
Cap rate
0.6%
Rent to Value Ratio
Active
$479,000
3
bds
|
2
ba
|
1,867
sqft
|
built
1974
36 Dresden Cir, Ormond Beach, FL 32174
$-906
Cash flow
-9.9%
Cash-on-Cash Return
4.0%
Cap rate
0.6%
Rent to Value Ratio
Active
$249,000
2
bds
|
2
ba
|
925
sqft
|
built
1986
2700 Ocean Shore Blvd, Ormond Beach, FL 32176
$-190
Cash flow
-4.0%
Cash-on-Cash Return
5.4%
Cap rate
0.8%
Rent to Value Ratio
Active
$475,000
2
bds
|
2
ba
|
1,200
sqft
|
built
1995
1183 Ocean Shore Blvd, Ormond Beach, FL 32176
$-969
Cash flow
-10.6%
Cash-on-Cash Return
3.8%
Cap rate
0.6%
Rent to Value Ratio