Payson, UT Investment Properties for Sale
Browse homes for sale and investment properties in Payson, UT. Refine your search by price, property type, or more.
Best cash flowing properties in Payson, UT
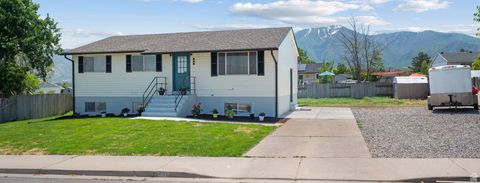
Active
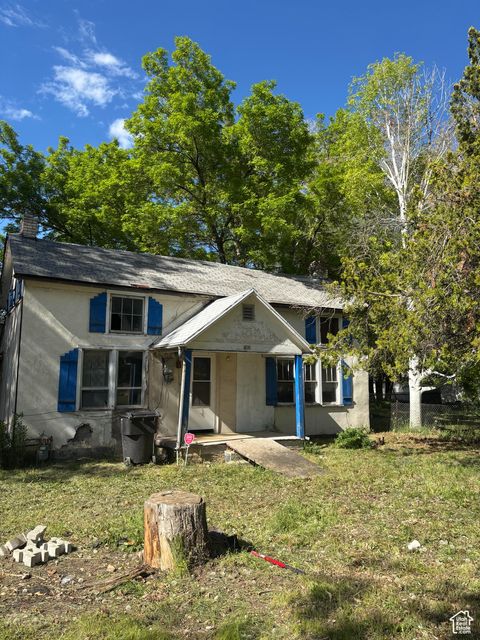
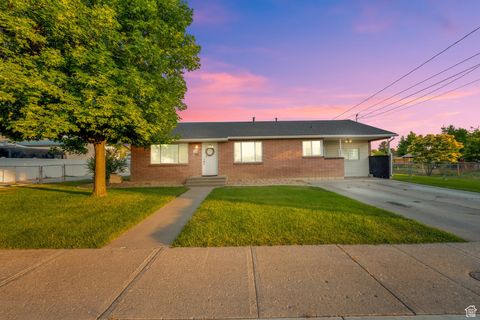
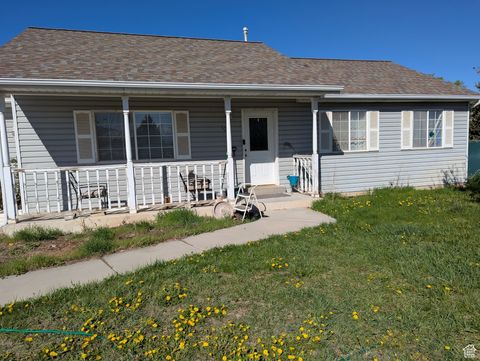
$199,000
2
bds
|
1
ba
|
1,007
sqft
|
built
1940
592 W Utah Ave, Payson, UT 84651
$280
Cash flow
7.3%
Cash-on-Cash Return
8.0%
Cap rate
1.0%
Rent to Value Ratio
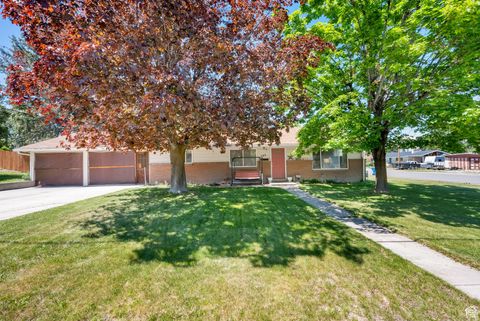
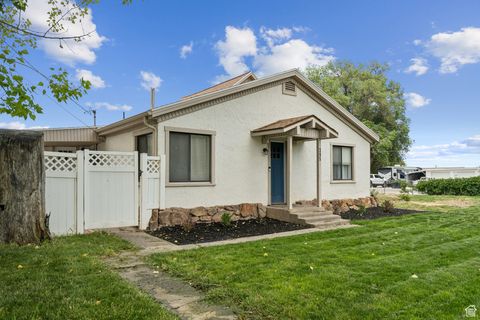
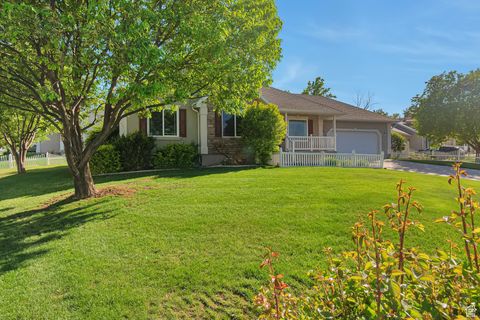
Active
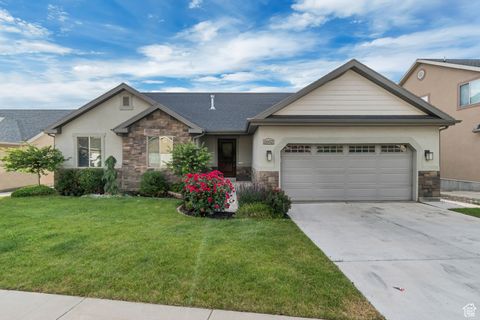
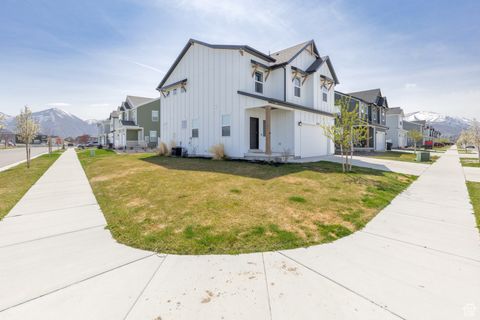
$369,000
2
bds
|
1
ba
|
1,325
sqft
|
built
1973
593 E 600 S, Payson, UT 84651
$-299
Cash flow
-4.2%
Cash-on-Cash Return
4.7%
Cap rate
0.6%
Rent to Value Ratio
42 out of 51 properties for sale in Payson, UT
Limited Results Shown
Create a free account, or log in to reveal all property listings and enjoy the complete experience.
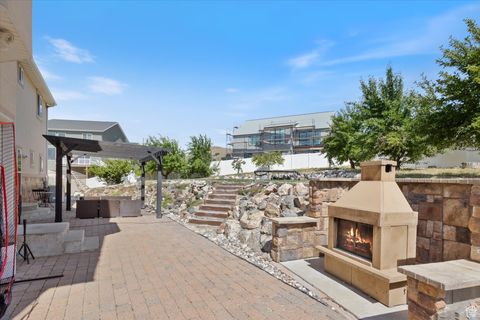
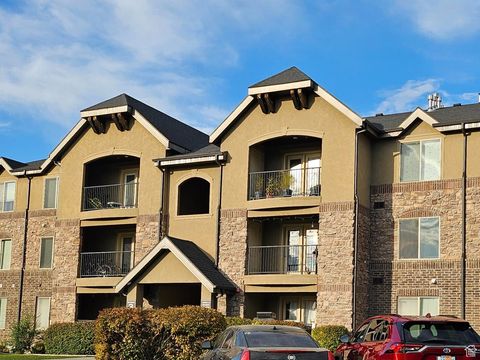
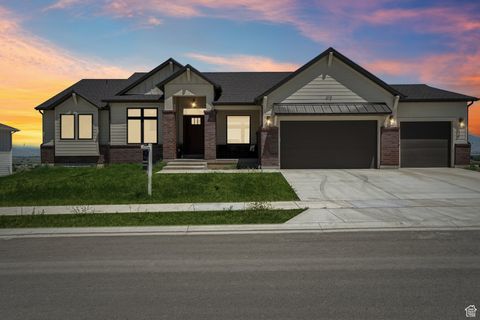
Active
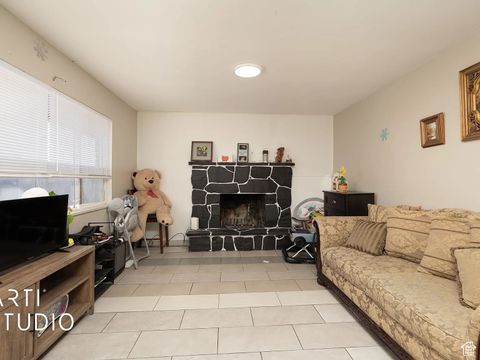
$800,000
4
bds
|
4
ba
|
4,111
sqft
|
built
2003
336 E 1330 S, Payson, UT 84651
$-1,469
Cash flow
-9.6%
Cash-on-Cash Return
4.1%
Cap rate
0.5%
Rent to Value Ratio
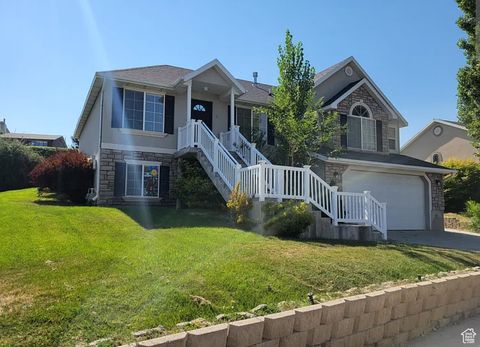
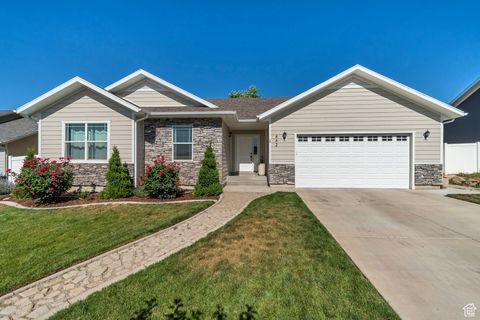
Active
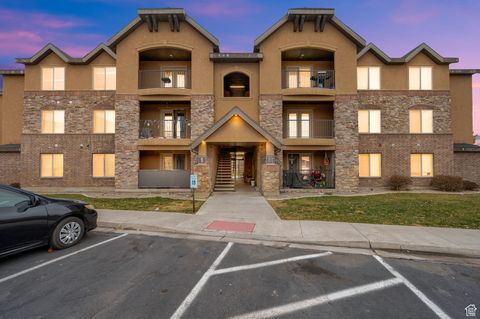
$549,900
5
bds
|
3
ba
|
3,003
sqft
|
built
2000
584 S Loafer View Dr, Payson, UT 84651
$-1,432
Cash flow
-13.6%
Cash-on-Cash Return
2.6%
Cap rate
0.4%
Rent to Value Ratio
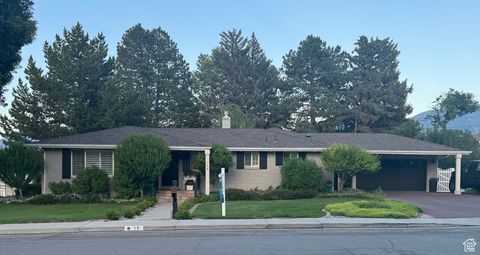
Active
$550,000
6
bds
|
2
ba
|
3,160
sqft
|
built
1956
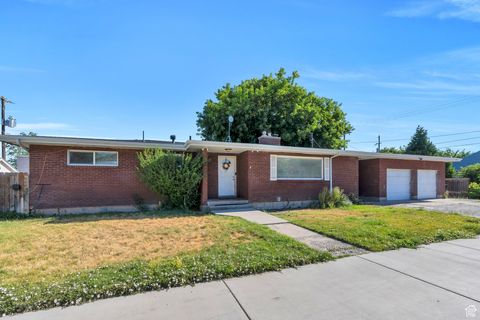
197 E Utah Ave, Payson, UT 84651
$-1,415
Cash flow
-13.4%
Cash-on-Cash Return
2.6%
Cap rate
0.4%
Rent to Value Ratio
Active
$285,000
2
bds
|
2
ba
|
1,020
sqft
|
built
1997
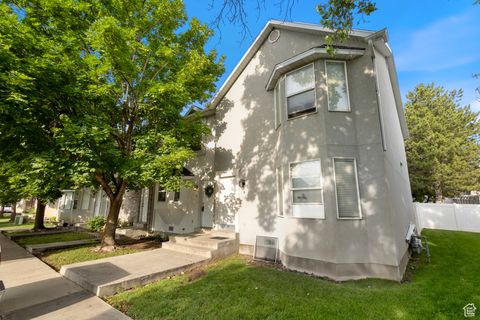
10 S 1000 E, Payson, UT 84651
$-843
Cash flow
-15.4%
Cash-on-Cash Return
2.7%
Cap rate
0.5%
Rent to Value Ratio
Active
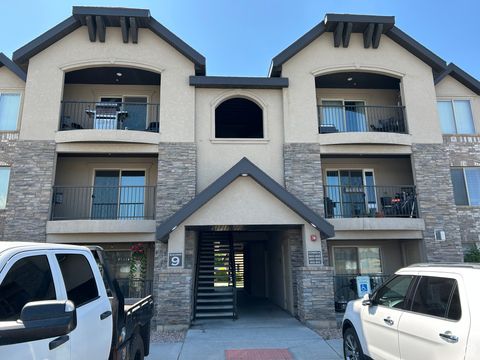
$799,500
9
bds
|
8
ba
|
9,751
sqft
|
built
1974
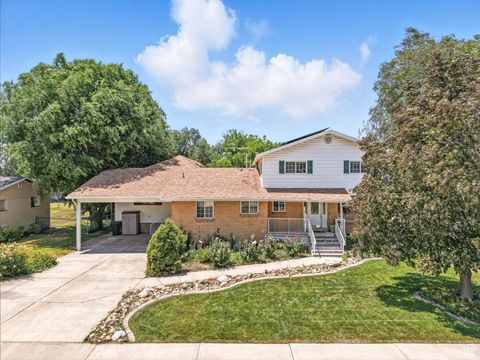
550 S 700 W, Payson, UT 84651
$-2,056
Cash flow
-13.4%
Cash-on-Cash Return
3.2%
Cap rate
0.5%
Rent to Value Ratio
Active
$619,900
6
bds
|
4
ba
|
2,708
sqft
|
built
2020
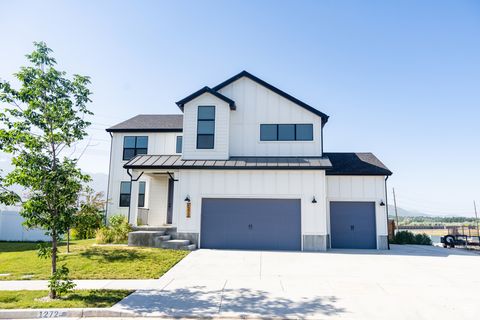
1272 E 1470 N, Payson, UT 84651
$-1,037
Cash flow
-8.7%
Cash-on-Cash Return
3.7%
Cap rate
0.5%
Rent to Value Ratio
Active
$570,000
6
bds
|
3
ba
|
2,829
sqft
|
built
2017
442 N Cowan Cir, Payson, UT 84651
$-1,042
Cash flow
-9.5%
Cash-on-Cash Return
4.1%
Cap rate
0.5%
Rent to Value Ratio
Active
$529,000
6
bds
|
2
ba
|
2,080
sqft
|
built
1980
686 E 750th N, Payson, UT 84651
$-1,568
Cash flow
-15.5%
Cash-on-Cash Return
2.1%
Cap rate
0.3%
Rent to Value Ratio
Active
$409,999
3
bds
|
1
ba
|
1,686
sqft
|
built
1918
395 N 600 W, Payson, UT 84651
$-359
Cash flow
-4.6%
Cash-on-Cash Return
4.6%
Cap rate
0.6%
Rent to Value Ratio
Active
$262,900
3
bds
|
2
ba
|
1,245
sqft
|
built
2007
1045 S 1700 W, Payson, UT 84651
$-672
Cash flow
-13.3%
Cash-on-Cash Return
2.6%
Cap rate
0.5%
Rent to Value Ratio
Active
$604,990
5
bds
|
3
ba
|
2,952
sqft
|
built
2014
1602 S 790 W, Payson, UT 84651
$-965
Cash flow
-8.3%
Cash-on-Cash Return
3.8%
Cap rate
0.5%
Rent to Value Ratio

Active
$569,500
3
bds
|
2
ba
|
2,724
sqft
|
built
2014
319 S 600 E, Payson, UT 84651
$-1,647
Cash flow
-15.1%
Cash-on-Cash Return
2.2%
Cap rate
0.3%
Rent to Value Ratio
Active
$250,000
3
bds
|
2
ba
|
1,230
sqft
|
built
2015
1045 S 1700 W, Payson, UT 84651
$-614
Cash flow
-12.8%
Cash-on-Cash Return
2.7%
Cap rate
0.6%
Rent to Value Ratio
Active
$499,000
4
bds
|
2
ba
|
1,536
sqft
|
built
1956
735 W 100 S, Payson, UT 84651
$-1,162
Cash flow
-12.1%
Cash-on-Cash Return
2.9%
Cap rate
0.4%
Rent to Value Ratio
Active
$600,000
2
bds
|
1
ba
|
754
sqft
|
built
1923
115 N 300 E, Payson, UT 84651
$-1,590
Cash flow
-13.8%
Cash-on-Cash Return
2.5%
Cap rate
0.3%
Rent to Value Ratio
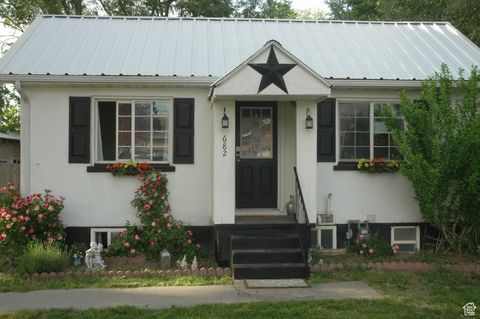
Active
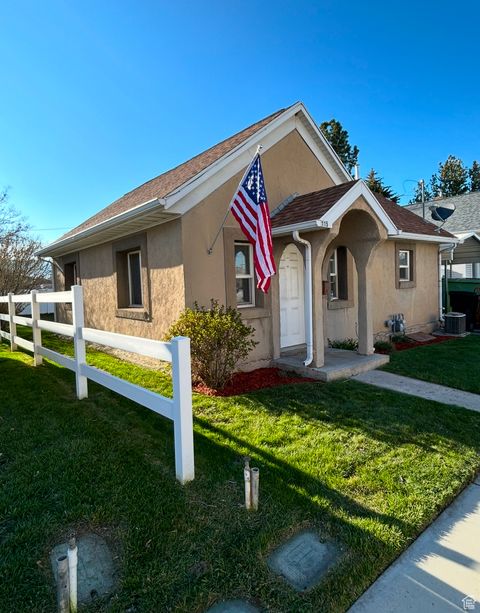
$365,000
2
bds
|
1
ba
|
1,002
sqft
|
built
1941
682 W 400 N, Payson, UT 84651
$-886
Cash flow
-12.7%
Cash-on-Cash Return
2.8%
Cap rate
0.4%
Rent to Value Ratio
Active
$540,000
4
bds
|
3
ba
|
3,102
sqft
|
built
2018
384 N 600 E, Payson, UT 84651
$-1,391
Cash flow
-13.4%
Cash-on-Cash Return
2.6%
Cap rate
0.4%
Rent to Value Ratio
Active
$515,000
5
bds
|
3
ba
|
2,870
sqft
|
built
1989
455 E 400 S, Payson, UT 84651
$-1,322
Cash flow
-13.4%
Cash-on-Cash Return
2.6%
Cap rate
0.4%
Rent to Value Ratio
Active
$400,000
4
bds
|
2
ba
|
1,462
sqft
|
built
1999
256 Jay Ln, Payson, UT 84651
$-945
Cash flow
-12.3%
Cash-on-Cash Return
2.8%
Cap rate
0.4%
Rent to Value Ratio
Active
$975,000
5
bds
|
3
ba
|
4,821
sqft
|
built
2024
412 W Ambleview Way, Payson, UT 84651
$-2,576
Cash flow
-13.8%
Cash-on-Cash Return
2.5%
Cap rate
0.3%
Rent to Value Ratio
Active
$550,000
5
bds
|
3
ba
|
2,970
sqft
|
built
1999
1186 E 470 S, Payson, UT 84651
$-1,123
Cash flow
-10.7%
Cash-on-Cash Return
3.2%
Cap rate
0.5%
Rent to Value Ratio
Active
$620,000
6
bds
|
3
ba
|
2,522
sqft
|
built
2017
235 S 700 W, Payson, UT 84651
$-1,874
Cash flow
-15.8%
Cash-on-Cash Return
2.1%
Cap rate
0.3%
Rent to Value Ratio
Active
$675,000
4
bds
|
3
ba
|
4,448
sqft
|
built
1964
15 E 300 N, Payson, UT 84651
$-1,781
Cash flow
-13.8%
Cash-on-Cash Return
2.5%
Cap rate
0.4%
Rent to Value Ratio

Active
$410,000
3
bds
|
2
ba
|
1,392
sqft
|
built
2003
1409 S 30 E, Payson, UT 84651
$-852
Cash flow
-10.8%
Cash-on-Cash Return
3.2%
Cap rate
0.4%
Rent to Value Ratio
Active
$479,000
5
bds
|
2
ba
|
2,322
sqft
|
built
1993
1006 S 1040 W, Payson, UT 84651
$-1,352
Cash flow
-14.7%
Cash-on-Cash Return
2.3%
Cap rate
0.3%
Rent to Value Ratio

Active
$655,000
6
bds
|
4
ba
|
3,200
sqft
|
built
2004
306 W 1240 S, Payson, UT 84651
$-1,805
Cash flow
-14.4%
Cash-on-Cash Return
2.4%
Cap rate
0.3%
Rent to Value Ratio
Active
$525,000
3
bds
|
3
ba
|
1,930
sqft
|
built
2022
1536 N 1190 E, Payson, UT 84651
$-902
Cash flow
-9.0%
Cash-on-Cash Return
3.6%
Cap rate
0.5%
Rent to Value Ratio
Active
$559,999
6
bds
|
3
ba
|
2,250
sqft
|
built
1970
123 N 800 E, Payson, UT 84651
$-1,632
Cash flow
-15.2%
Cash-on-Cash Return
2.2%
Cap rate
0.3%
Rent to Value Ratio

Active
$579,900
6
bds
|
3
ba
|
4,072
sqft
|
built
1972
391 S 700 E, Payson, UT 84651
$-835
Cash flow
-7.5%
Cash-on-Cash Return
4.0%
Cap rate
0.5%
Rent to Value Ratio

Active
$349,000
3
bds
|
3
ba
|
1,433
sqft
|
built
2023
1788 N 1260 E, Payson, UT 84651
$-795
Cash flow
-11.9%
Cash-on-Cash Return
2.9%
Cap rate
0.5%
Rent to Value Ratio

Active
$749,000
5
bds
|
3
ba
|
3,600
sqft
|
built
1880
116 E 100 S, Payson, UT 84651
$-2,043
Cash flow
-14.2%
Cash-on-Cash Return
2.4%
Cap rate
0.3%
Rent to Value Ratio

Active
$539,900
3
bds
|
3
ba
|
2,332
sqft
|
built
2022
1524 N 1190 E, Payson, UT 84651
$-1,391
Cash flow
-13.4%
Cash-on-Cash Return
2.6%
Cap rate
0.4%
Rent to Value Ratio

Active
$380,000
2
bds
|
1
ba
|
1,128
sqft
|
built
1914
155 E 100 S, Payson, UT 84651
$-751
Cash flow
-10.3%
Cash-on-Cash Return
3.3%
Cap rate
0.4%
Rent to Value Ratio

Active
$399,900
3
bds
|
3
ba
|
1,505
sqft
|
built
2022
1718 N 1310 E, Payson, UT 84651
$-941
Cash flow
-12.3%
Cash-on-Cash Return
2.9%
Cap rate
0.5%
Rent to Value Ratio

Active
$384,900
3
bds
|
2
ba
|
1,422
sqft
|
built
2017
539 N Douglass Dr, Payson, UT 84651
$-822
Cash flow
-11.1%
Cash-on-Cash Return
3.1%
Cap rate
0.4%
Rent to Value Ratio

Active
$260,000
3
bds
|
2
ba
|
1,210
sqft
|
built
2012
1045 S 1700 W, Payson, UT 84651
$-661
Cash flow
-13.3%
Cash-on-Cash Return
2.6%
Cap rate
0.5%
Rent to Value Ratio

Active
$2,795,000
12
bds
|
9
ba
|
7,500
sqft
|
built
2008
6007 W 8000 S, Payson, UT 84651
$-10,966
Cash flow
-20.5%
Cash-on-Cash Return
1.0%
Cap rate
0.1%
Rent to Value Ratio
Active
$271,800
3
bds
|
2
ba
|
1,307
sqft
|
built
2007
1045 S 1700 W, Payson, UT 84651
$-714
Cash flow
-13.7%
Cash-on-Cash Return
2.5%
Cap rate
0.5%
Rent to Value Ratio