Pembroke Pines, FL Investment Properties for Sale
Browse homes for sale and investment properties in Pembroke Pines, FL. Refine your search by price, property type, or more.
Best cash flowing properties in Pembroke Pines, FL
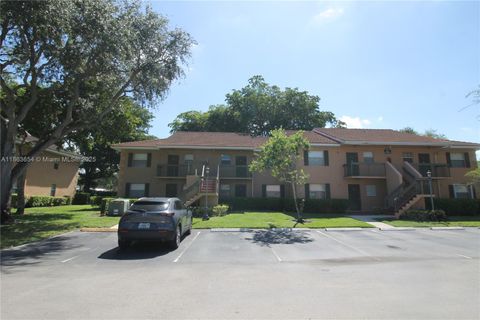
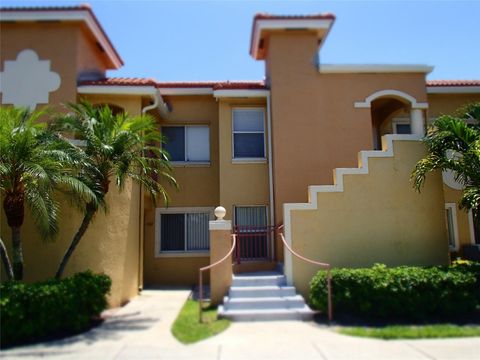
Active
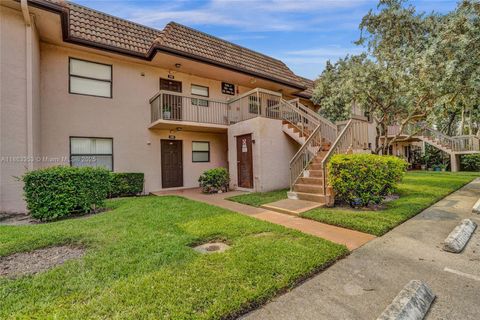
$245,000
2
bds
|
2
ba
|
806
sqft
|
built
1986
1156 NW 106th Ter, Pembroke Pines, FL 33026
$-236
Cash flow
-5.0%
Cash-on-Cash Return
5.0%
Cap rate
0.9%
Rent to Value Ratio
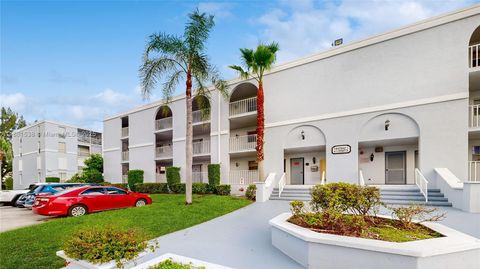
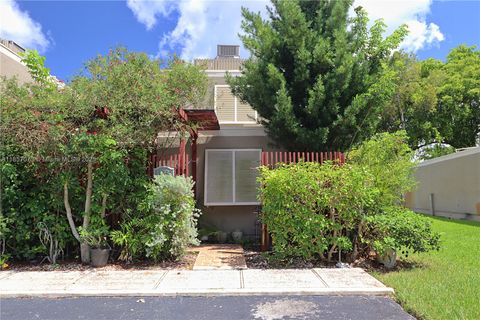
Active
$235,000
2
bds
|
2
ba
|
1,100
sqft
|
built
1974
661 N University Dr, Pembroke Pines, FL 33024
$-381
Cash flow
-8.5%
Cash-on-Cash Return
4.2%
Cap rate
0.9%
Rent to Value Ratio
331 out of 366 properties for sale in Pembroke Pines, FL
Limited Results Shown
Create a free account, or log in to reveal all property listings and enjoy the complete experience.
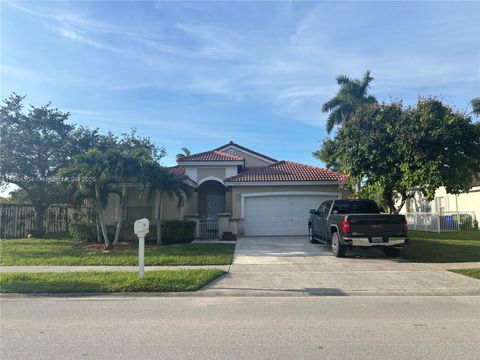
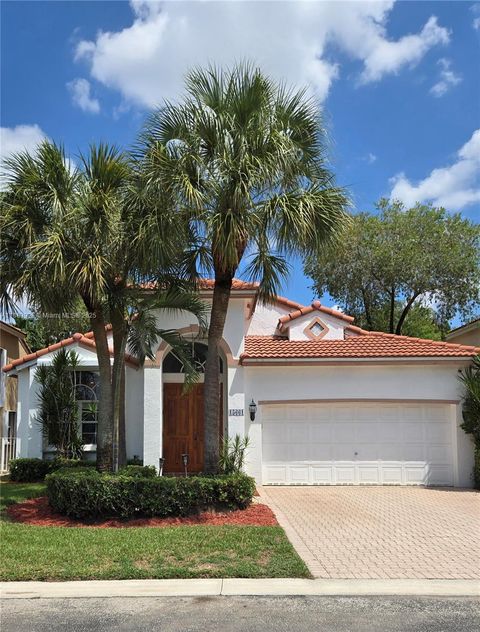
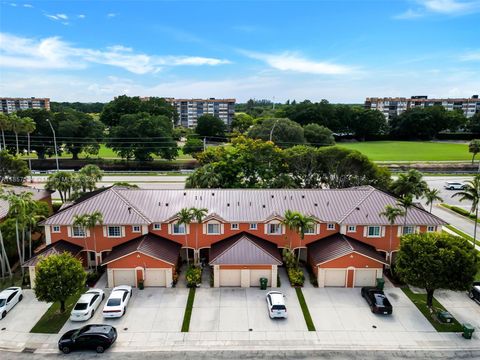
Active
$699,999
3
bds
|
2
ba
|
1,821
sqft
|
built
1997
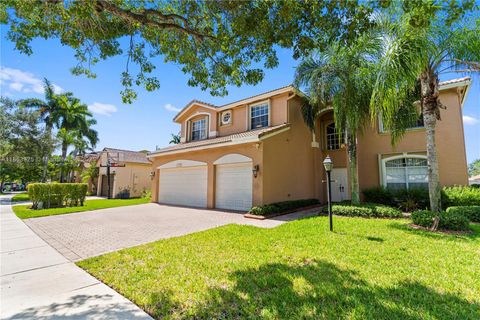
18581 NW 23rd St, Pembroke Pines, FL 33029
$-2,226
Cash flow
-16.6%
Cash-on-Cash Return
2.3%
Cap rate
0.5%
Rent to Value Ratio
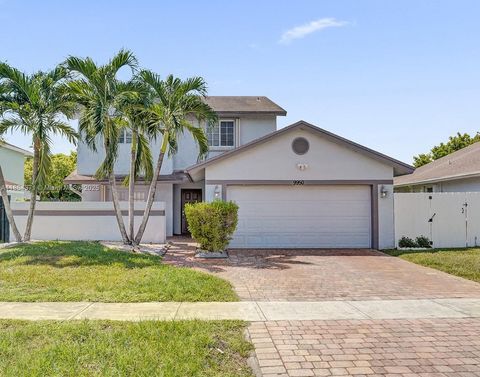
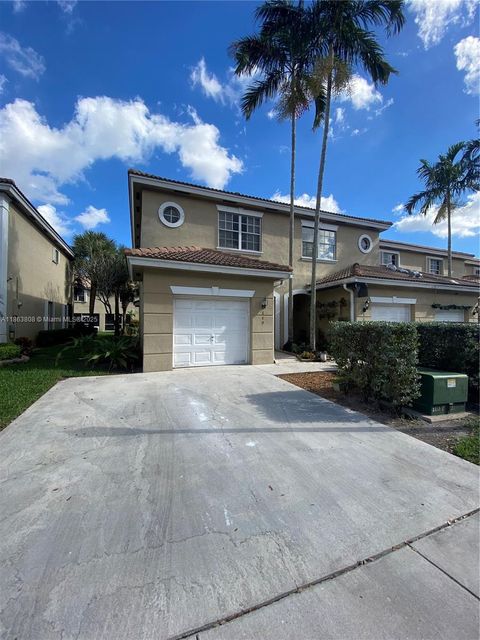
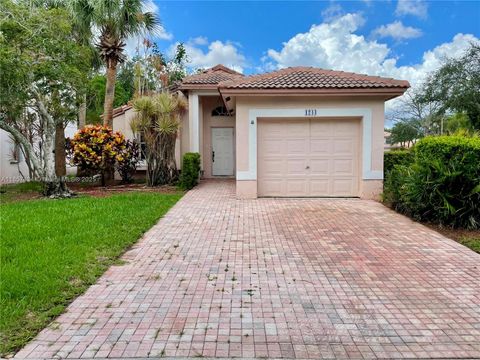
Active
$650,000
4
bds
|
3
ba
|
2,011
sqft
|
built
1987
9950 SW 12th St, Pembroke Pines, FL 33025
$-1,661
Cash flow
-13.3%
Cash-on-Cash Return
3.1%
Cap rate
0.6%
Rent to Value Ratio
Active
$375,500
2
bds
|
2
ba
|
1,196
sqft
|
built
1978
2311 Elm Ct, Pembroke Pines, FL 33026
$-757
Cash flow
-10.5%
Cash-on-Cash Return
3.7%
Cap rate
0.7%
Rent to Value Ratio
Active
$395,000
2
bds
|
3
ba
|
1,114
sqft
|
built
2001
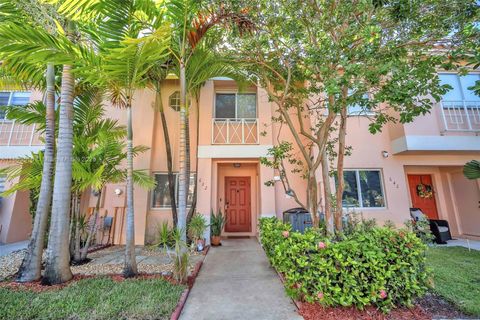
632 NW 208th Ter, Pembroke Pines, FL 33029
$-868
Cash flow
-11.5%
Cash-on-Cash Return
3.5%
Cap rate
0.6%
Rent to Value Ratio
Active
$960,000
5
bds
|
4
ba
|
3,638
sqft
|
built
1999
13374 NW 13th St, Pembroke Pines, FL 33028
$-2,396
Cash flow
-13.0%
Cash-on-Cash Return
3.2%
Cap rate
0.6%
Rent to Value Ratio
Active
$415,000
2
bds
|
1
ba
|
897
sqft
|
built
1965
7740 NW 15th Ct, Pembroke Pines, FL 33024
$-750
Cash flow
-9.4%
Cash-on-Cash Return
4.0%
Cap rate
0.6%
Rent to Value Ratio
Active
$259,000
2
bds
|
2
ba
|
914
sqft
|
built
1986
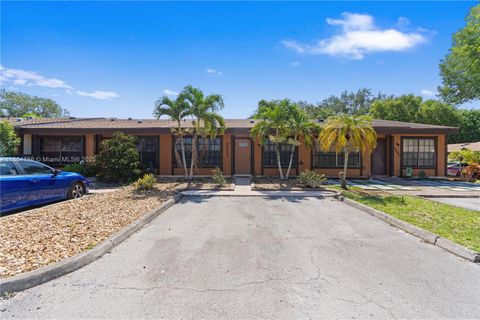
721 NW 103rd Ter, Pembroke Pines, FL 33026
$-583
Cash flow
-11.7%
Cash-on-Cash Return
3.4%
Cap rate
0.8%
Rent to Value Ratio
Active
$675,000
3
bds
|
2
ba
|
1,774
sqft
|
built
1993
15661 SW 16th Ct, Pembroke Pines, FL 33027
$-1,586
Cash flow
-12.3%
Cash-on-Cash Return
3.3%
Cap rate
0.6%
Rent to Value Ratio
Active
$474,987
3
bds
|
3
ba
|
1,428
sqft
|
built
1997
449 SW 122nd Ter, Pembroke Pines, FL 33025
$-1,161
Cash flow
-12.8%
Cash-on-Cash Return
3.2%
Cap rate
0.7%
Rent to Value Ratio
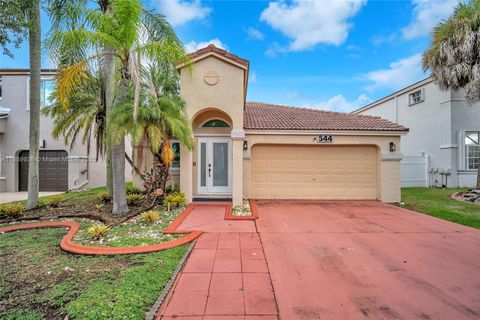
Active
$640,000
3
bds
|
2
ba
|
1,582
sqft
|
built
1995
544 NW 159th Ln, Pembroke Pines, FL 33028
$-1,604
Cash flow
-13.1%
Cash-on-Cash Return
3.1%
Cap rate
0.6%
Rent to Value Ratio
Active
$649,999
3
bds
|
2
ba
|
1,699
sqft
|
built
1960
600 SW 64th Pkwy, Pembroke Pines, FL 33023
$-1,299
Cash flow
-10.4%
Cash-on-Cash Return
3.7%
Cap rate
0.5%
Rent to Value Ratio
Active
$629,800
3
bds
|
3
ba
|
0
sqft
|
built
1992
2130 NW 184th Way, Pembroke Pines, FL 33029
$-1,697
Cash flow
-14.1%
Cash-on-Cash Return
2.9%
Cap rate
0.5%
Rent to Value Ratio
Active
$489,000
3
bds
|
3
ba
|
1,584
sqft
|
built
2001
964 NW 100th Ave, Pembroke Pines, FL 33024
$-603
Cash flow
-6.4%
Cash-on-Cash Return
4.7%
Cap rate
0.8%
Rent to Value Ratio
Active
$750,000
4
bds
|
2
ba
|
1,865
sqft
|
built
1978
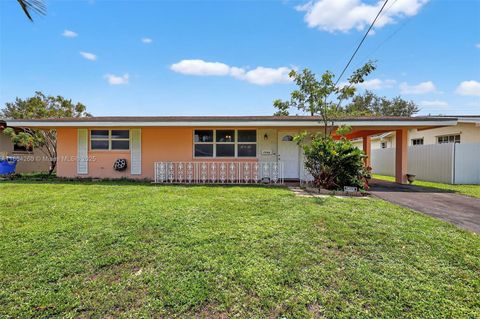
8800 NW 3rd St, Pembroke Pines, FL 33024
$-1,480
Cash flow
-10.3%
Cash-on-Cash Return
3.8%
Cap rate
0.5%
Rent to Value Ratio
Active
$499,000
3
bds
|
3
ba
|
1,738
sqft
|
built
2002
1915 NW 79th Ter, Pembroke Pines, FL 33024
$-1,720
Cash flow
-18.0%
Cash-on-Cash Return
2.0%
Cap rate
0.5%
Rent to Value Ratio
Active
$644,900
3
bds
|
2
ba
|
1,462
sqft
|
built
1996
491 SW 203rd Ave, Pembroke Pines, FL 33029
$-1,300
Cash flow
-10.5%
Cash-on-Cash Return
3.7%
Cap rate
0.5%
Rent to Value Ratio
Active
$630,000
3
bds
|
3
ba
|
1,952
sqft
|
built
1998
1958 NW 100th Ave, Pembroke Pines, FL 33024
$-1,356
Cash flow
-11.2%
Cash-on-Cash Return
3.6%
Cap rate
0.6%
Rent to Value Ratio
Active
$878,500
4
bds
|
3
ba
|
2,355
sqft
|
built
2000
14216 NW 21st St, Pembroke Pines, FL 33028
$-6,606
Cash flow
-39.2%
Cash-on-Cash Return
-2.9%
Cap rate
0.6%
Rent to Value Ratio
Active
$450,000
3
bds
|
3
ba
|
1,400
sqft
|
built
1986
340 SW 97th Ave, Pembroke Pines, FL 33025
$-1,229
Cash flow
-14.2%
Cash-on-Cash Return
2.9%
Cap rate
0.6%
Rent to Value Ratio
Active
$1,050,000
6
bds
|
4
ba
|
3,912
sqft
|
built
2002
1064 SW 159th Ln, Pembroke Pines, FL 33027
$-2,497
Cash flow
-12.4%
Cash-on-Cash Return
3.3%
Cap rate
0.5%
Rent to Value Ratio
Active
$339,000
2
bds
|
2
ba
|
1,213
sqft
|
built
1998
160 SW 117th Ter, Pembroke Pines, FL 33025
$-1,033
Cash flow
-15.9%
Cash-on-Cash Return
2.5%
Cap rate
0.7%
Rent to Value Ratio
Active
$785,000
4
bds
|
3
ba
|
2,392
sqft
|
built
1996
18840 NW 23rd Pl, Pembroke Pines, FL 33029
$-1,619
Cash flow
-10.8%
Cash-on-Cash Return
3.7%
Cap rate
0.6%
Rent to Value Ratio
Active
$720,000
3
bds
|
2
ba
|
1,648
sqft
|
built
1996
2411 NW 184th Ter, Pembroke Pines, FL 33029
$-1,787
Cash flow
-12.9%
Cash-on-Cash Return
3.2%
Cap rate
0.6%
Rent to Value Ratio
Active
$310,000
2
bds
|
2
ba
|
787
sqft
|
built
1984
9317 NW 1st Ct, Pembroke Pines, FL 33024
$-887
Cash flow
-14.9%
Cash-on-Cash Return
2.7%
Cap rate
0.7%
Rent to Value Ratio
Active
$700,000
4
bds
|
3
ba
|
2,452
sqft
|
built
1973
621 NW 97th Ter, Pembroke Pines, FL 33024
$-1,733
Cash flow
-12.9%
Cash-on-Cash Return
3.2%
Cap rate
0.6%
Rent to Value Ratio
Active
$618,000
3
bds
|
4
ba
|
2,078
sqft
|
built
2018
11660 SW 13th Ct, Pembroke Pines, FL 33025
$-1,685
Cash flow
-14.2%
Cash-on-Cash Return
2.9%
Cap rate
0.6%
Rent to Value Ratio
Active
$889,000
5
bds
|
4
ba
|
2,871
sqft
|
built
1996
322 SW 184th Way, Pembroke Pines, FL 33029
$-1,813
Cash flow
-10.6%
Cash-on-Cash Return
3.7%
Cap rate
0.6%
Rent to Value Ratio
Active
$269,900
2
bds
|
2
ba
|
854
sqft
|
built
1987
1791 NW 96th Ter, Pembroke Pines, FL 33024
$-484
Cash flow
-9.4%
Cash-on-Cash Return
4.0%
Cap rate
0.9%
Rent to Value Ratio
Active
$750,000
4
bds
|
3
ba
|
2,428
sqft
|
built
2002
9860 NW 20th Ct, Pembroke Pines, FL 33024
$-1,614
Cash flow
-11.2%
Cash-on-Cash Return
3.6%
Cap rate
0.6%
Rent to Value Ratio
Active
$419,990
3
bds
|
3
ba
|
1,396
sqft
|
built
2008
1068 SW 143rd Ave, Pembroke Pines, FL 33027
$-1,368
Cash flow
-17.0%
Cash-on-Cash Return
2.2%
Cap rate
0.7%
Rent to Value Ratio
Active
$473,000
3
bds
|
3
ba
|
1,694
sqft
|
built
2002
1716 NW 78th Way, Pembroke Pines, FL 33024
$-1,318
Cash flow
-14.5%
Cash-on-Cash Return
2.8%
Cap rate
0.6%
Rent to Value Ratio
Active
$599,900
3
bds
|
2
ba
|
0
sqft
|
built
1967
120 NW 77th Way, Pembroke Pines, FL 33024
$-1,416
Cash flow
-12.3%
Cash-on-Cash Return
3.3%
Cap rate
0.7%
Rent to Value Ratio
Active
$399,000
3
bds
|
3
ba
|
1,361
sqft
|
built
1999
719 NW 208th Way, Pembroke Pines, FL 33029
$-472
Cash flow
-6.2%
Cash-on-Cash Return
4.7%
Cap rate
0.7%
Rent to Value Ratio
Active
$234,900
2
bds
|
1
ba
|
770
sqft
|
built
1989
8713 SW 5th St, Pembroke Pines, FL 33025
$-642
Cash flow
-14.3%
Cash-on-Cash Return
2.9%
Cap rate
0.9%
Rent to Value Ratio
Active
$268,900
2
bds
|
2
ba
|
970
sqft
|
built
2001
7820 NW 7th St, Pembroke Pines, FL 33024
$-563
Cash flow
-10.9%
Cash-on-Cash Return
3.6%
Cap rate
0.9%
Rent to Value Ratio
Active
$395,000
2
bds
|
2
ba
|
1,318
sqft
|
built
1978
11060 N Lakeview Dr, Pembroke Pines, FL 33026
$-940
Cash flow
-12.4%
Cash-on-Cash Return
3.3%
Cap rate
0.7%
Rent to Value Ratio
Active
$499,999
2
bds
|
3
ba
|
1,312
sqft
|
built
2001
1206 NW 100th Ave, Pembroke Pines, FL 33024
$-1,396
Cash flow
-14.6%
Cash-on-Cash Return
2.8%
Cap rate
0.6%
Rent to Value Ratio
Active
$525,000
3
bds
|
2
ba
|
1,416
sqft
|
built
1995
1244 NW 171st Ave, Pembroke Pines, FL 33028
$-903
Cash flow
-9.0%
Cash-on-Cash Return
4.1%
Cap rate
0.7%
Rent to Value Ratio