Pinecrest, FL Investment Properties for Sale
Browse homes for sale and investment properties in Pinecrest, FL. Refine your search by price, property type, or more.
Best cash flowing properties in Pinecrest, FL
Active
$235,000
1
bds
|
2
ba
|
904
sqft
|
built
1970
6886 N Kendall Dr, Pinecrest, FL 33156
$-706
Cash flow
-15.7%
Cash-on-Cash Return
2.7%
Cap rate
0.9%
Rent to Value Ratio
Active
$255,000
1
bds
|
1
ba
|
710
sqft
|
built
1966
6711 N Kendall Dr, Pinecrest, FL 33156
$-852
Cash flow
-17.4%
Cash-on-Cash Return
2.3%
Cap rate
0.8%
Rent to Value Ratio
164 out of 175 properties for sale in Pinecrest, FL
Limited Results Shown
Create a free account, or log in to reveal all property listings and enjoy the complete experience.
Active
$7,695,000
6
bds
|
7
ba
|
6,767
sqft
|
built
2023
6031 SW 88th St, Pinecrest, FL 33156
$-38,027
Cash flow
-25.8%
Cash-on-Cash Return
0.4%
Cap rate
0.1%
Rent to Value Ratio
Active
$10,500,000
8
bds
|
10
ba
|
9,194
sqft
|
built
2023
8825 SW 64th Ct, Pinecrest, FL 33156
$-57,747
Cash flow
-28.7%
Cash-on-Cash Return
-0.3%
Cap rate
0.1%
Rent to Value Ratio
Active
$1,650,000
3
bds
|
3
ba
|
3,747
sqft
|
built
1955
8001 SW 133rd St, Pinecrest, FL 33156
$-4,829
Cash flow
-15.3%
Cash-on-Cash Return
2.8%
Cap rate
0.4%
Rent to Value Ratio
Active
$6,995,000
6
bds
|
7
ba
|
5,349
sqft
|
built
2022
7825 SW 128th St, Pinecrest, FL 33156
$-34,323
Cash flow
-25.6%
Cash-on-Cash Return
0.4%
Cap rate
0.1%
Rent to Value Ratio
Active
$3,490,000
6
bds
|
6
ba
|
4,303
sqft
|
built
2014
12401 SW 82nd Ave, Pinecrest, FL 33156
$-14,444
Cash flow
-21.6%
Cash-on-Cash Return
1.3%
Cap rate
0.3%
Rent to Value Ratio
Active
$8,499,000
6
bds
|
7
ba
|
7,098
sqft
|
built
1960
6295 Moss Ranch Rd, Pinecrest, FL 33156
$-43,120
Cash flow
-26.5%
Cash-on-Cash Return
0.2%
Cap rate
0.1%
Rent to Value Ratio

Active
$1,875,000
4
bds
|
3
ba
|
0
sqft
|
built
1958
7440 SW 126th St, Pinecrest, FL 33156
$-5,778
Cash flow
-16.1%
Cash-on-Cash Return
2.6%
Cap rate
0.4%
Rent to Value Ratio
Active
$2,990,000
5
bds
|
3
ba
|
2,774
sqft
|
built
1972
7551 SW 109th Ter, Pinecrest, FL 33156
$-11,446
Cash flow
-20.0%
Cash-on-Cash Return
1.7%
Cap rate
0.3%
Rent to Value Ratio
Active
$6,850,000
7
bds
|
7
ba
|
6,411
sqft
|
built
2007
6900 SW 115th St, Pinecrest, FL 33156
$-35,138
Cash flow
-26.8%
Cash-on-Cash Return
0.2%
Cap rate
0.1%
Rent to Value Ratio
Active
$1,250,000
3
bds
|
2
ba
|
1,833
sqft
|
built
1960
7200 SW 131st St, Pinecrest, FL 33156
$-3,046
Cash flow
-12.7%
Cash-on-Cash Return
3.4%
Cap rate
0.5%
Rent to Value Ratio
Active
$3,990,000
6
bds
|
7
ba
|
5,066
sqft
|
built
2005
11725 SW 69th Ct, Pinecrest, FL 33156
$-17,313
Cash flow
-22.6%
Cash-on-Cash Return
1.1%
Cap rate
0.2%
Rent to Value Ratio
Active
$569,000
2
bds
|
2
ba
|
1,467
sqft
|
built
2006
9066 SW 73rd Ct, Pinecrest, FL 33156
$-2,561
Cash flow
-23.5%
Cash-on-Cash Return
0.9%
Cap rate
0.7%
Rent to Value Ratio
Active
$7,900,000
8
bds
|
10
ba
|
8,105
sqft
|
built
2022
5700 SW 91st St, Pinecrest, FL 33156
$-42,411
Cash flow
-28.0%
Cash-on-Cash Return
-0.1%
Cap rate
0.1%
Rent to Value Ratio
Active
$18,000,000
10
bds
|
11
ba
|
11,400
sqft
|
built
2025
10061 SW 60th Ct, Pinecrest, FL 33156
$-94,837
Cash flow
-27.5%
Cash-on-Cash Return
0.0%
Cap rate
0.1%
Rent to Value Ratio
Active
$315,000
2
bds
|
2
ba
|
1,056
sqft
|
built
1970
6890 N Kendall Dr, Pinecrest, FL 33156
$-952
Cash flow
-15.8%
Cash-on-Cash Return
2.7%
Cap rate
0.8%
Rent to Value Ratio
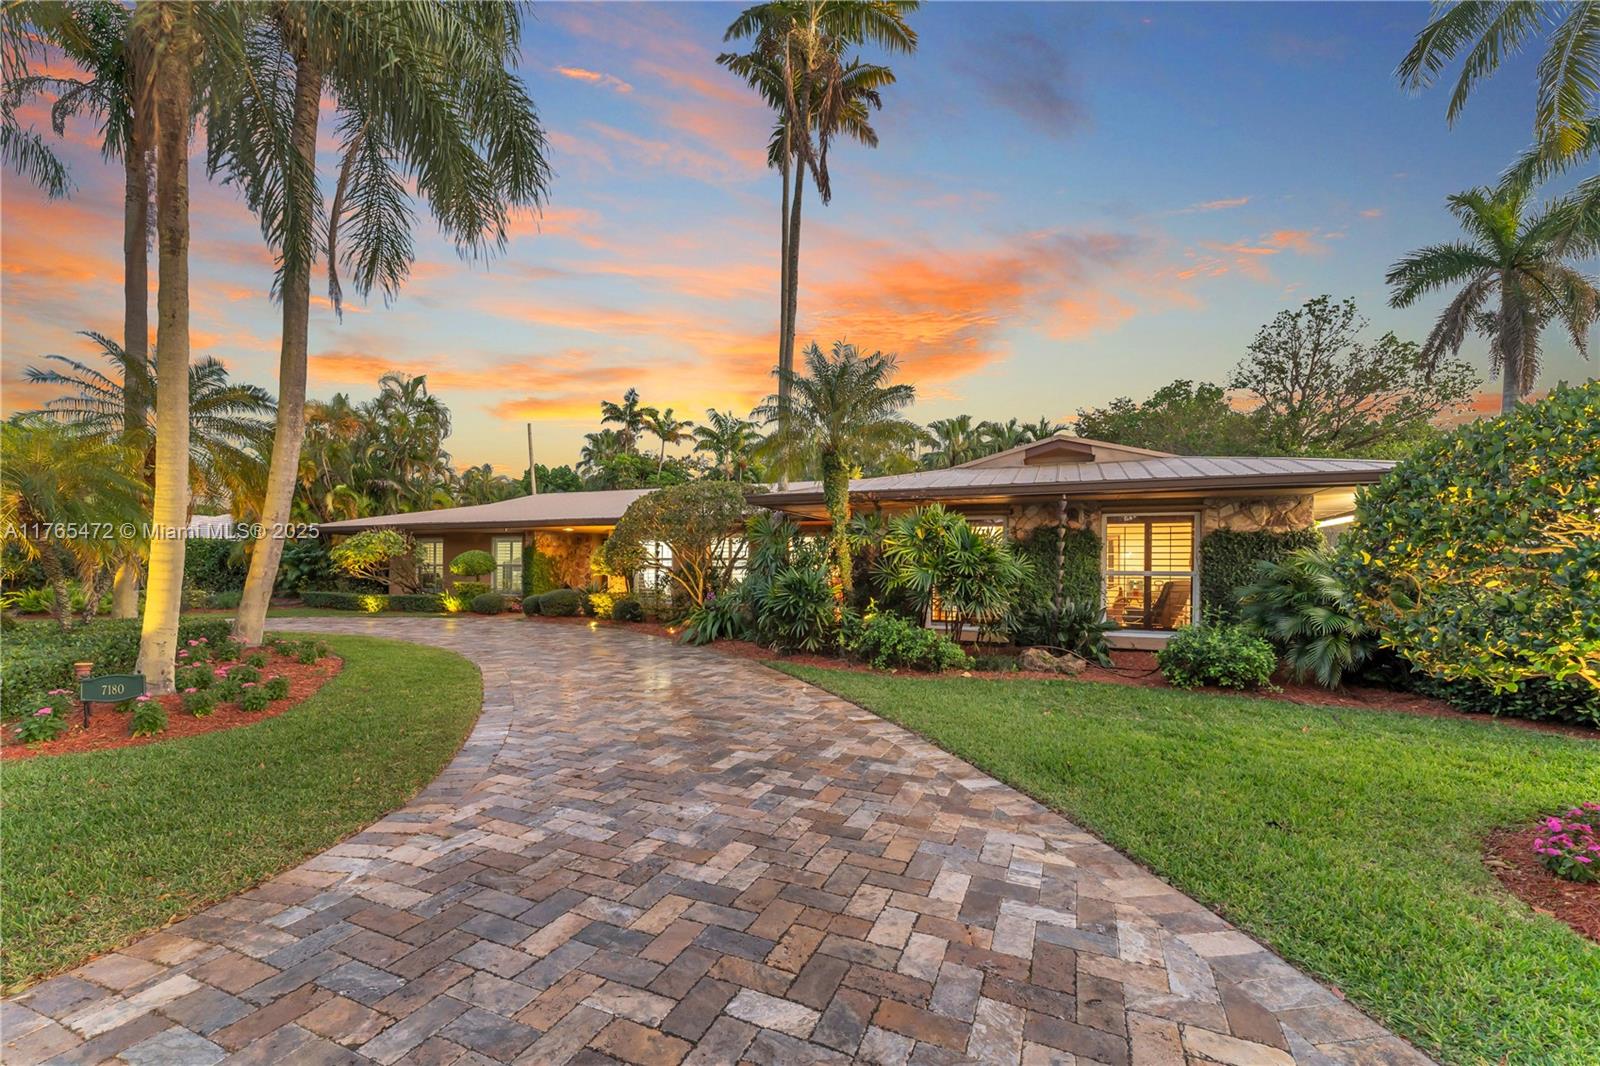
Active
$1,890,000
4
bds
|
3
ba
|
3,038
sqft
|
built
1967
7180 SW 115th Ter, Pinecrest, FL 33156
$-5,022
Cash flow
-13.9%
Cash-on-Cash Return
3.1%
Cap rate
0.4%
Rent to Value Ratio
Active
$329,000
2
bds
|
2
ba
|
900
sqft
|
built
1966
6709 N Kendall Dr, Pinecrest, FL 33156
$-1,132
Cash flow
-18.0%
Cash-on-Cash Return
2.2%
Cap rate
0.8%
Rent to Value Ratio
Active
$1,899,000
5
bds
|
2
ba
|
2,482
sqft
|
built
1968
7125 SW 120th St, Pinecrest, FL 33156
$-4,559
Cash flow
-12.5%
Cash-on-Cash Return
3.4%
Cap rate
0.5%
Rent to Value Ratio

Active
$4,250,000
6
bds
|
4
ba
|
5,132
sqft
|
built
1955
11850 SW 69th Ave, Pinecrest, FL 33156
$-19,415
Cash flow
-23.8%
Cash-on-Cash Return
0.8%
Cap rate
0.2%
Rent to Value Ratio
Active
$1,975,000
5
bds
|
3
ba
|
3,193
sqft
|
built
1966
7365 SW 122nd St, Pinecrest, FL 33156
$-4,999
Cash flow
-13.2%
Cash-on-Cash Return
3.3%
Cap rate
0.5%
Rent to Value Ratio
Active
$4,295,000
5
bds
|
5
ba
|
5,431
sqft
|
built
1960
6205 SW 108th St, Pinecrest, FL 33156
$-19,272
Cash flow
-23.4%
Cash-on-Cash Return
0.9%
Cap rate
0.2%
Rent to Value Ratio
Active
$255,000
1
bds
|
1
ba
|
710
sqft
|
built
1966
6711 N Kendall Dr, Pinecrest, FL 33156
$-852
Cash flow
-17.4%
Cash-on-Cash Return
2.3%
Cap rate
0.8%
Rent to Value Ratio
Active
$235,000
1
bds
|
2
ba
|
904
sqft
|
built
1970
6886 N Kendall Dr, Pinecrest, FL 33156
$-706
Cash flow
-15.7%
Cash-on-Cash Return
2.7%
Cap rate
0.9%
Rent to Value Ratio
Active
$469,000
2
bds
|
2
ba
|
1,467
sqft
|
built
2006
9055 SW 73rd Ct, Pinecrest, FL 33156
$-1,391
Cash flow
-15.5%
Cash-on-Cash Return
2.8%
Cap rate
0.8%
Rent to Value Ratio
Active
$11,490,000
7
bds
|
9
ba
|
7,102
sqft
|
built
2023
6575 SW 96th St, Pinecrest, FL 33156
$-61,380
Cash flow
-27.9%
Cash-on-Cash Return
-0.1%
Cap rate
0.1%
Rent to Value Ratio
Active
$2,790,000
4
bds
|
3
ba
|
3,326
sqft
|
built
1953
6835 SW 112th St, Pinecrest, FL 33156
$-10,111
Cash flow
-18.9%
Cash-on-Cash Return
2.0%
Cap rate
0.3%
Rent to Value Ratio
Active
$1,975,000
3
bds
|
2
ba
|
1,830
sqft
|
built
1954
11600 SW 69th Ct, Pinecrest, FL 33156
$-6,586
Cash flow
-17.4%
Cash-on-Cash Return
2.3%
Cap rate
0.3%
Rent to Value Ratio
Active
$4,525,000
3
bds
|
2
ba
|
2,063
sqft
|
built
1969
6401 SW 96th St, Pinecrest, FL 33156
$-20,402
Cash flow
-23.5%
Cash-on-Cash Return
0.9%
Cap rate
0.2%
Rent to Value Ratio
Active
$1,990,000
4
bds
|
4
ba
|
3,011
sqft
|
built
2007
10155 SW 75th Pl, Pinecrest, FL 33156
$-5,029
Cash flow
-13.2%
Cash-on-Cash Return
3.3%
Cap rate
0.6%
Rent to Value Ratio
Active
$2,195,000
4
bds
|
3
ba
|
3,287
sqft
|
built
1975
13575 SW 72nd Ave, Pinecrest, FL 33156
$-6,820
Cash flow
-16.2%
Cash-on-Cash Return
2.6%
Cap rate
0.4%
Rent to Value Ratio
Active
$8,300,000
8
bds
|
9
ba
|
8,277
sqft
|
built
2004
9076 SW 59th Ct, Pinecrest, FL 33156
$-43,045
Cash flow
-27.1%
Cash-on-Cash Return
0.1%
Cap rate
0.1%
Rent to Value Ratio

Active
$2,190,000
5
bds
|
4
ba
|
3,452
sqft
|
built
1960
7360 SW 130th St, Pinecrest, FL 33156
$-7,019
Cash flow
-16.7%
Cash-on-Cash Return
2.5%
Cap rate
0.4%
Rent to Value Ratio
Active
$425,000
3
bds
|
3
ba
|
1,040
sqft
|
built
1966
6709 N Kendall Dr, Pinecrest, FL 33156
$-1,669
Cash flow
-20.5%
Cash-on-Cash Return
1.6%
Cap rate
0.7%
Rent to Value Ratio
Active
$10,500,000
8
bds
|
10
ba
|
10,150
sqft
|
built
2020
6300 Moss Ranch Rd, Pinecrest, FL 33156
$-51,720
Cash flow
-25.7%
Cash-on-Cash Return
0.4%
Cap rate
0.1%
Rent to Value Ratio
Active
$4,600,000
6
bds
|
8
ba
|
4,119
sqft
|
built
1988
7830 SW 120th St, Pinecrest, FL 33156
$-20,128
Cash flow
-22.8%
Cash-on-Cash Return
1.1%
Cap rate
0.2%
Rent to Value Ratio

Active
$365,000
1
bds
|
1
ba
|
797
sqft
|
built
2006
9066 SW 73rd Ct, Pinecrest, FL 33156
$-1,321
Cash flow
-18.9%
Cash-on-Cash Return
2.0%
Cap rate
0.6%
Rent to Value Ratio

Active
$6,250,000
5
bds
|
6
ba
|
5,032
sqft
|
built
2020
6700 SW 102nd Ter, Pinecrest, FL 33156
$-30,547
Cash flow
-25.5%
Cash-on-Cash Return
0.5%
Cap rate
0.1%
Rent to Value Ratio

Active
$2,299,000
3
bds
|
2
ba
|
1,624
sqft
|
built
1953
7801 SW 129th Ter, Pinecrest, FL 33156
$-9,627
Cash flow
-21.8%
Cash-on-Cash Return
1.3%
Cap rate
0.3%
Rent to Value Ratio

Active
$485,000
2
bds
|
2
ba
|
1,467
sqft
|
built
2006
9066 SW 73rd Ct, Pinecrest, FL 33156
$-864
Cash flow
-9.3%
Cash-on-Cash Return
4.2%
Cap rate
0.8%
Rent to Value Ratio

Active
$2,850,000
5
bds
|
5
ba
|
3,587
sqft
|
built
2008
11407 Four Fillies Rd, Pinecrest, FL 33156
$-11,333
Cash flow
-20.7%
Cash-on-Cash Return
1.5%
Cap rate
0.3%
Rent to Value Ratio