Pinecrest, FL Investment Properties for Sale
Browse homes for sale and investment properties in Pinecrest, FL. Refine your search by price, property type, or more.
Best cash flowing properties in Pinecrest, FL

Active
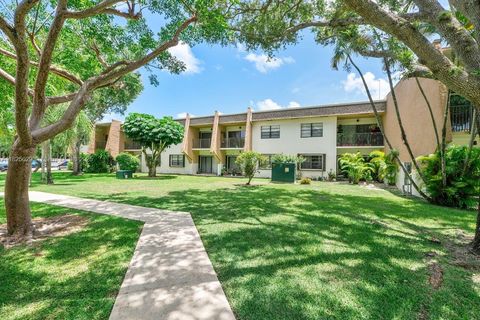
$269,000
1
bds
|
1
ba
|
672
sqft
|
built
1974
8267 SW 128th St, Pinecrest, FL 33156
$-625
Cash flow
-12.1%
Cash-on-Cash Return
3.4%
Cap rate
0.7%
Rent to Value Ratio

Active
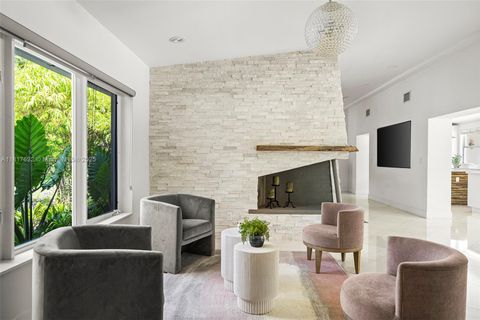
$250,000
1
bds
|
1
ba
|
578
sqft
|
built
1968
8603 SW 68th Ct, Pinecrest, FL 33156
$-693
Cash flow
-14.5%
Cash-on-Cash Return
2.8%
Cap rate
0.7%
Rent to Value Ratio
155 out of 184 properties for sale in Pinecrest, FL
Limited Results Shown
Create a free account, or log in to reveal all property listings and enjoy the complete experience.
Active
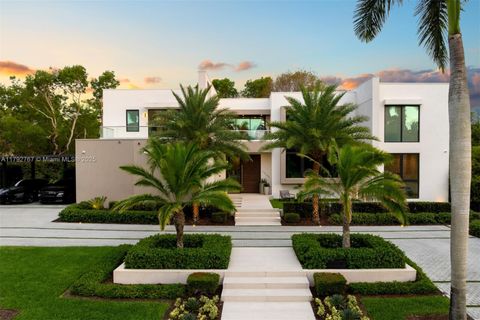
$334,500
2
bds
|
2
ba
|
792
sqft
|
built
1974
8261 SW 128th St, Pinecrest, FL 33156
$-957
Cash flow
-14.9%
Cash-on-Cash Return
2.7%
Cap rate
0.7%
Rent to Value Ratio
Active
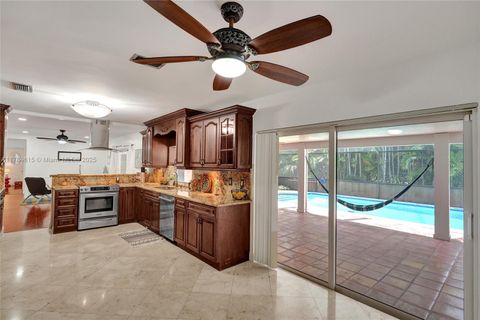
$250,000
1
bds
|
1
ba
|
578
sqft
|
built
1968
8603 SW 68th Ct, Pinecrest, FL 33156
$-693
Cash flow
-14.5%
Cash-on-Cash Return
2.8%
Cap rate
0.7%
Rent to Value Ratio

Active
$8,200,000
7
bds
|
7
ba
|
6,318
sqft
|
built
1997
8941 SW 65th Ct, Pinecrest, FL 33156
$-41,287
Cash flow
-26.3%
Cash-on-Cash Return
0.1%
Cap rate
0.1%
Rent to Value Ratio

Active
$2,399,000
5
bds
|
3
ba
|
3,694
sqft
|
built
1971
11000 SW 75th Ct, Pinecrest, FL 33156
$-7,239
Cash flow
-15.7%
Cash-on-Cash Return
2.5%
Cap rate
0.4%
Rent to Value Ratio

Active
$2,249,000
4
bds
|
3
ba
|
3,195
sqft
|
built
1963
11900 SW 72nd Pl, Pinecrest, FL 33156
$-6,481
Cash flow
-15.0%
Cash-on-Cash Return
2.7%
Cap rate
0.4%
Rent to Value Ratio

Active
$385,000
1
bds
|
1
ba
|
890
sqft
|
built
2006
9055 SW 73rd Ct, Pinecrest, FL 33156
$-1,756
Cash flow
-23.8%
Cash-on-Cash Return
0.7%
Cap rate
0.8%
Rent to Value Ratio

Active
$7,395,000
9
bds
|
10
ba
|
7,357
sqft
|
built
2011
9801 SW 60th Ct, Pinecrest, FL 33156
$-35,210
Cash flow
-24.8%
Cash-on-Cash Return
0.4%
Cap rate
0.2%
Rent to Value Ratio

Active
$270,000
1
bds
|
1
ba
|
710
sqft
|
built
1966
6711 N Kendall Dr, Pinecrest, FL 33156
$-1,064
Cash flow
-20.6%
Cash-on-Cash Return
1.4%
Cap rate
0.7%
Rent to Value Ratio
Active
$3,795,000
5
bds
|
4
ba
|
4,562
sqft
|
built
1955
11001 SW 64th Ave, Pinecrest, FL 33156
$-16,142
Cash flow
-22.2%
Cash-on-Cash Return
1.0%
Cap rate
0.3%
Rent to Value Ratio

Active
$11,995,000
8
bds
|
10
ba
|
0
sqft
|
built
2025
6730 SW 115th St, Pinecrest, FL 33156
$-58,285
Cash flow
-25.4%
Cash-on-Cash Return
0.3%
Cap rate
0.1%
Rent to Value Ratio

Active
$2,695,000
5
bds
|
4
ba
|
4,063
sqft
|
built
1964
7505 SW 129th St, Pinecrest, FL 33156
$-7,201
Cash flow
-13.9%
Cash-on-Cash Return
2.9%
Cap rate
0.4%
Rent to Value Ratio

Active
$1,500,000
4
bds
|
3
ba
|
2,408
sqft
|
built
1960
12305 SW 73rd Ave, Pinecrest, FL 33156
$-4,889
Cash flow
-17.0%
Cash-on-Cash Return
2.2%
Cap rate
0.4%
Rent to Value Ratio

Active
$6,999,000
9
bds
|
9
ba
|
9,651
sqft
|
built
2006
9500 SW 62nd Ct, Pinecrest, FL 33156
$-33,030
Cash flow
-24.6%
Cash-on-Cash Return
0.5%
Cap rate
0.2%
Rent to Value Ratio

Active
$11,495,000
5
bds
|
8
ba
|
10,178
sqft
|
built
2019
9505 SW 63rd Ct, Pinecrest, FL 33156
$-64,180
Cash flow
-29.1%
Cash-on-Cash Return
-0.6%
Cap rate
0.1%
Rent to Value Ratio

Active
$2,375,000
4
bds
|
3
ba
|
3,152
sqft
|
built
1959
7160 SW 124th St, Pinecrest, FL 33156
$-6,532
Cash flow
-14.3%
Cash-on-Cash Return
2.8%
Cap rate
0.5%
Rent to Value Ratio

Active
$2,450,000
5
bds
|
3
ba
|
3,072
sqft
|
built
1980
5990 SW 135th Ter, Pinecrest, FL 33156
$-7,376
Cash flow
-15.7%
Cash-on-Cash Return
2.5%
Cap rate
0.4%
Rent to Value Ratio

Active
$2,498,000
4
bds
|
4
ba
|
4,184
sqft
|
built
1985
13505 SW 83rd Ct, Pinecrest, FL 33156
$-7,735
Cash flow
-16.2%
Cash-on-Cash Return
2.4%
Cap rate
0.4%
Rent to Value Ratio

Active
$340,000
2
bds
|
2
ba
|
1,056
sqft
|
built
1970
6890 N Kendall Dr, Pinecrest, FL 33156
$-1,402
Cash flow
-21.5%
Cash-on-Cash Return
1.2%
Cap rate
0.6%
Rent to Value Ratio

Active
$2,614,000
5
bds
|
4
ba
|
0
sqft
|
built
1967
13000 SW 69th Ct, Pinecrest, FL 33156
$-8,117
Cash flow
-16.2%
Cash-on-Cash Return
2.4%
Cap rate
0.4%
Rent to Value Ratio

Active
$1,999,997
4
bds
|
3
ba
|
2,720
sqft
|
built
1969
7625 SW 108th Ter, Pinecrest, FL 33156
$-5,866
Cash flow
-15.3%
Cash-on-Cash Return
2.6%
Cap rate
0.4%
Rent to Value Ratio

Active
$570,000
2
bds
|
2
ba
|
1,429
sqft
|
built
2006
9066 SW 73rd Ct, Pinecrest, FL 33156
$-2,686
Cash flow
-24.6%
Cash-on-Cash Return
0.5%
Cap rate
0.6%
Rent to Value Ratio

Active
$385,000
2
bds
|
2
ba
|
982
sqft
|
built
1970
6886 N Kendall Dr, Pinecrest, FL 33156
$-969
Cash flow
-13.1%
Cash-on-Cash Return
3.1%
Cap rate
0.7%
Rent to Value Ratio

Active
$3,599,000
6
bds
|
6
ba
|
4,825
sqft
|
built
1968
6540 SW 135th Ter, Pinecrest, FL 33156
$-14,175
Cash flow
-20.5%
Cash-on-Cash Return
1.4%
Cap rate
0.3%
Rent to Value Ratio

Active
$355,000
1
bds
|
1
ba
|
657
sqft
|
built
2006
9066 SW 73rd Ct, Pinecrest, FL 33156
$-1,258
Cash flow
-18.5%
Cash-on-Cash Return
1.9%
Cap rate
0.7%
Rent to Value Ratio

Active
$4,500,000
5
bds
|
5
ba
|
5,305
sqft
|
built
1997
9825 SW 63rd Ct, Pinecrest, FL 33156
$-22,695
Cash flow
-26.3%
Cash-on-Cash Return
0.1%
Cap rate
0.2%
Rent to Value Ratio

Active
$4,950,000
6
bds
|
9
ba
|
5,603
sqft
|
built
1993
9500 SW 60th Ct, Pinecrest, FL 33156
$-22,218
Cash flow
-23.4%
Cash-on-Cash Return
0.8%
Cap rate
0.2%
Rent to Value Ratio

Active
$5,195,000
6
bds
|
7
ba
|
5,500
sqft
|
built
2025
12940 SW 82nd Ct, Pinecrest, FL 33156
$-23,804
Cash flow
-23.9%
Cash-on-Cash Return
0.6%
Cap rate
0.1%
Rent to Value Ratio

Active
$2,290,000
3
bds
|
3
ba
|
2,326
sqft
|
built
1976
8700 SW 64th Ave, Pinecrest, FL 33156
$-9,782
Cash flow
-22.3%
Cash-on-Cash Return
1.0%
Cap rate
0.3%
Rent to Value Ratio

Active
$2,515,000
5
bds
|
3
ba
|
3,234
sqft
|
built
1958
6551 SW 126th St, Pinecrest, FL 33156
$-7,502
Cash flow
-15.6%
Cash-on-Cash Return
2.6%
Cap rate
0.3%
Rent to Value Ratio

Active
$2,350,000
5
bds
|
4
ba
|
2,962
sqft
|
built
2007
7220 SW 107th Ter, Pinecrest, FL 33156
$-7,009
Cash flow
-15.6%
Cash-on-Cash Return
2.6%
Cap rate
0.4%
Rent to Value Ratio

Active
$2,100,000
5
bds
|
4
ba
|
3,513
sqft
|
built
1979
7600 SW 124th St, Pinecrest, FL 33156
$-5,172
Cash flow
-12.8%
Cash-on-Cash Return
3.2%
Cap rate
0.4%
Rent to Value Ratio

Active
$3,299,000
4
bds
|
3
ba
|
2,700
sqft
|
built
1971
12300 SW 67th Ave, Pinecrest, FL 33156
$-11,681
Cash flow
-18.5%
Cash-on-Cash Return
1.9%
Cap rate
0.3%
Rent to Value Ratio

Active
$2,284,000
5
bds
|
5
ba
|
3,808
sqft
|
built
1963
12280 SW 69th Pl, Pinecrest, FL 33156
$-6,148
Cash flow
-14.0%
Cash-on-Cash Return
2.9%
Cap rate
0.4%
Rent to Value Ratio
Active
$7,000,000
6
bds
|
8
ba
|
5,842
sqft
|
built
2023
13180 Old Cutler Rd, Pinecrest, FL 33156
$-36,809
Cash flow
-27.4%
Cash-on-Cash Return
-0.2%
Cap rate
0.1%
Rent to Value Ratio

Active
$4,299,000
4
bds
|
4
ba
|
3,182
sqft
|
built
1951
6255 SW 99th Ter, Pinecrest, FL 33156
$-18,115
Cash flow
-22.0%
Cash-on-Cash Return
1.1%
Cap rate
0.2%
Rent to Value Ratio

Active
$1,399,000
4
bds
|
2
ba
|
1,904
sqft
|
built
1949
13101 SW 82nd Ave, Pinecrest, FL 33156
$-4,622
Cash flow
-17.2%
Cash-on-Cash Return
2.2%
Cap rate
0.4%
Rent to Value Ratio
Active
$269,000
1
bds
|
1
ba
|
672
sqft
|
built
1974
8267 SW 128th St, Pinecrest, FL 33156
$-625
Cash flow
-12.1%
Cash-on-Cash Return
3.4%
Cap rate
0.7%
Rent to Value Ratio

Active
$2,399,950
5
bds
|
3
ba
|
3,173
sqft
|
built
1958
6860 SW 128th St, Pinecrest, FL 33156
$-6,743
Cash flow
-14.7%
Cash-on-Cash Return
2.8%
Cap rate
0.4%
Rent to Value Ratio

Active
$1,399,000
3
bds
|
2
ba
|
2,184
sqft
|
built
1956
7920 SW 132nd St, Pinecrest, FL 33156
$-6,809
Cash flow
-25.4%
Cash-on-Cash Return
0.3%
Cap rate
0.2%
Rent to Value Ratio
Active
$1,574,999
4
bds
|
2
ba
|
2,421
sqft
|
built
1968
7360 SW 120th St, Pinecrest, FL 33156
$-3,903
Cash flow
-12.9%
Cash-on-Cash Return
3.2%
Cap rate
0.4%
Rent to Value Ratio