Pinecrest, FL Investment Properties for Sale
Browse homes for sale and investment properties in Pinecrest, FL. Refine your search by price, property type, or more.
Best cash flowing properties in Pinecrest, FL

Active
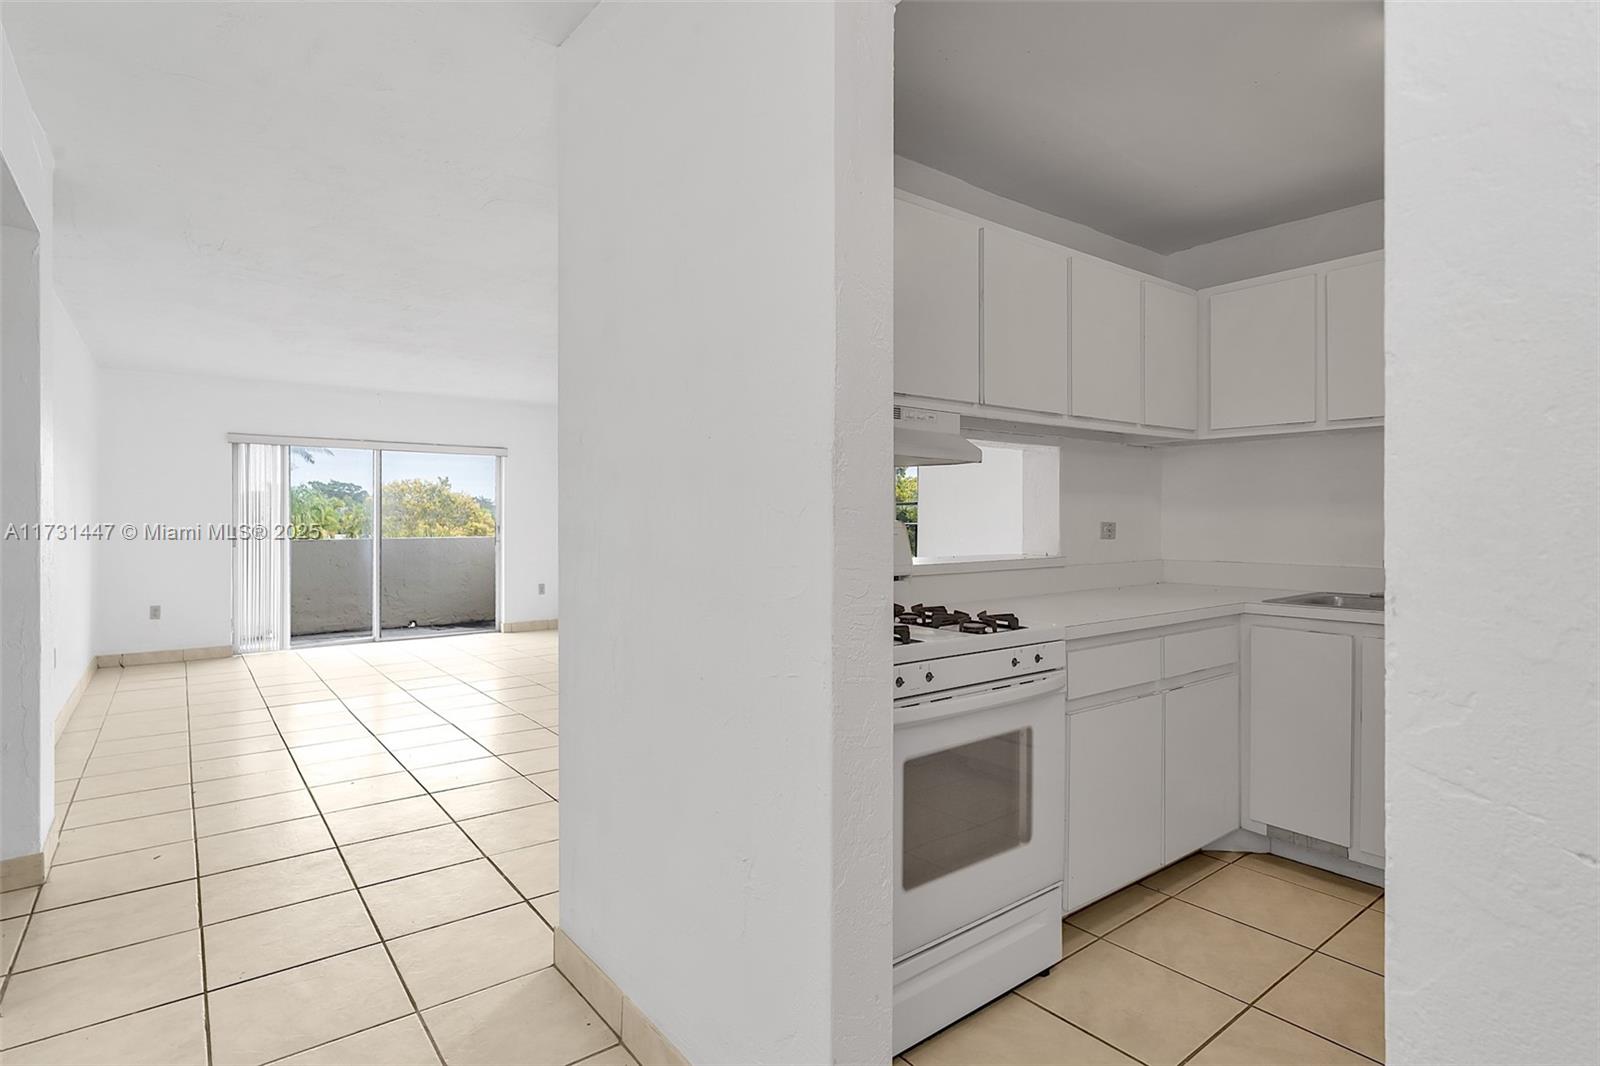
$315,000
1
bds
|
1
ba
|
657
sqft
|
built
2006
9055 SW 73rd Ct, Pinecrest, FL 33156
$-752
Cash flow
-12.5%
Cash-on-Cash Return
3.3%
Cap rate
0.9%
Rent to Value Ratio

Active
$485,000
2
bds
|
2
ba
|
1,467
sqft
|
built
2006
9066 SW 73rd Ct, Pinecrest, FL 33156
$-795
Cash flow
-8.6%
Cash-on-Cash Return
4.2%
Cap rate
0.8%
Rent to Value Ratio
166 out of 177 properties for sale in Pinecrest, FL
Limited Results Shown
Create a free account, or log in to reveal all property listings and enjoy the complete experience.

Active
$6,250,000
5
bds
|
6
ba
|
5,032
sqft
|
built
2020
6700 SW 102nd Ter, Pinecrest, FL 33156
$-29,666
Cash flow
-24.8%
Cash-on-Cash Return
0.5%
Cap rate
0.1%
Rent to Value Ratio
Active
$485,000
2
bds
|
2
ba
|
1,467
sqft
|
built
2006
9066 SW 73rd Ct, Pinecrest, FL 33156
$-795
Cash flow
-8.6%
Cash-on-Cash Return
4.2%
Cap rate
0.8%
Rent to Value Ratio

Active
$2,299,000
3
bds
|
2
ba
|
1,624
sqft
|
built
1953
7801 SW 129th Ter, Pinecrest, FL 33156
$-9,303
Cash flow
-21.1%
Cash-on-Cash Return
1.3%
Cap rate
0.3%
Rent to Value Ratio

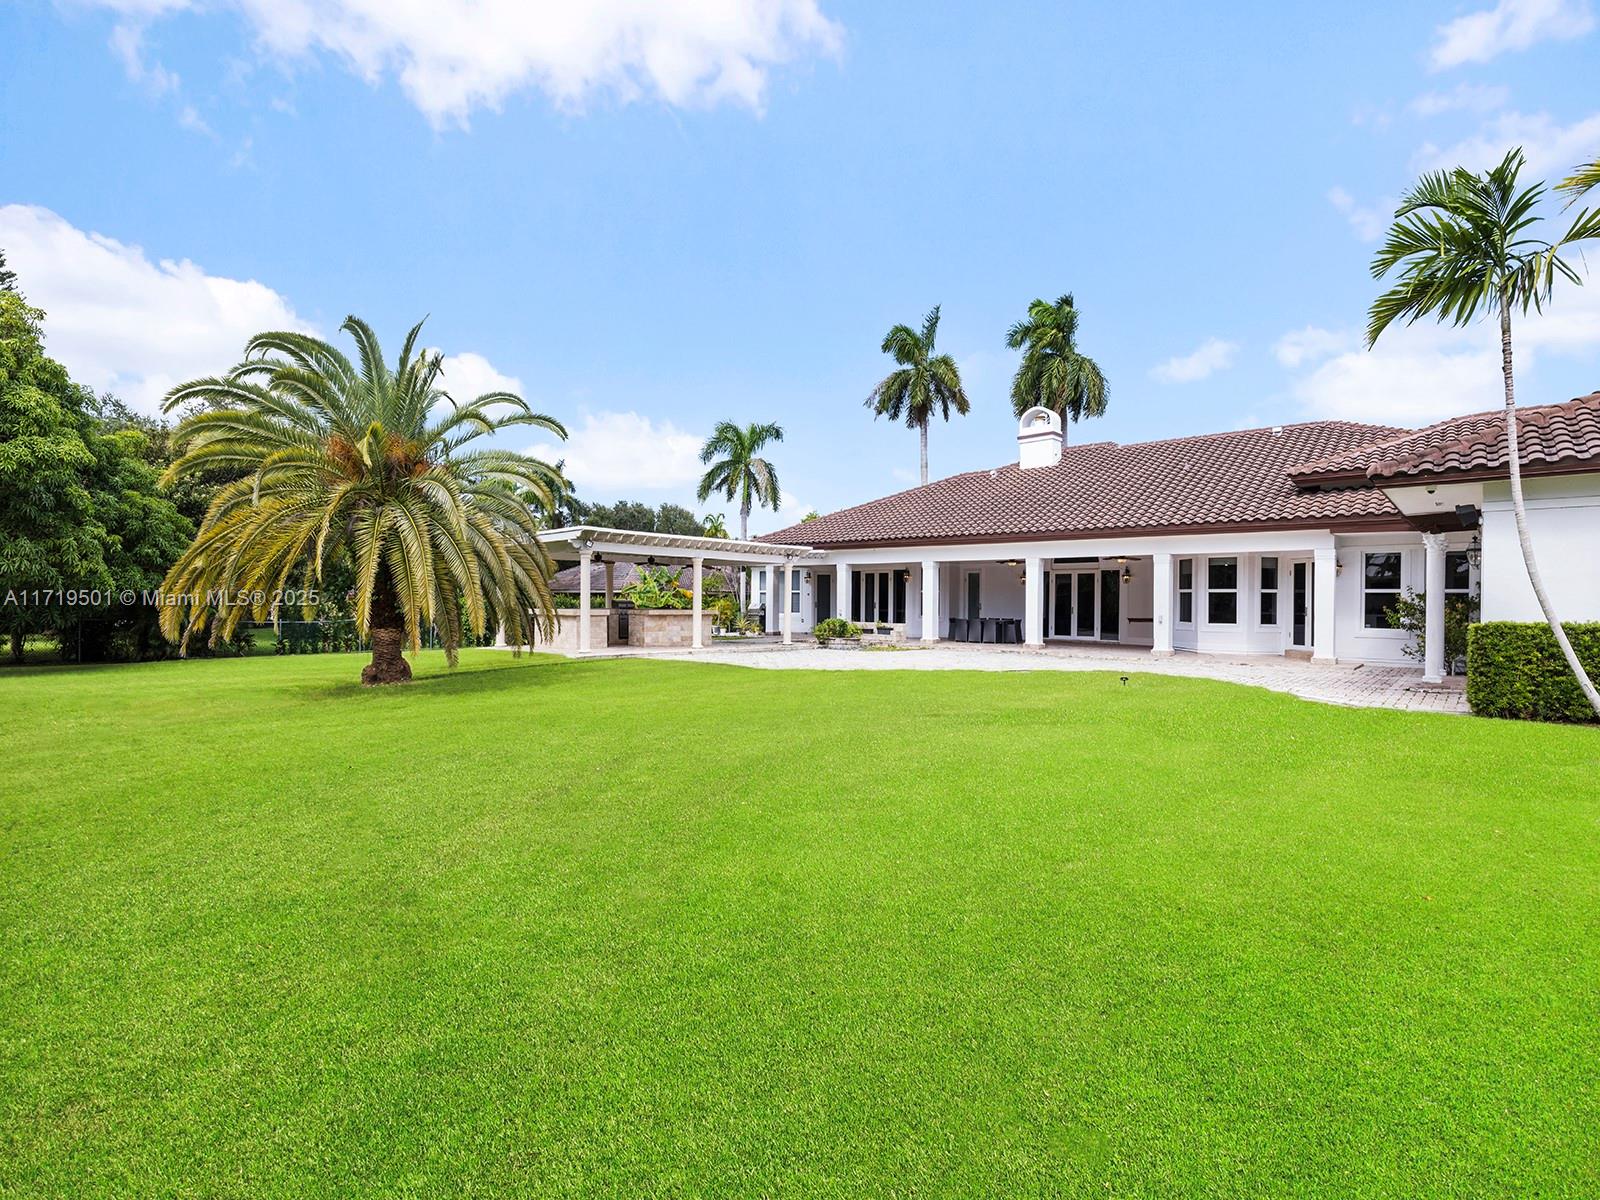
Active
$2,850,000
5
bds
|
5
ba
|
3,587
sqft
|
built
2008
11407 Four Fillies Rd, Pinecrest, FL 33156
$-10,931
Cash flow
-20.0%
Cash-on-Cash Return
1.5%
Cap rate
0.3%
Rent to Value Ratio
Active
$6,490,000
7
bds
|
9
ba
|
9,912
sqft
|
built
2014
7480 SW 100th St, Pinecrest, FL 33156
$-30,990
Cash flow
-24.9%
Cash-on-Cash Return
0.4%
Cap rate
0.2%
Rent to Value Ratio
Active
$310,000
1
bds
|
1
ba
|
670
sqft
|
built
2006
9055 SW 73rd Ct, Pinecrest, FL 33156
$-963
Cash flow
-16.2%
Cash-on-Cash Return
2.4%
Cap rate
0.8%
Rent to Value Ratio
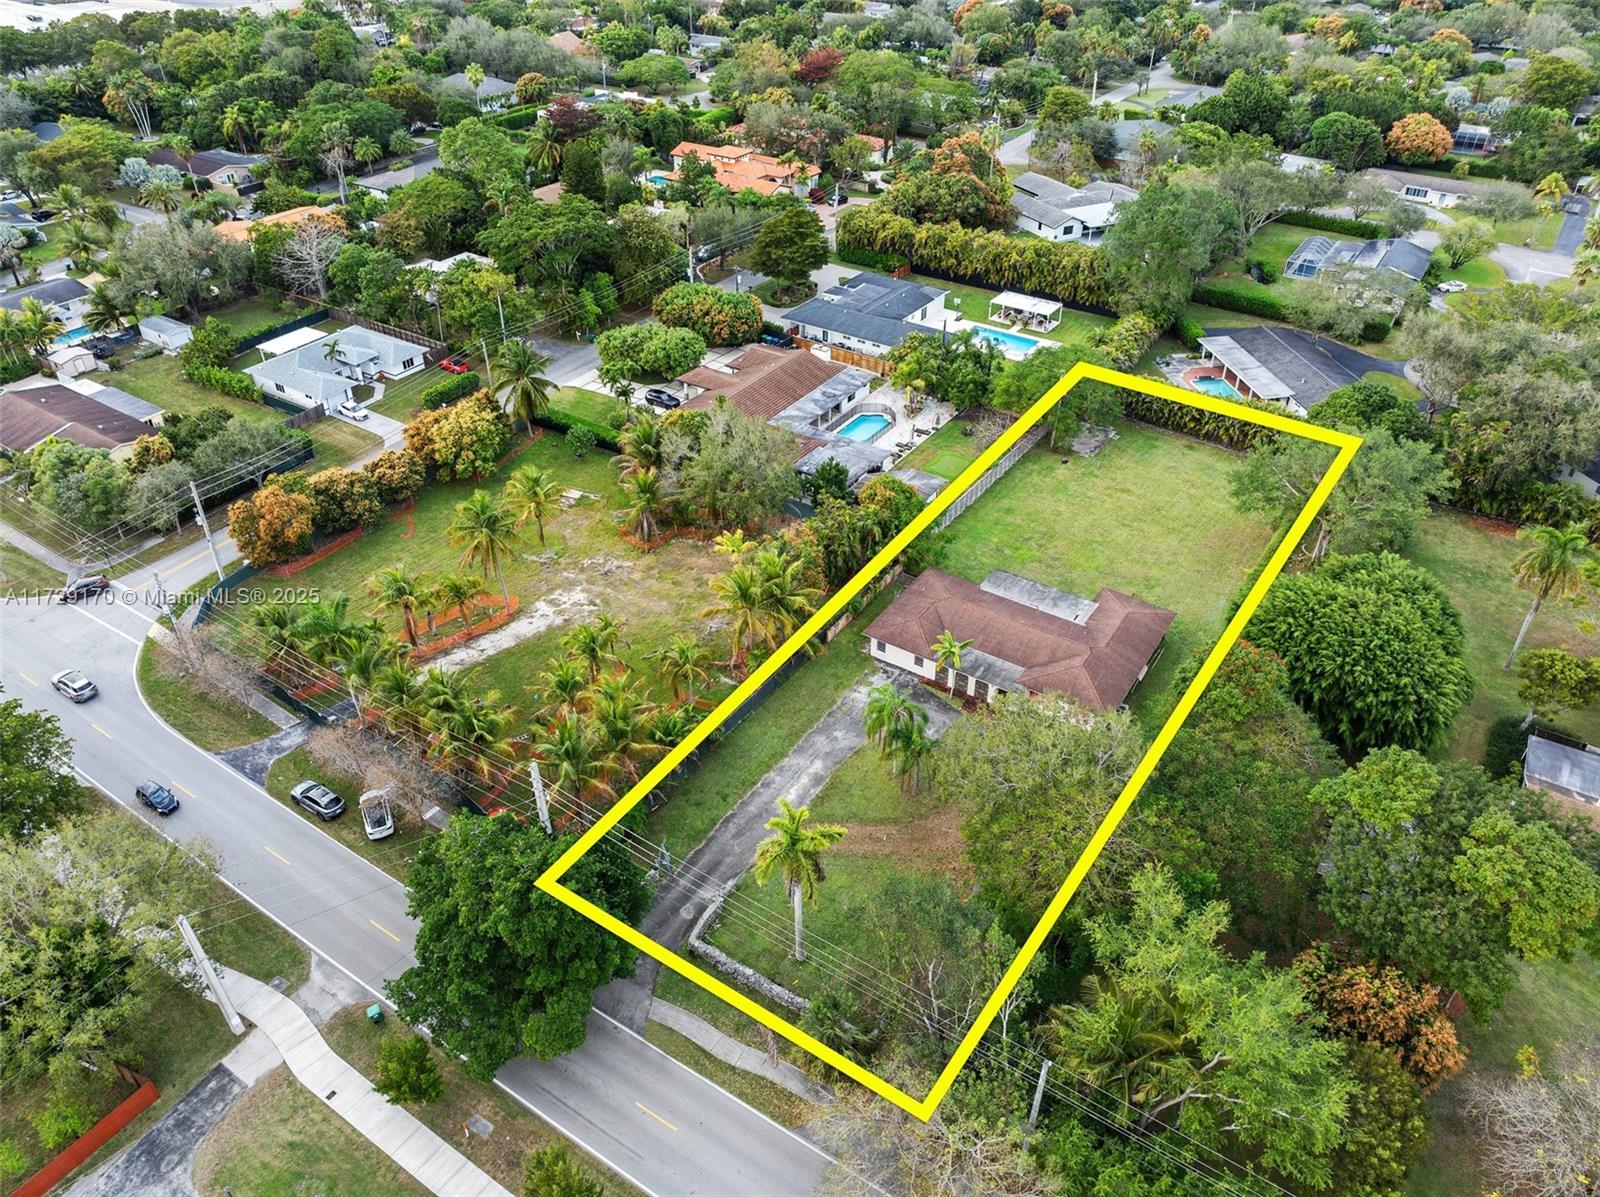
Active
$2,395,000
5
bds
|
3
ba
|
3,203
sqft
|
built
1967
13060 SW 70th Ave, Pinecrest, FL 33156
$-7,701
Cash flow
-16.8%
Cash-on-Cash Return
2.3%
Cap rate
0.4%
Rent to Value Ratio

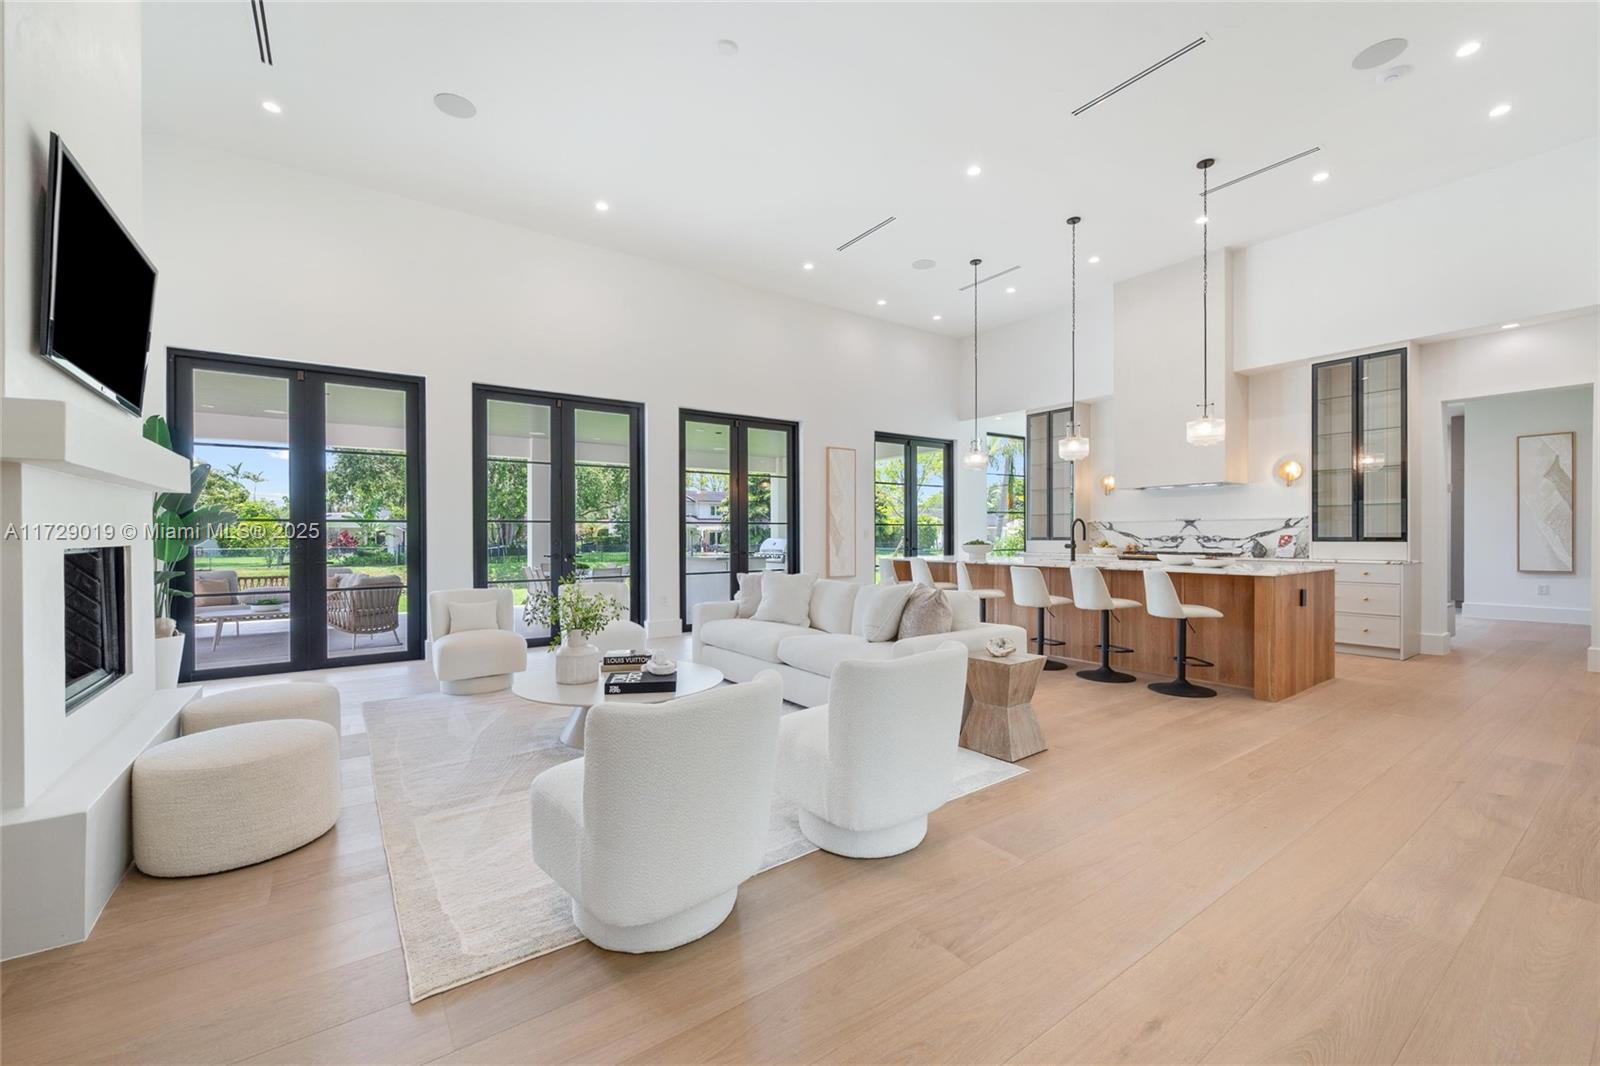
Active
$3,990,000
7
bds
|
5
ba
|
5,452
sqft
|
built
1976
13551 SW 62nd Ave, Pinecrest, FL 33156
$-15,780
Cash flow
-20.6%
Cash-on-Cash Return
1.4%
Cap rate
0.2%
Rent to Value Ratio
Active
$355,000
1
bds
|
1
ba
|
657
sqft
|
built
2006
9066 SW 73rd Ct, Pinecrest, FL 33156
$-1,267
Cash flow
-18.6%
Cash-on-Cash Return
1.9%
Cap rate
0.7%
Rent to Value Ratio

Active
$9,250,000
6
bds
|
7
ba
|
6,970
sqft
|
built
2015
6080 SW 88th St, Pinecrest, FL 33156
$-47,023
Cash flow
-26.5%
Cash-on-Cash Return
0.0%
Cap rate
0.1%
Rent to Value Ratio

Active
$6,950,000
7
bds
|
7
ba
|
7,865
sqft
|
built
2007
9601 SW 60th Ave, Pinecrest, FL 33156
$-38,529
Cash flow
-28.9%
Cash-on-Cash Return
-0.5%
Cap rate
0.1%
Rent to Value Ratio

Active
$4,200,000
5
bds
|
5
ba
|
4,452
sqft
|
built
1953
6784 SW 97th St, Pinecrest, FL 33156
$-19,872
Cash flow
-24.7%
Cash-on-Cash Return
0.5%
Cap rate
0.2%
Rent to Value Ratio
Active
$2,130,000
5
bds
|
5
ba
|
3,650
sqft
|
built
1957
7420 SW 125th St, Pinecrest, FL 33156
$-6,057
Cash flow
-14.8%
Cash-on-Cash Return
2.7%
Cap rate
0.5%
Rent to Value Ratio
Active
$3,790,000
5
bds
|
7
ba
|
5,019
sqft
|
built
1958
6220 SW 123rd Ter, Pinecrest, FL 33156
$-16,638
Cash flow
-22.9%
Cash-on-Cash Return
0.9%
Cap rate
0.2%
Rent to Value Ratio
Active
$1,799,000
4
bds
|
3
ba
|
2,382
sqft
|
built
1966
7405 SW 132nd St, Pinecrest, FL 33156
$-4,521
Cash flow
-13.1%
Cash-on-Cash Return
3.1%
Cap rate
0.5%
Rent to Value Ratio
Active
$21,750,000
10
bds
|
12
ba
|
20,182
sqft
|
built
2023
6555 SW 102nd St, Pinecrest, FL 33156
$-119,837
Cash flow
-28.7%
Cash-on-Cash Return
-0.5%
Cap rate
0.1%
Rent to Value Ratio
Active
$3,250,000
4
bds
|
4
ba
|
3,931
sqft
|
built
1957
6700 SW 115th St, Pinecrest, FL 33156
$-13,925
Cash flow
-22.4%
Cash-on-Cash Return
1.0%
Cap rate
0.3%
Rent to Value Ratio
Active
$8,750,000
5
bds
|
7
ba
|
6,091
sqft
|
built
2020
6240 SW 116th St, Pinecrest, FL 33156
$-45,638
Cash flow
-27.2%
Cash-on-Cash Return
-0.1%
Cap rate
0.1%
Rent to Value Ratio
Active
$1,175,000
4
bds
|
4
ba
|
2,226
sqft
|
built
2003
7584 SW 102nd St, Pinecrest, FL 33156
$-4,894
Cash flow
-21.7%
Cash-on-Cash Return
1.1%
Cap rate
0.5%
Rent to Value Ratio
Active
$2,980,000
4
bds
|
4
ba
|
3,719
sqft
|
built
1956
6200 SW 112th St, Pinecrest, FL 33156
$-9,274
Cash flow
-16.2%
Cash-on-Cash Return
2.4%
Cap rate
0.3%
Rent to Value Ratio

Active
$9,950,000
6
bds
|
9
ba
|
7,709
sqft
|
built
2013
8955 SW 63rd Ct, Pinecrest, FL 33156
$-50,319
Cash flow
-26.4%
Cash-on-Cash Return
0.1%
Cap rate
0.1%
Rent to Value Ratio

Active
$9,949,000
7
bds
|
9
ba
|
8,551
sqft
|
built
2012
6080 SW 104th St, Pinecrest, FL 33156
$-49,926
Cash flow
-26.2%
Cash-on-Cash Return
0.1%
Cap rate
0.1%
Rent to Value Ratio
Active
$4,275,000
7
bds
|
6
ba
|
6,014
sqft
|
built
1988
5981 SW 136th St, Pinecrest, FL 33156
$-17,337
Cash flow
-21.2%
Cash-on-Cash Return
1.3%
Cap rate
0.2%
Rent to Value Ratio

Active
$419,000
3
bds
|
3
ba
|
1,290
sqft
|
built
1966
8650 SW 67th Ave, Pinecrest, FL 33156
$-1,433
Cash flow
-17.8%
Cash-on-Cash Return
2.0%
Cap rate
0.7%
Rent to Value Ratio

Active
$2,800,000
4
bds
|
4
ba
|
2,917
sqft
|
built
1956
6000 Chapman Field Dr, Pinecrest, FL 33156
$-8,058
Cash flow
-15.0%
Cash-on-Cash Return
2.7%
Cap rate
0.4%
Rent to Value Ratio
Active
$315,000
1
bds
|
1
ba
|
657
sqft
|
built
2006
9055 SW 73rd Ct, Pinecrest, FL 33156
$-752
Cash flow
-12.5%
Cash-on-Cash Return
3.3%
Cap rate
0.9%
Rent to Value Ratio
Active
$8,500,000
7
bds
|
8
ba
|
6,898
sqft
|
built
2022
6830 SW 104th St, Pinecrest, FL 33156
$-45,649
Cash flow
-28.0%
Cash-on-Cash Return
-0.3%
Cap rate
0.1%
Rent to Value Ratio
Active
$7,995,000
6
bds
|
7
ba
|
6,530
sqft
|
built
2020
6175 SW 128th St, Pinecrest, FL 33156
$-42,673
Cash flow
-27.8%
Cash-on-Cash Return
-0.3%
Cap rate
0.1%
Rent to Value Ratio
Active
$5,500,000
7
bds
|
8
ba
|
6,848
sqft
|
built
2007
6650 SW 123rd St, Pinecrest, FL 33156
$-23,664
Cash flow
-22.4%
Cash-on-Cash Return
1.0%
Cap rate
0.2%
Rent to Value Ratio
Active
$469,000
2
bds
|
2
ba
|
1,350
sqft
|
built
2006
9055 SW 73rd Ct, Pinecrest, FL 33156
$-1,866
Cash flow
-20.8%
Cash-on-Cash Return
1.4%
Cap rate
0.7%
Rent to Value Ratio
Active
$4,950,000
6
bds
|
7
ba
|
5,947
sqft
|
built
2005
11191 SW 60th Ave, Pinecrest, FL 33156
$-21,039
Cash flow
-22.2%
Cash-on-Cash Return
1.0%
Cap rate
0.2%
Rent to Value Ratio
Active
$1,890,000
4
bds
|
3
ba
|
2,546
sqft
|
built
2019
7620 SW 105th Ter, Pinecrest, FL 33156
$-3,734
Cash flow
-10.3%
Cash-on-Cash Return
3.8%
Cap rate
0.5%
Rent to Value Ratio
Active
$325,000
2
bds
|
2
ba
|
865
sqft
|
built
1974
8267 SW 128th St, Pinecrest, FL 33156
$-948
Cash flow
-15.2%
Cash-on-Cash Return
2.6%
Cap rate
0.7%
Rent to Value Ratio
Active
$249,500
2
bds
|
2
ba
|
1,056
sqft
|
built
1970
6884 N Kendall Dr, Pinecrest, FL 33156
$-942
Cash flow
-19.7%
Cash-on-Cash Return
1.6%
Cap rate
0.9%
Rent to Value Ratio
Active
$4,975,000
6
bds
|
6
ba
|
4,842
sqft
|
built
1995
5770 SW 114th Ter, Pinecrest, FL 33156
$-23,876
Cash flow
-25.0%
Cash-on-Cash Return
0.4%
Cap rate
0.2%
Rent to Value Ratio

Active
$3,550,000
5
bds
|
5
ba
|
3,430
sqft
|
built
2007
7780 SW 110th St, Pinecrest, FL 33156
$-12,973
Cash flow
-19.1%
Cash-on-Cash Return
1.8%
Cap rate
0.3%
Rent to Value Ratio
Active
$1,800,000
4
bds
|
2
ba
|
2,624
sqft
|
built
1973
8251 SW 136th St, Pinecrest, FL 33156
$-5,485
Cash flow
-15.9%
Cash-on-Cash Return
2.5%
Cap rate
0.4%
Rent to Value Ratio
Active
$5,295,000
5
bds
|
7
ba
|
4,676
sqft
|
built
2025
11001 SW 74th Ct, Pinecrest, FL 33156
$-22,949
Cash flow
-22.6%
Cash-on-Cash Return
0.9%
Cap rate
0.2%
Rent to Value Ratio

Active
$570,000
2
bds
|
2
ba
|
1,467
sqft
|
built
2006
9055 SW 73rd Ct, Pinecrest, FL 33156
$-2,856
Cash flow
-26.1%
Cash-on-Cash Return
0.1%
Cap rate
0.6%
Rent to Value Ratio
Active
$7,200,000
6
bds
|
7
ba
|
7,536
sqft
|
built
2007
12500 Vista Ln, Pinecrest, FL 33156
$-32,325
Cash flow
-23.4%
Cash-on-Cash Return
0.8%
Cap rate
0.2%
Rent to Value Ratio