Pinecrest, FL Investment Properties for Sale
Browse homes for sale and investment properties in Pinecrest, FL. Refine your search by price, property type, or more.
Best cash flowing properties in Pinecrest, FL
Active
$260,000
1
bds
|
2
ba
|
740
sqft
|
built
1966
8600 SW 67th Ave, Pinecrest, FL 33156
$-760
Cash flow
-15.3%
Cash-on-Cash Return
2.6%
Cap rate
0.8%
Rent to Value Ratio
Active
$329,000
1
bds
|
2
ba
|
740
sqft
|
built
1966
8600 SW 67th Ave, Pinecrest, FL 33156
$-1,059
Cash flow
-16.8%
Cash-on-Cash Return
2.3%
Cap rate
0.7%
Rent to Value Ratio
163 out of 174 properties for sale in Pinecrest, FL
Limited Results Shown
Create a free account, or log in to reveal all property listings and enjoy the complete experience.

Active
$6,900,000
6
bds
|
6
ba
|
6,353
sqft
|
built
1999
11200 SW 60th Ave, Pinecrest, FL 33156
$-36,627
Cash flow
-27.7%
Cash-on-Cash Return
-0.2%
Cap rate
0.1%
Rent to Value Ratio
Active
$8,400,000
9
bds
|
8
ba
|
8,433
sqft
|
built
2007
9940 W Suburban Dr, Pinecrest, FL 33156
$-39,897
Cash flow
-24.8%
Cash-on-Cash Return
0.4%
Cap rate
0.1%
Rent to Value Ratio

Active
$399,000
1
bds
|
1
ba
|
957
sqft
|
built
2006
9055 SW 73rd Ct, Pinecrest, FL 33156
$-1,117
Cash flow
-14.6%
Cash-on-Cash Return
2.8%
Cap rate
0.8%
Rent to Value Ratio
Active
$4,625,000
6
bds
|
8
ba
|
6,514
sqft
|
built
2005
5950 SW 111th St, Pinecrest, FL 33156
$-20,512
Cash flow
-23.1%
Cash-on-Cash Return
0.8%
Cap rate
0.2%
Rent to Value Ratio
Active
$2,075,000
4
bds
|
3
ba
|
2,783
sqft
|
built
1997
13550 SW 82nd Ave, Pinecrest, FL 33156
$-5,343
Cash flow
-13.4%
Cash-on-Cash Return
3.1%
Cap rate
0.5%
Rent to Value Ratio
Active
$4,695,000
5
bds
|
5
ba
|
5,039
sqft
|
built
1982
6424 SW 109th St, Pinecrest, FL 33156
$-19,835
Cash flow
-22.0%
Cash-on-Cash Return
1.1%
Cap rate
0.2%
Rent to Value Ratio
Active
$329,000
1
bds
|
2
ba
|
740
sqft
|
built
1966
8600 SW 67th Ave, Pinecrest, FL 33156
$-1,059
Cash flow
-16.8%
Cash-on-Cash Return
2.3%
Cap rate
0.7%
Rent to Value Ratio
Active
$8,400,000
7
bds
|
10
ba
|
7,708
sqft
|
built
2021
6301 SW 114th St, Pinecrest, FL 33156
$-43,211
Cash flow
-26.8%
Cash-on-Cash Return
0.0%
Cap rate
0.1%
Rent to Value Ratio

Active
$3,699,000
5
bds
|
5
ba
|
4,030
sqft
|
built
2011
9601 SW 68th Ave, Pinecrest, FL 33156
$-12,988
Cash flow
-18.3%
Cash-on-Cash Return
1.9%
Cap rate
0.3%
Rent to Value Ratio

Active
$1,600,000
4
bds
|
2
ba
|
2,080
sqft
|
built
1953
12725 SW 80th Ave, Pinecrest, FL 33156
$-4,204
Cash flow
-13.7%
Cash-on-Cash Return
3.0%
Cap rate
0.4%
Rent to Value Ratio
Active
$1,825,000
4
bds
|
4
ba
|
2,539
sqft
|
built
1958
9801 SW 73rd Ct, Pinecrest, FL 33156
$-4,068
Cash flow
-11.6%
Cash-on-Cash Return
3.5%
Cap rate
0.6%
Rent to Value Ratio
Active
$2,779,000
6
bds
|
4
ba
|
4,282
sqft
|
built
1997
6065 SW 133rd St, Pinecrest, FL 33156
$-8,800
Cash flow
-16.5%
Cash-on-Cash Return
2.3%
Cap rate
0.3%
Rent to Value Ratio
Active
$6,500,000
5
bds
|
6
ba
|
4,036
sqft
|
built
1948
13401 SW 83rd Ave, Pinecrest, FL 33156
$-27,227
Cash flow
-21.9%
Cash-on-Cash Return
1.1%
Cap rate
0.2%
Rent to Value Ratio
Active
$1,950,000
4
bds
|
4
ba
|
3,346
sqft
|
built
1957
12525 SW 68th Ct, Pinecrest, FL 33156
$-4,595
Cash flow
-12.3%
Cash-on-Cash Return
3.3%
Cap rate
0.6%
Rent to Value Ratio
Active
$7,150,000
6
bds
|
8
ba
|
7,923
sqft
|
built
1994
10001 SW 60th Ct, Pinecrest, FL 33156
$-34,060
Cash flow
-24.9%
Cash-on-Cash Return
0.4%
Cap rate
0.1%
Rent to Value Ratio
Active
$3,650,000
5
bds
|
5
ba
|
0
sqft
|
built
1960
7530 SW 134th St, Pinecrest, FL 33156
$-13,012
Cash flow
-18.6%
Cash-on-Cash Return
1.9%
Cap rate
0.3%
Rent to Value Ratio
Active
$390,000
2
bds
|
2
ba
|
1,110
sqft
|
built
1970
6884 N Kendall Dr, Pinecrest, FL 33156
$-1,276
Cash flow
-17.1%
Cash-on-Cash Return
2.2%
Cap rate
0.7%
Rent to Value Ratio
Active
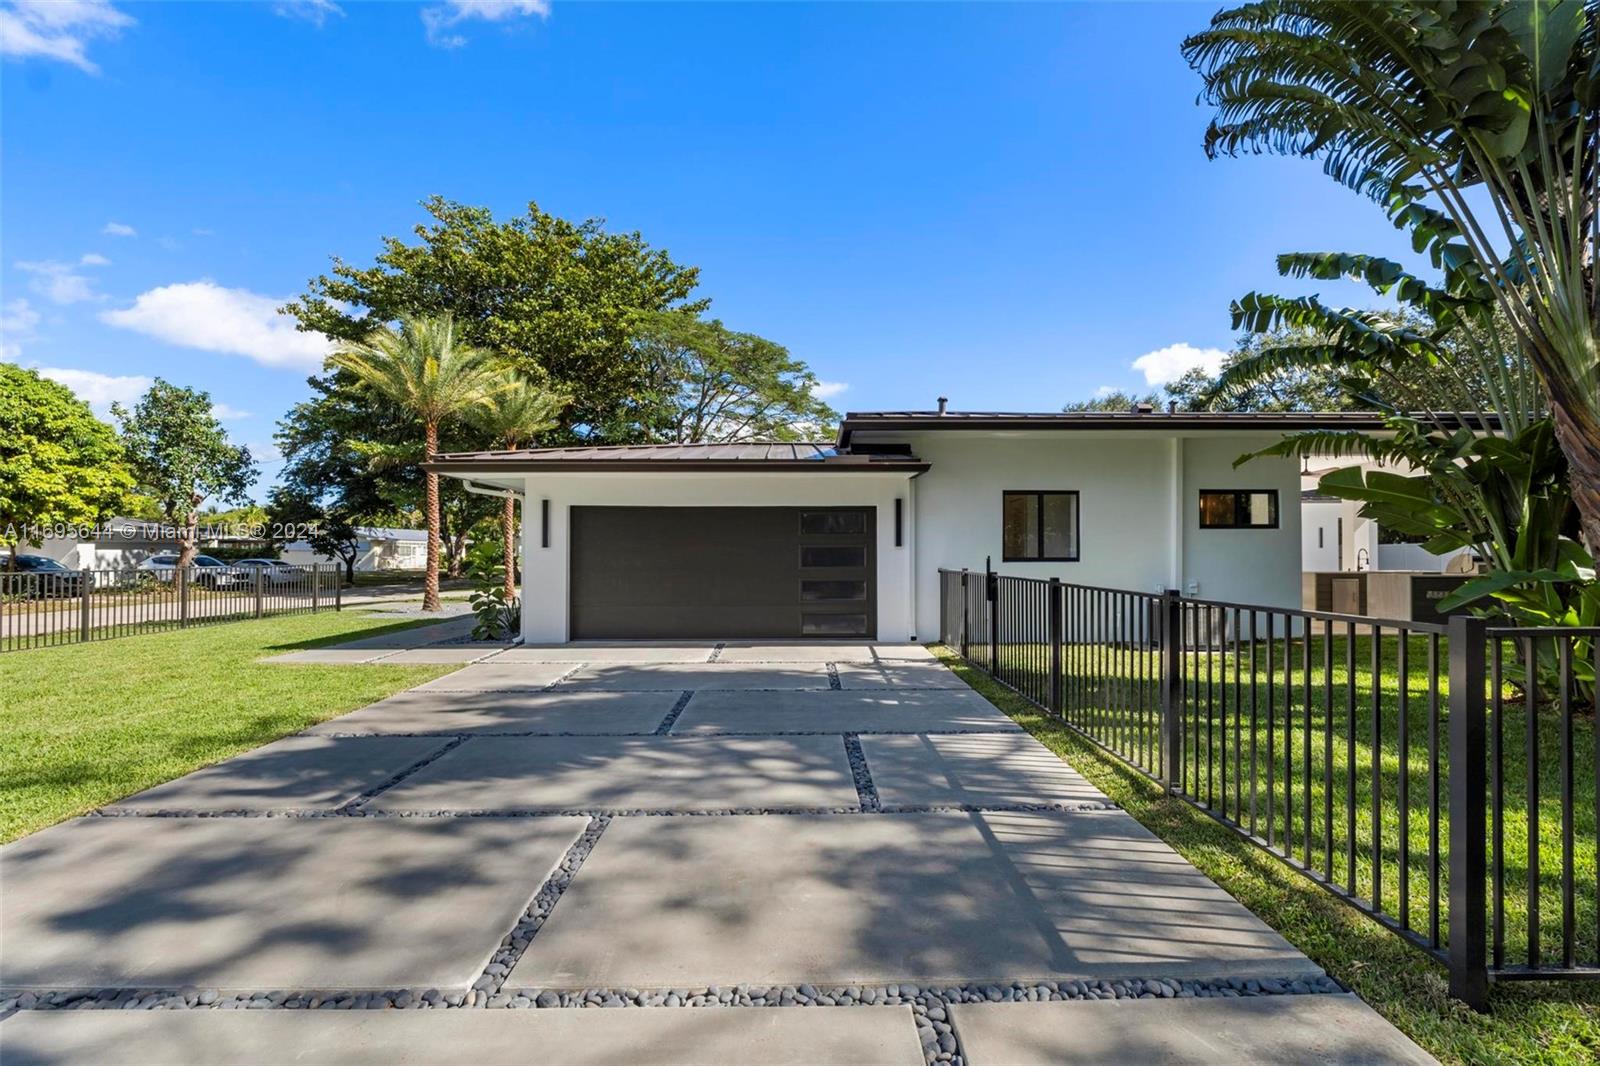
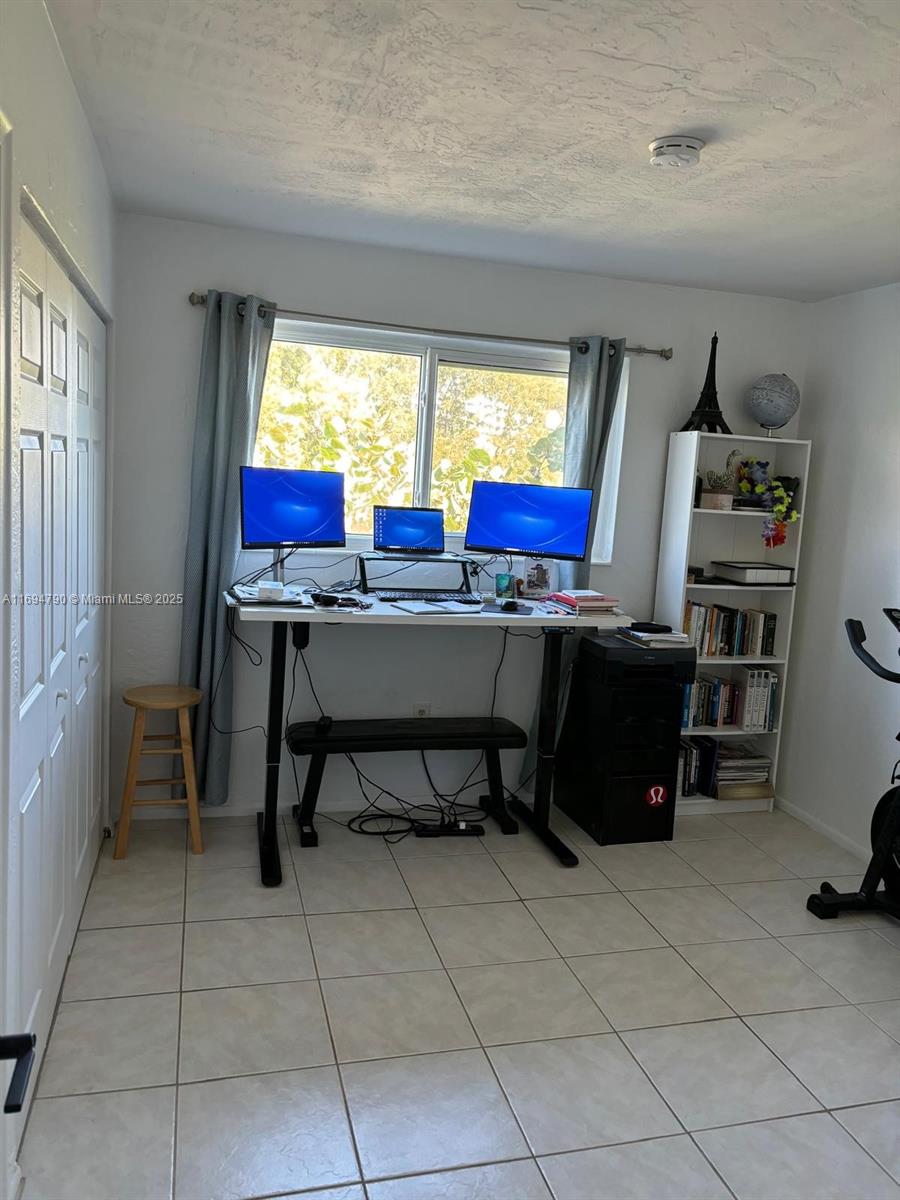
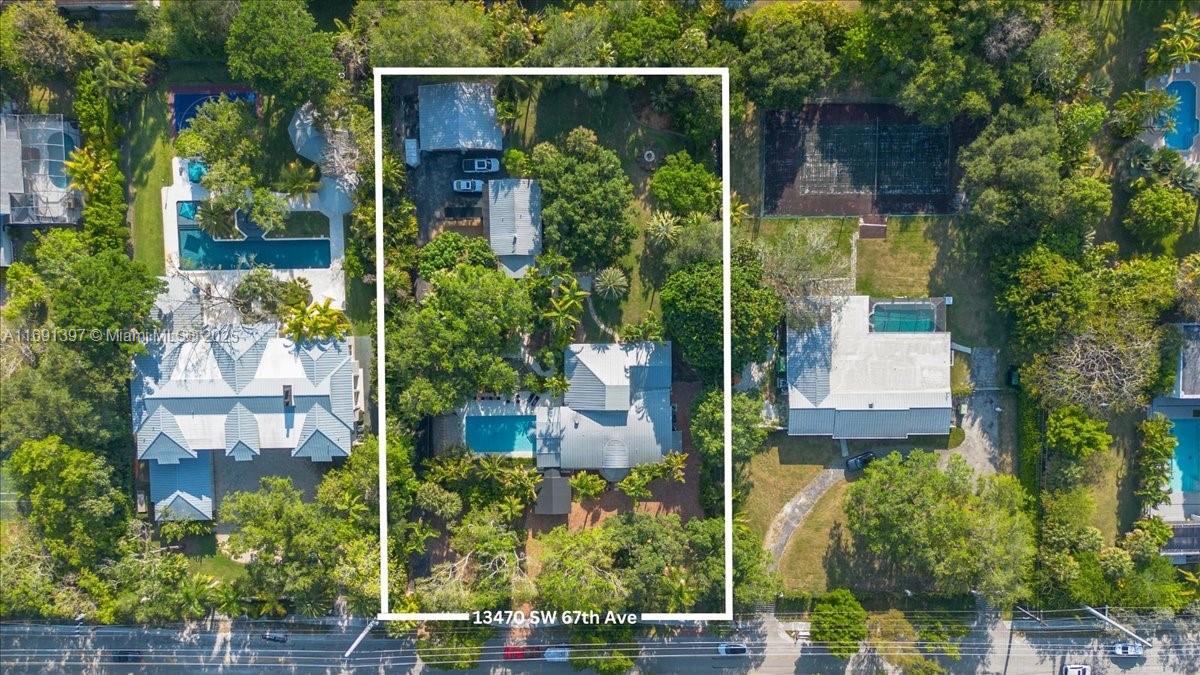
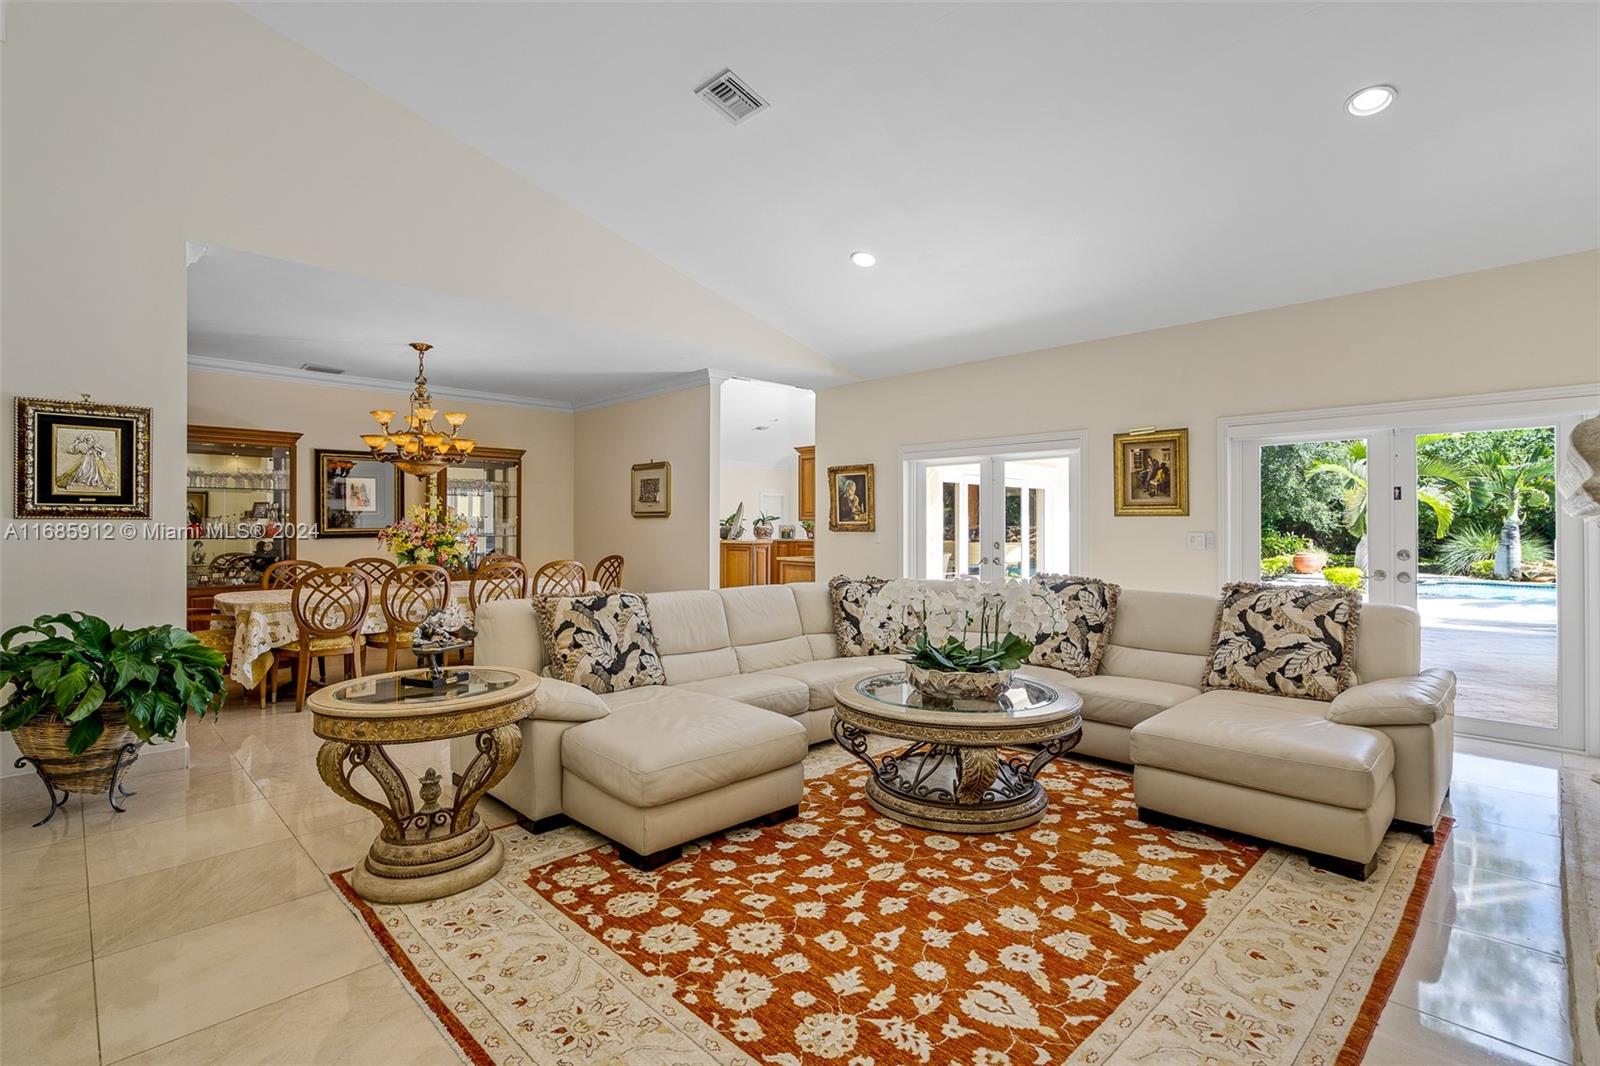
$2,790,000
4
bds
|
4
ba
|
3,258
sqft
|
built
1936
13470 SW 67th Ave, Pinecrest, FL 33156
$-11,587
Cash flow
-21.7%
Cash-on-Cash Return
1.2%
Cap rate
0.2%
Rent to Value Ratio
Active
$4,200,000
7
bds
|
6
ba
|
5,114
sqft
|
built
1955
10735 SW 58th Ave, Pinecrest, FL 33156
$-19,747
Cash flow
-24.5%
Cash-on-Cash Return
0.5%
Cap rate
0.1%
Rent to Value Ratio
Active
$7,900,000
7
bds
|
8
ba
|
7,132
sqft
|
built
2021
6695 SW 112th St, Pinecrest, FL 33156
$-39,060
Cash flow
-25.8%
Cash-on-Cash Return
0.2%
Cap rate
0.1%
Rent to Value Ratio
Active
$3,575,000
7
bds
|
6
ba
|
4,553
sqft
|
built
2017
7650 SW 128th St, Pinecrest, FL 33156
$-12,351
Cash flow
-18.0%
Cash-on-Cash Return
2.0%
Cap rate
0.3%
Rent to Value Ratio
Active
$10,771,000
7
bds
|
9
ba
|
10,323
sqft
|
built
2008
5901 Rolling Road Dr, Pinecrest, FL 33156
$-55,863
Cash flow
-27.1%
Cash-on-Cash Return
-0.1%
Cap rate
0.1%
Rent to Value Ratio
Active
$3,445,000
4
bds
|
5
ba
|
3,143
sqft
|
built
2021
7720 SW 130th St, Pinecrest, FL 33156
$-13,995
Cash flow
-21.2%
Cash-on-Cash Return
1.3%
Cap rate
0.3%
Rent to Value Ratio
Active
$1,580,000
4
bds
|
3
ba
|
2,702
sqft
|
built
1958
7901 SW 133rd St, Pinecrest, FL 33156
$-2,470
Cash flow
-8.2%
Cash-on-Cash Return
4.3%
Cap rate
0.6%
Rent to Value Ratio
Active
$14,900,000
7
bds
|
10
ba
|
0
sqft
|
built
1954
6060 SW 120th St, Pinecrest, FL 33156
$-73,958
Cash flow
-25.9%
Cash-on-Cash Return
0.2%
Cap rate
0.1%
Rent to Value Ratio
Active
$2,150,000
5
bds
|
3
ba
|
2,755
sqft
|
built
1967
11420 SW 80th Rd, Pinecrest, FL 33156
$-6,068
Cash flow
-14.7%
Cash-on-Cash Return
2.8%
Cap rate
0.5%
Rent to Value Ratio
Active
$439,000
2
bds
|
2
ba
|
1,350
sqft
|
built
2006
9066 SW 73rd Ct, Pinecrest, FL 33156
$-1,958
Cash flow
-23.3%
Cash-on-Cash Return
0.8%
Cap rate
0.8%
Rent to Value Ratio
Active
$4,249,000
6
bds
|
6
ba
|
5,066
sqft
|
built
2005
5837 SW 102nd St, Pinecrest, FL 33156
$-19,044
Cash flow
-23.4%
Cash-on-Cash Return
0.8%
Cap rate
0.2%
Rent to Value Ratio

Active
$3,995,000
5
bds
|
5
ba
|
5,197
sqft
|
built
2011
7860 SW 129th Ter, Pinecrest, FL 33156
$-15,939
Cash flow
-20.8%
Cash-on-Cash Return
1.4%
Cap rate
0.2%
Rent to Value Ratio

Active
$7,950,000
6
bds
|
8
ba
|
8,360
sqft
|
built
2001
6465 SW 104th St, Pinecrest, FL 33156
$-37,440
Cash flow
-24.6%
Cash-on-Cash Return
0.5%
Cap rate
0.1%
Rent to Value Ratio

Active
$5,350,000
5
bds
|
8
ba
|
6,174
sqft
|
built
2001
6710 SW 92nd St, Pinecrest, FL 33156
$-22,505
Cash flow
-21.9%
Cash-on-Cash Return
1.1%
Cap rate
0.2%
Rent to Value Ratio

Active
$472,000
2
bds
|
2
ba
|
1,350
sqft
|
built
2006
9066 SW 73rd Ct, Pinecrest, FL 33156
$-2,060
Cash flow
-22.8%
Cash-on-Cash Return
0.9%
Cap rate
0.8%
Rent to Value Ratio
Active
$380,000
2
bds
|
3
ba
|
960
sqft
|
built
1966
8650 SW 67th Ave, Pinecrest, FL 33156
$-1,425
Cash flow
-19.6%
Cash-on-Cash Return
1.6%
Cap rate
0.7%
Rent to Value Ratio
Active
$6,850,000
7
bds
|
8
ba
|
8,321
sqft
|
built
2006
12110 SW 60th Ct, Pinecrest, FL 33156
$-30,832
Cash flow
-23.5%
Cash-on-Cash Return
0.7%
Cap rate
0.2%
Rent to Value Ratio

Active
$4,500,000
7
bds
|
7
ba
|
6,666
sqft
|
built
1968
12861 SW 63rd Ct, Pinecrest, FL 33156
$-17,314
Cash flow
-20.1%
Cash-on-Cash Return
1.5%
Cap rate
0.3%
Rent to Value Ratio

Active
$355,000
2
bds
|
3
ba
|
960
sqft
|
built
1966
8650 SW 67th Ave, Pinecrest, FL 33156
$-1,245
Cash flow
-18.3%
Cash-on-Cash Return
1.9%
Cap rate
0.7%
Rent to Value Ratio
Active
$260,000
1
bds
|
2
ba
|
740
sqft
|
built
1966
8600 SW 67th Ave, Pinecrest, FL 33156
$-760
Cash flow
-15.3%
Cash-on-Cash Return
2.6%
Cap rate
0.8%
Rent to Value Ratio

Active
$2,900,000
5
bds
|
5
ba
|
3,200
sqft
|
built
1962
7000 SW 125th St, Pinecrest, FL 33156
$-7,958
Cash flow
-14.3%
Cash-on-Cash Return
2.9%
Cap rate
0.4%
Rent to Value Ratio
Active
$450,000
3
bds
|
3
ba
|
1,080
sqft
|
built
1966
6707 N Kendall Dr, Pinecrest, FL 33156
$-1,399
Cash flow
-16.2%
Cash-on-Cash Return
2.4%
Cap rate
0.7%
Rent to Value Ratio
Active
$454,000
2
bds
|
2
ba
|
1,467
sqft
|
built
2006
9066 SW 73rd Ct, Pinecrest, FL 33156
$-1,707
Cash flow
-19.6%
Cash-on-Cash Return
1.6%
Cap rate
0.8%
Rent to Value Ratio