Providence, UT Investment Properties for Sale
Browse homes for sale and investment properties in Providence, UT. Refine your search by price, property type, or more.
Best cash flowing properties in Providence, UT
Active
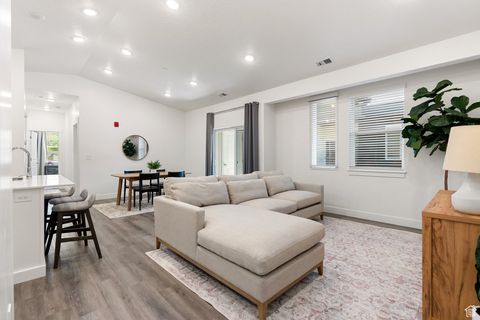
$269,900
2
bds
|
2
ba
|
1,125
sqft
|
built
2020
460 W 15 S, Providence, UT 84332
$-266
Cash flow
-5.1%
Cash-on-Cash Return
4.5%
Cap rate
0.7%
Rent to Value Ratio
Active
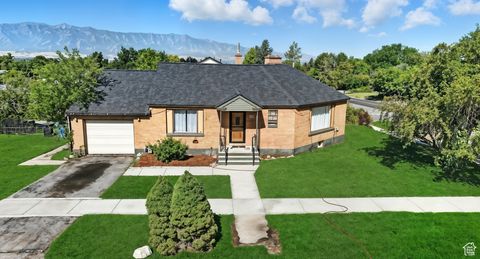
$480,000
4
bds
|
2
ba
|
2,960
sqft
|
built
1951
407 S 100 W, Providence, UT 84332
$-515
Cash flow
-5.6%
Cash-on-Cash Return
4.4%
Cap rate
0.6%
Rent to Value Ratio
27 out of 38 properties for sale in Providence, UT
Limited Results Shown
Create a free account, or log in to reveal all property listings and enjoy the complete experience.
Active
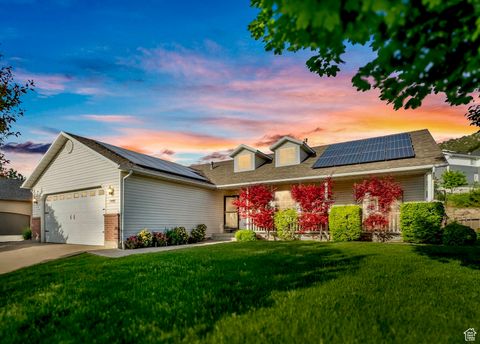
$575,000
5
bds
|
3
ba
|
3,835
sqft
|
built
2000
1092 S 470 E, Providence, UT 84332
$-1,019
Cash flow
-9.2%
Cash-on-Cash Return
3.6%
Cap rate
0.5%
Rent to Value Ratio
Active
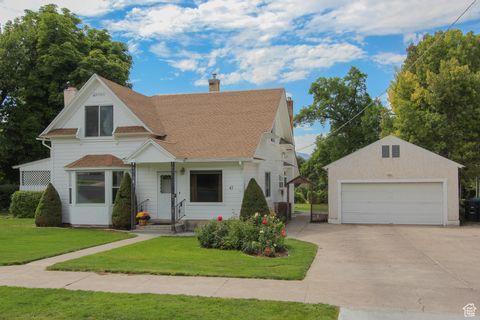
$474,900
4
bds
|
3
ba
|
3,006
sqft
|
built
1919
47 N Main St, Providence, UT 84332
$-1,020
Cash flow
-11.2%
Cash-on-Cash Return
3.1%
Cap rate
0.4%
Rent to Value Ratio
Active
$1,250,000
5
bds
|
3
ba
|
3,784
sqft
|
built
1974
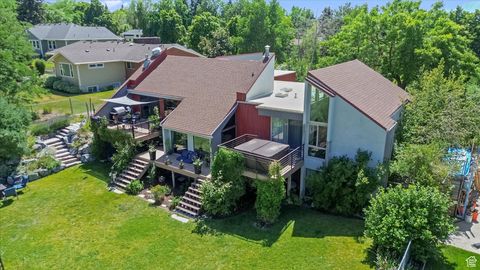
510 Spring Creek Rd, Providence, UT 84332
$-4,248
Cash flow
-17.7%
Cash-on-Cash Return
1.6%
Cap rate
0.2%
Rent to Value Ratio
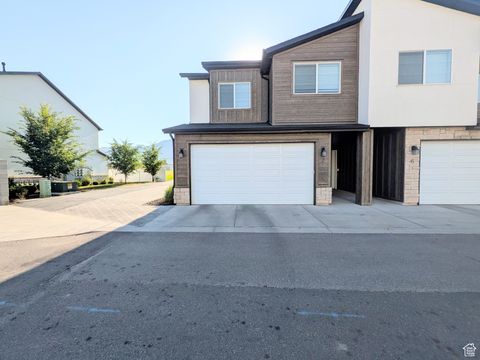
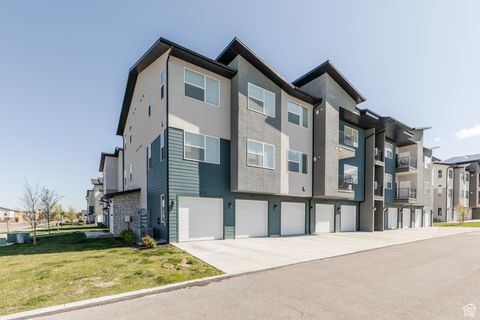
Active
$349,000
3
bds
|
3
ba
|
1,576
sqft
|
built
2020
2 S 410 W, Providence, UT 84332
$-897
Cash flow
-13.4%
Cash-on-Cash Return
2.6%
Cap rate
0.5%
Rent to Value Ratio
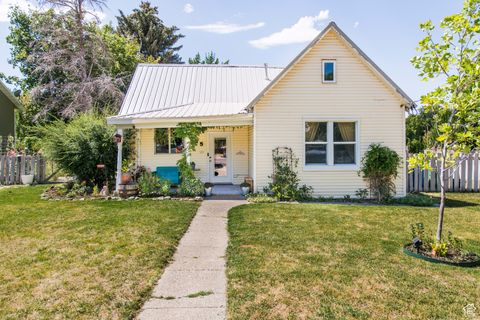
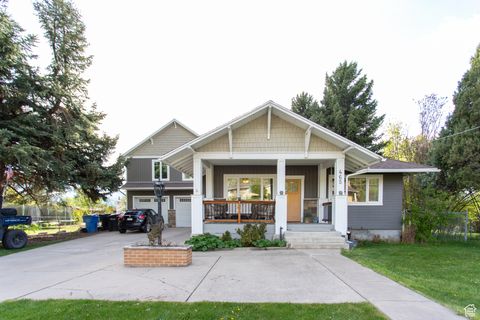
Active
$400,000
4
bds
|
2
ba
|
1,358
sqft
|
built
1918
155 S 100 W, Providence, UT 84332
$-778
Cash flow
-10.1%
Cash-on-Cash Return
3.3%
Cap rate
0.4%
Rent to Value Ratio
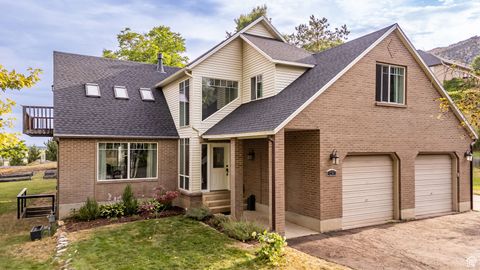
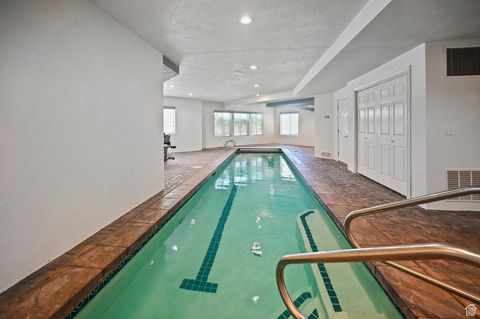
Active
$745,000
6
bds
|
4
ba
|
4,517
sqft
|
built
1985
591 Vons Way Dr, Providence, UT 84332
$-1,650
Cash flow
-11.6%
Cash-on-Cash Return
3.0%
Cap rate
0.4%
Rent to Value Ratio
Active
$2,835,000
27
bds
|
22
ba
|
12,679
sqft
|
built
2020
254 N Spring Creek Pkwy, Providence, UT 84332
$-13,314
Cash flow
-24.5%
Cash-on-Cash Return
0.0%
Cap rate
0.1%
Rent to Value Ratio
Active
$344,900
3
bds
|
3
ba
|
1,574
sqft
|
built
2021
565 N 245 E, Providence, UT 84332
$-840
Cash flow
-12.7%
Cash-on-Cash Return
2.8%
Cap rate
0.5%
Rent to Value Ratio
Active
$499,900
5
bds
|
3
ba
|
2,664
sqft
|
built
2004
151 E 360 N, Providence, UT 84332
$-1,154
Cash flow
-12.0%
Cash-on-Cash Return
2.9%
Cap rate
0.4%
Rent to Value Ratio
Active
$289,900
3
bds
|
2
ba
|
1,302
sqft
|
built
2022
139 E 550 N, Providence, UT 84332
$-604
Cash flow
-10.9%
Cash-on-Cash Return
3.2%
Cap rate
0.6%
Rent to Value Ratio
Active
$585,000
6
bds
|
4
ba
|
3,082
sqft
|
built
2003
439 Meadow Ln, Providence, UT 84332
$-1,366
Cash flow
-12.2%
Cash-on-Cash Return
2.9%
Cap rate
0.4%
Rent to Value Ratio
Active
$749,900
5
bds
|
5
ba
|
4,599
sqft
|
built
2005
1229 Grandview Dr, Providence, UT 84332
$-1,930
Cash flow
-13.4%
Cash-on-Cash Return
2.6%
Cap rate
0.4%
Rent to Value Ratio
Active
$359,000
3
bds
|
3
ba
|
1,537
sqft
|
built
2019
427 W 65 S, Providence, UT 84332
$-670
Cash flow
-9.7%
Cash-on-Cash Return
3.4%
Cap rate
0.6%
Rent to Value Ratio
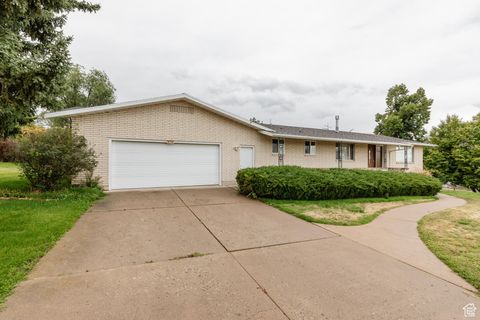
Active
$530,000
3
bds
|
2
ba
|
3,221
sqft
|
built
2002
287 S 375 W, Providence, UT 84332
$-896
Cash flow
-8.8%
Cash-on-Cash Return
3.6%
Cap rate
0.5%
Rent to Value Ratio
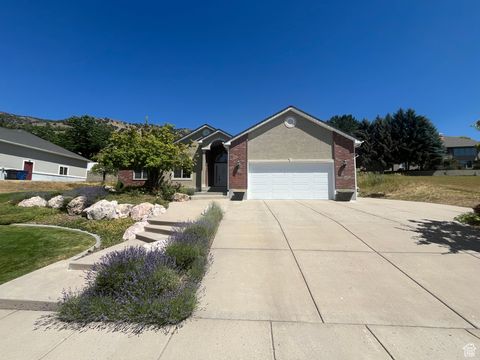
Active
$599,000
5
bds
|
2
ba
|
2,276
sqft
|
built
1964
185 S 200 W, Providence, UT 84332
$-1,810
Cash flow
-15.8%
Cash-on-Cash Return
2.1%
Cap rate
0.3%
Rent to Value Ratio
Active
$500,000
4
bds
|
4
ba
|
2,726
sqft
|
built
1991
672 E Center St, Providence, UT 84332
$-1,055
Cash flow
-11.0%
Cash-on-Cash Return
3.1%
Cap rate
0.4%
Rent to Value Ratio
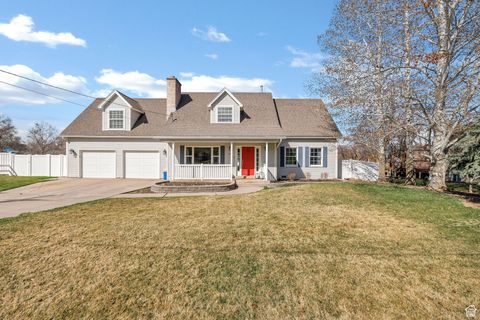
Active
$1,149,900
5
bds
|
4
ba
|
4,990
sqft
|
built
1961
191 S 300 E, Providence, UT 84332
$-3,754
Cash flow
-17.0%
Cash-on-Cash Return
1.8%
Cap rate
0.3%
Rent to Value Ratio
Active
$359,000
3
bds
|
3
ba
|
1,573
sqft
|
built
2020
175 E 550 N, Providence, UT 84332
$-909
Cash flow
-13.2%
Cash-on-Cash Return
2.6%
Cap rate
0.4%
Rent to Value Ratio
Active
$289,900
3
bds
|
2
ba
|
1,313
sqft
|
built
2022
475 W 60 S, Providence, UT 84332
$-647
Cash flow
-11.6%
Cash-on-Cash Return
3.0%
Cap rate
0.6%
Rent to Value Ratio
Active
$625,000
6
bds
|
4
ba
|
3,159
sqft
|
built
1919
465 S Main St, Providence, UT 84332
$-1,114
Cash flow
-9.3%
Cash-on-Cash Return
3.5%
Cap rate
0.5%
Rent to Value Ratio
Active
$995,000
3
bds
|
3
ba
|
5,270
sqft
|
built
1996
90 S Sherwood Dr, Providence, UT 84332
$-2,229
Cash flow
-11.7%
Cash-on-Cash Return
3.0%
Cap rate
0.4%
Rent to Value Ratio
Active
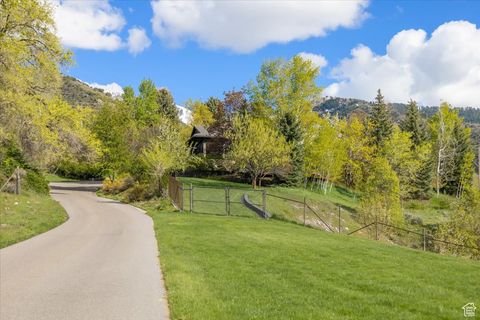
$2,499,000
3
bds
|
4
ba
|
6,185
sqft
|
built
1988
760 Maple Hollow Ln, Providence, UT 84332
$-9,226
Cash flow
-19.3%
Cash-on-Cash Return
1.2%
Cap rate
0.2%
Rent to Value Ratio
Active
$629,990
6
bds
|
4
ba
|
3,952
sqft
|
built
2003
240 Bugle Way, Providence, UT 84332
$-1,045
Cash flow
-8.7%
Cash-on-Cash Return
3.7%
Cap rate
0.5%
Rent to Value Ratio
Active
$749,999
5
bds
|
3
ba
|
3,162
sqft
|
built
1981
385 N 300 E, Providence, UT 84332
$-1,449
Cash flow
-10.1%
Cash-on-Cash Return
3.4%
Cap rate
0.4%
Rent to Value Ratio
Active
$474,000
4
bds
|
3
ba
|
2,862
sqft
|
built
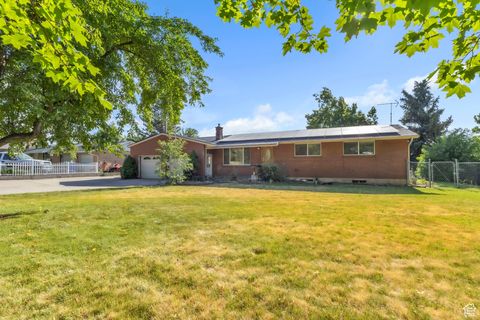
1968
410 E 300 N, Providence, UT 84332
$-840
Cash flow
-9.2%
Cash-on-Cash Return
3.6%
Cap rate
0.5%
Rent to Value Ratio