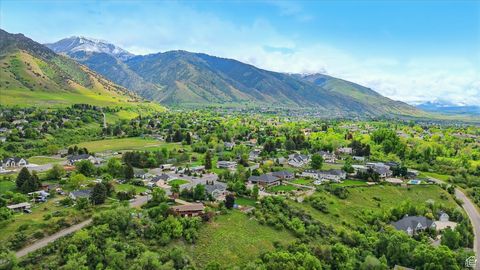
Providence, UT Investment Properties for Sale
Browse homes for sale and investment properties in Providence, UT. Refine your search by price, property type, or more.
Best cash flowing properties in Providence, UT
Active
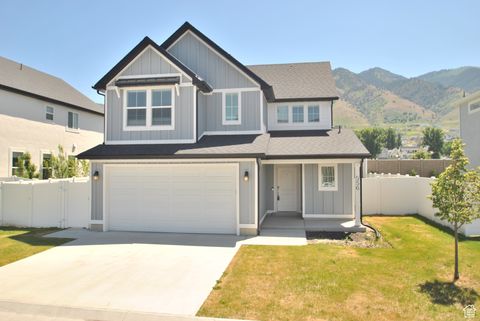
$365,000
3
bds
|
3
ba
|
1,537
sqft
|
built
2019
427 W 65 S, Providence, UT 84332
$-698
Cash flow
-10.0%
Cash-on-Cash Return
3.4%
Cap rate
0.5%
Rent to Value Ratio
Active
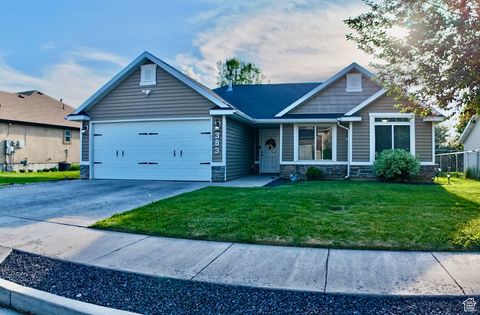
$304,900
3
bds
|
2
ba
|
1,313
sqft
|
built
2022
475 W 60 S, Providence, UT 84332
$-718
Cash flow
-12.3%
Cash-on-Cash Return
2.9%
Cap rate
0.5%
Rent to Value Ratio
31 out of 40 properties for sale in Providence, UT
Limited Results Shown
Create a free account, or log in to reveal all property listings and enjoy the complete experience.
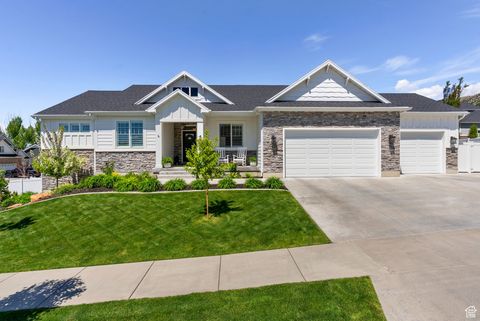
Active
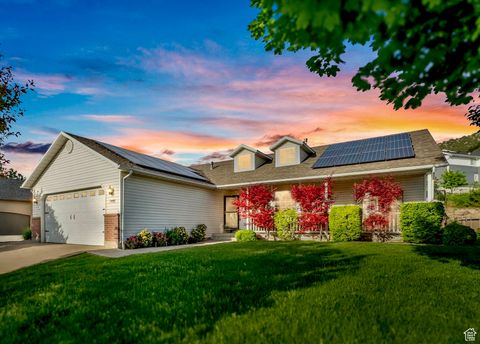
$389,900
3
bds
|
3
ba
|
1,696
sqft
|
built
2001
435 Cobblestone, Providence, UT 84332
$-1,025
Cash flow
-13.7%
Cash-on-Cash Return
2.5%
Cap rate
0.5%
Rent to Value Ratio
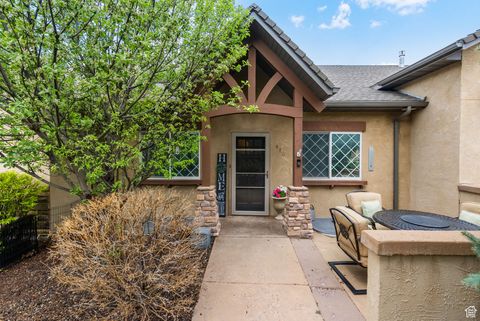
Active
$530,000
3
bds
|
2
ba
|
3,221
sqft
|
built
2002
287 S 375 W, Providence, UT 84332
$-896
Cash flow
-8.8%
Cash-on-Cash Return
3.6%
Cap rate
0.5%
Rent to Value Ratio
Active
$774,900
6
bds
|
4
ba
|
4,517
sqft
|
built
1985
591 Vons Way Dr, Providence, UT 84332
$-1,791
Cash flow
-12.1%
Cash-on-Cash Return
2.9%
Cap rate
0.4%
Rent to Value Ratio
Active
$625,000
5
bds
|
2
ba
|
2,276
sqft
|
built
1964
185 S 200 W, Providence, UT 84332
$-2,238
Cash flow
-18.7%
Cash-on-Cash Return
2.0%
Cap rate
0.3%
Rent to Value Ratio
Active
$500,000
4
bds
|
4
ba
|
2,726
sqft
|
built
1991
672 E Center St, Providence, UT 84332
$-1,299
Cash flow
-13.6%
Cash-on-Cash Return
3.1%
Cap rate
0.4%
Rent to Value Ratio
Active
$439,000
3
bds
|
2
ba
|
1,680
sqft
|
built
2000
348 Bluff St, Providence, UT 84332
$-849
Cash flow
-10.1%
Cash-on-Cash Return
3.4%
Cap rate
0.5%
Rent to Value Ratio
Active
$469,900
3
bds
|
3
ba
|
1,566
sqft
|
built
2021
556 N 275 E, Providence, UT 84332
$-888
Cash flow
-9.9%
Cash-on-Cash Return
3.4%
Cap rate
0.5%
Rent to Value Ratio
Active
$600,000
5
bds
|
3
ba
|
3,835
sqft
|
built
2000
1092 S 470 E, Providence, UT 84332
$-1,137
Cash flow
-9.9%
Cash-on-Cash Return
3.4%
Cap rate
0.5%
Rent to Value Ratio
Active
$415,000
3
bds
|
2
ba
|
1,190
sqft
|
built
2005
383 N 100 E, Providence, UT 84332
$-826
Cash flow
-10.4%
Cash-on-Cash Return
3.3%
Cap rate
0.4%
Rent to Value Ratio

Active
$575,000
3
bds
|
3
ba
|
2,020
sqft
|
built
2017
818 S 560 E, Providence, UT 84332
$-1,219
Cash flow
-11.1%
Cash-on-Cash Return
3.1%
Cap rate
0.4%
Rent to Value Ratio
Active
$1,149,900
5
bds
|
4
ba
|
4,990
sqft
|
built
1961
191 S 300 E, Providence, UT 84332
$-3,754
Cash flow
-17.0%
Cash-on-Cash Return
1.8%
Cap rate
0.3%
Rent to Value Ratio
Active
$924,900
6
bds
|
4
ba
|
4,124
sqft
|
built
2018
485 E 500 N, Providence, UT 84332
$-2,191
Cash flow
-12.4%
Cash-on-Cash Return
2.8%
Cap rate
0.4%
Rent to Value Ratio
Active
$359,000
3
bds
|
3
ba
|
1,573
sqft
|
built
2020
175 E 550 N, Providence, UT 84332
$-1,077
Cash flow
-15.7%
Cash-on-Cash Return
2.6%
Cap rate
0.4%
Rent to Value Ratio
Active
$399,999
3
bds
|
3
ba
|
2,053
sqft
|
built
2007
470 Linden Ln, Providence, UT 84332
$-793
Cash flow
-10.3%
Cash-on-Cash Return
3.3%
Cap rate
0.6%
Rent to Value Ratio
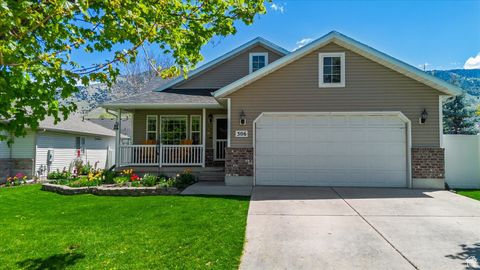
Active
$529,900
5
bds
|
3
ba
|
2,803
sqft
|
built
2002
306 Arts Pl, Providence, UT 84332
$-966
Cash flow
-9.5%
Cash-on-Cash Return
3.5%
Cap rate
0.5%
Rent to Value Ratio
Active
$979,000
5
bds
|
4
ba
|
4,502
sqft
|
built
2005
61 N Sherwood Dr, Providence, UT 84332
$-1,871
Cash flow
-10.0%
Cash-on-Cash Return
3.4%
Cap rate
0.5%
Rent to Value Ratio
Active
$625,000
6
bds
|
4
ba
|
3,159
sqft
|
built
1919
465 S Main St, Providence, UT 84332
$-1,114
Cash flow
-9.3%
Cash-on-Cash Return
3.5%
Cap rate
0.5%
Rent to Value Ratio
Active
$2,750,000
3
bds
|
4
ba
|
6,185
sqft
|
built
1988
760 Maple Hollow Ln, Providence, UT 84332
$-10,414
Cash flow
-19.8%
Cash-on-Cash Return
1.1%
Cap rate
0.2%
Rent to Value Ratio
Active
$1,099,000
3
bds
|
3
ba
|
5,270
sqft
|
built
1996
90 S Sherwood Dr, Providence, UT 84332
$-2,721
Cash flow
-12.9%
Cash-on-Cash Return
2.7%
Cap rate
0.4%
Rent to Value Ratio
Active
$1,699,900
3
bds
|
2
ba
|
2,652
sqft
|
built
1977
314 W 100 S, Providence, UT 84332
$-6,762
Cash flow
-20.8%
Cash-on-Cash Return
0.9%
Cap rate
0.1%
Rent to Value Ratio

Active
$849,900
8
bds
|
5
ba
|
5,782
sqft
|
built
2005
1135 Grandview Dr, Providence, UT 84332
$-1,329
Cash flow
-8.2%
Cash-on-Cash Return
3.8%
Cap rate
0.5%
Rent to Value Ratio

Active
$629,990
6
bds
|
4
ba
|
3,952
sqft
|
built
2003
240 Bugle Way, Providence, UT 84332
$-1,045
Cash flow
-8.7%
Cash-on-Cash Return
3.7%
Cap rate
0.5%
Rent to Value Ratio
Active
$799,900
5
bds
|
3
ba
|
3,162
sqft
|
built
1981
385 N 300 E, Providence, UT 84332
$-1,685
Cash flow
-11.0%
Cash-on-Cash Return
3.2%
Cap rate
0.4%
Rent to Value Ratio

Active
$544,900
5
bds
|
3
ba
|
3,498
sqft
|
built
1988
368 Spring Creek Rd, Providence, UT 84332
$-1,379
Cash flow
-13.2%
Cash-on-Cash Return
2.6%
Cap rate
0.4%
Rent to Value Ratio
Active
$465,900
3
bds
|
2
ba
|
2,922
sqft
|
built
1971
525 S 75 W, Providence, UT 84332
$-1,106
Cash flow
-12.4%
Cash-on-Cash Return
2.8%
Cap rate
0.4%
Rent to Value Ratio

Active
$305,000
2
bds
|
2
ba
|
1,125
sqft
|
built
2022
115 E 550 N, Providence, UT 84332
$-739
Cash flow
-12.6%
Cash-on-Cash Return
2.8%
Cap rate
0.5%
Rent to Value Ratio

Active
$950,000
6
bds
|
4
ba
|
4,623
sqft
|
built
2020
680 E 525 N, Providence, UT 84332
$-3,148
Cash flow
-17.3%
Cash-on-Cash Return
1.7%
Cap rate
0.2%
Rent to Value Ratio

Active
$849,900
4
bds
|
5
ba
|
5,412
sqft
|
built
2007
386 Edgehill Dr, Providence, UT 84332
$-1,610
Cash flow
-9.9%
Cash-on-Cash Return
3.4%
Cap rate
0.5%
Rent to Value Ratio

Active
$599,990
6
bds
|
3
ba
|
3,374
sqft
|
built
1999
232 Bugle Way, Providence, UT 84332
$-1,017
Cash flow
-8.8%
Cash-on-Cash Return
3.6%
Cap rate
0.5%
Rent to Value Ratio