Richland, MI Investment Properties for Sale
Browse homes for sale and investment properties in Richland, MI. Refine your search by price, property type, or more.
Best cash flowing properties in Richland, MI

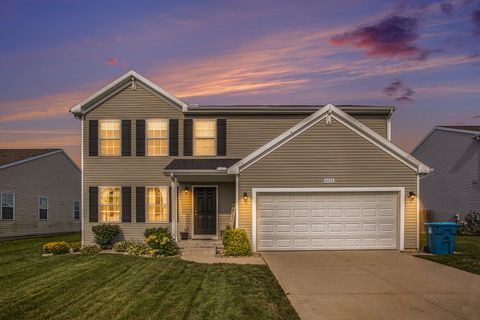
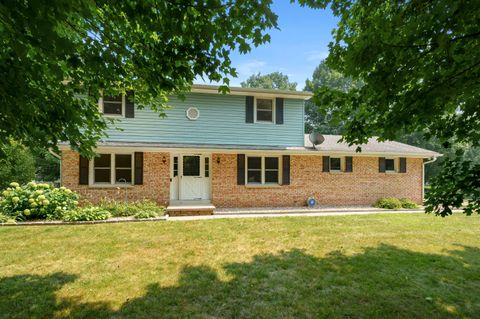
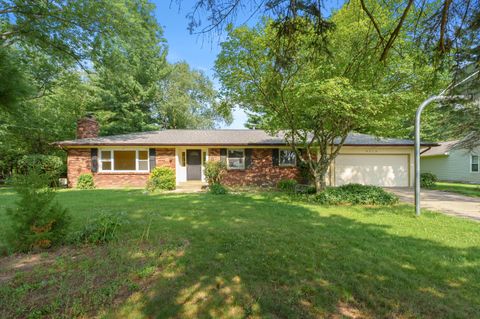
Active
$289,000
3
bds
|
4
ba
|
3,372
sqft
|
built
2009
8855 Geiser Grv, Richland, MI 49083
$-272
Cash flow
-4.9%
Cash-on-Cash Return
5.0%
Cap rate
0.8%
Rent to Value Ratio
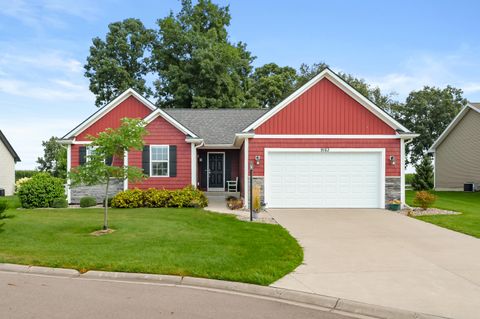
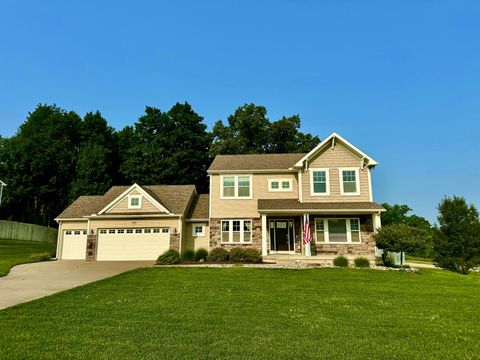
Active
$312,500
4
bds
|
3
ba
|
1,822
sqft
|
built
2019
8058 W Sturtevant Ave, Richland, MI 49083
$-430
Cash flow
-7.2%
Cash-on-Cash Return
4.5%
Cap rate
0.7%
Rent to Value Ratio
20 out of 22 properties for sale in Richland, MI
Limited Results Shown
Create a free account, or log in to reveal all property listings and enjoy the complete experience.
Active
$410,000
3
bds
|
3
ba
|
2,272
sqft
|
built
2020
9163 Cottage Trl, Richland, MI 49083
$-1,660
Cash flow
-21.1%
Cash-on-Cash Return
1.3%
Cap rate
0.4%
Rent to Value Ratio
Active
$329,900
3
bds
|
3
ba
|
2,040
sqft
|
built
1994
9353 E De Ave, Richland, MI 49083
$-512
Cash flow
-8.1%
Cash-on-Cash Return
4.3%
Cap rate
0.7%
Rent to Value Ratio
Active
$319,900
2
bds
|
2
ba
|
1,344
sqft
|
built
1977
5562 N 31st St, Richland, MI 49083
$-512
Cash flow
-8.4%
Cash-on-Cash Return
4.2%
Cap rate
0.6%
Rent to Value Ratio
Active
$320,000
3
bds
|
2
ba
|
2,032
sqft
|
built
1968
8192 Gull Mnr, Richland, MI 49083
$-515
Cash flow
-8.4%
Cash-on-Cash Return
4.2%
Cap rate
0.6%
Rent to Value Ratio

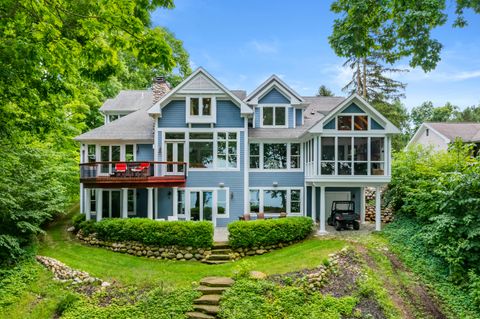
Active
$1,075,000
5
bds
|
5
ba
|
6,010
sqft
|
built
2007
6621 Hidden Lake Cir, Richland, MI 49083
$-4,395
Cash flow
-21.3%
Cash-on-Cash Return
1.2%
Cap rate
0.3%
Rent to Value Ratio
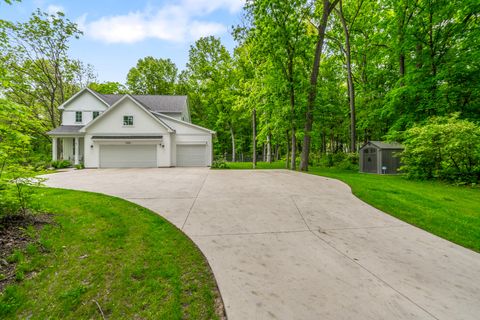
Active
$450,000
5
bds
|
4
ba
|
3,582
sqft
|
built
2011
7990 Hemel Ln, Richland, MI 49083
$-780
Cash flow
-9.0%
Cash-on-Cash Return
4.1%
Cap rate
0.6%
Rent to Value Ratio

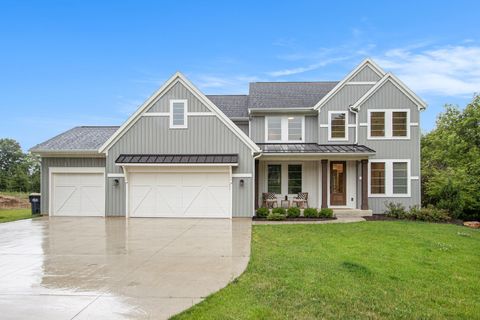
Active
$1,275,000
5
bds
|
4
ba
|
3,758
sqft
|
built
2002
8787 N 27th St, Richland, MI 49083
$-4,959
Cash flow
-20.3%
Cash-on-Cash Return
1.5%
Cap rate
0.2%
Rent to Value Ratio
Active
$724,900
4
bds
|
4
ba
|
3,960
sqft
|
built
2004
10407 Huckleberry, Richland, MI 49083
$-1,878
Cash flow
-13.5%
Cash-on-Cash Return
3.0%
Cap rate
0.5%
Rent to Value Ratio
Active
$499,900
4
bds
|
4
ba
|
2,890
sqft
|
built
1997
10921 E De Ave, Richland, MI 49083
$-857
Cash flow
-8.9%
Cash-on-Cash Return
4.1%
Cap rate
0.6%
Rent to Value Ratio
Active
$395,000
3
bds
|
2
ba
|
2,282
sqft
|
built
1976
8218 N 37th St, Richland, MI 49083
$-909
Cash flow
-12.0%
Cash-on-Cash Return
3.4%
Cap rate
0.6%
Rent to Value Ratio
Active
$1,590,000
6
bds
|
5
ba
|
5,977
sqft
|
built
2005
9765 Sterling Rd, Richland, MI 49083
$-5,572
Cash flow
-18.3%
Cash-on-Cash Return
1.9%
Cap rate
0.4%
Rent to Value Ratio
Active
$615,000
4
bds
|
4
ba
|
2,891
sqft
|
built
2023
10321 E C Ave, Richland, MI 49083
$-1,781
Cash flow
-15.1%
Cash-on-Cash Return
2.7%
Cap rate
0.5%
Rent to Value Ratio
Active
$999,999
5
bds
|
5
ba
|
4,077
sqft
|
built
2023
6520 E Hidden Lake Cir, Richland, MI 49083
$-2,789
Cash flow
-14.6%
Cash-on-Cash Return
2.8%
Cap rate
0.4%
Rent to Value Ratio

Active
$549,900
4
bds
|
4
ba
|
3,356
sqft
|
built
1993
11200 Delmar, Richland, MI 49083
$-1,283
Cash flow
-12.2%
Cash-on-Cash Return
3.3%
Cap rate
0.5%
Rent to Value Ratio
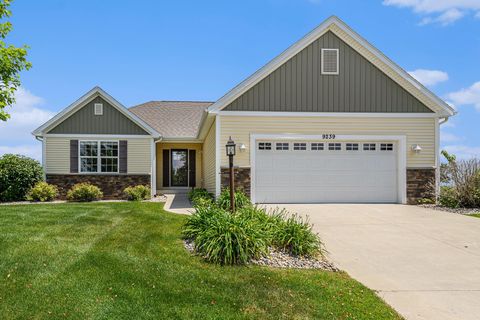
Active
$399,900
2
bds
|
2
ba
|
1,567
sqft
|
built
2018
9239 Cottage Gate, Richland, MI 49083
$-1,174
Cash flow
-15.3%
Cash-on-Cash Return
2.6%
Cap rate
0.6%
Rent to Value Ratio
Active
$629,827
3
bds
|
3
ba
|
2,204
sqft
|
built
2024
9673 N 27th St, Richland, MI 49083
$-1,243
Cash flow
-10.3%
Cash-on-Cash Return
3.8%
Cap rate
0.5%
Rent to Value Ratio

Active
$299,900
3
bds
|
2
ba
|
2,060
sqft
|
built
2020
8161 W Sturtevant Ave, Richland, MI 49083
$-698
Cash flow
-12.1%
Cash-on-Cash Return
3.4%
Cap rate
0.6%
Rent to Value Ratio
Active
$1,500,000
3
bds
|
2
ba
|
2,370
sqft
|
built
1960
9357 Fraulin Dr, Richland, MI 49083
$-6,357
Cash flow
-22.1%
Cash-on-Cash Return
1.1%
Cap rate
0.2%
Rent to Value Ratio