Rockford, IL Investment Properties for Sale
Browse homes for sale and investment properties in Rockford, IL. Refine your search by price, property type, or more.
Best cash flowing properties in Rockford, IL
Active
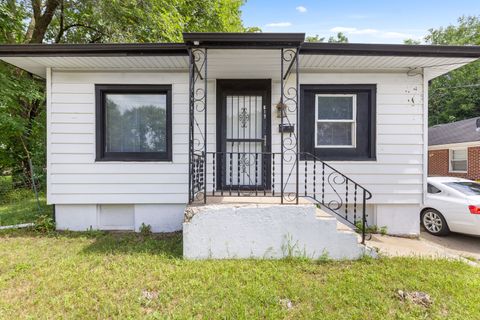
$120,000
4
bds
|
2
ba
|
1,416
sqft
|
built
1920
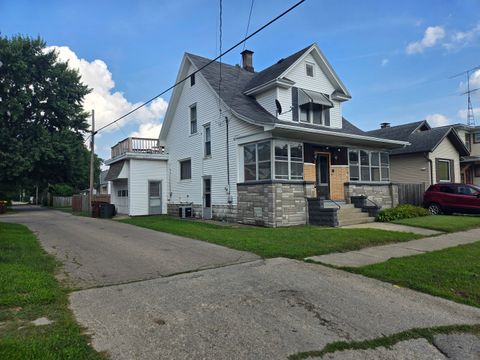
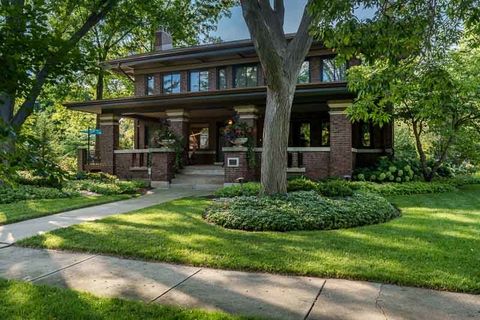
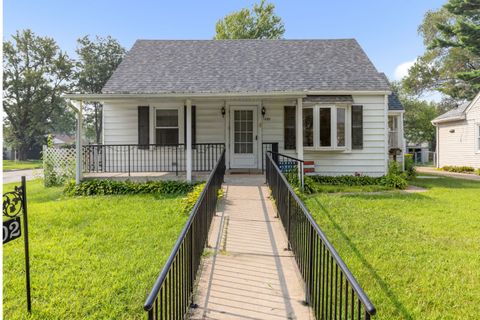
1618 Parmele St, Rockford, IL 61104
$580
Cash flow
25.2%
Cash-on-Cash Return
11.5%
Cap rate
1.5%
Rent to Value Ratio
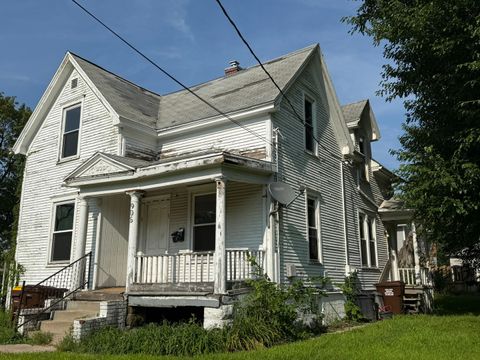
Active
$99,000
2
bds
|
2
ba
|
1,147
sqft
|
built
1940
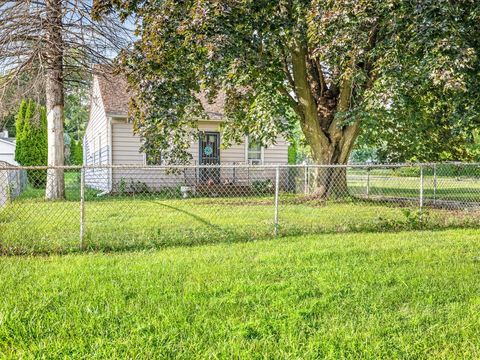
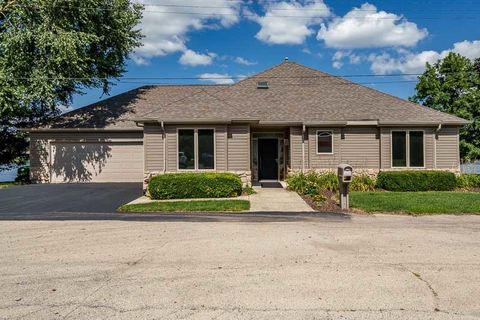
1734 Sandy Hollow Rd, Rockford, IL 61109
$547
Cash flow
28.8%
Cash-on-Cash Return
12.3%
Cap rate
1.6%
Rent to Value Ratio
87 out of 98 properties for sale in Rockford, IL
Limited Results Shown
Create a free account, or log in to reveal all property listings and enjoy the complete experience.
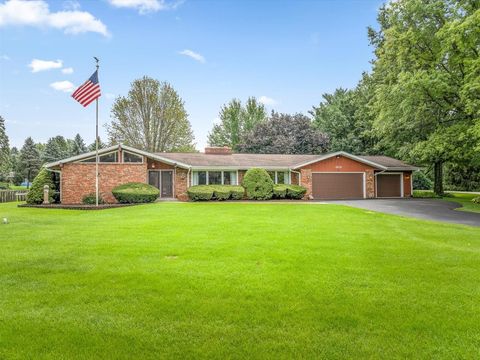
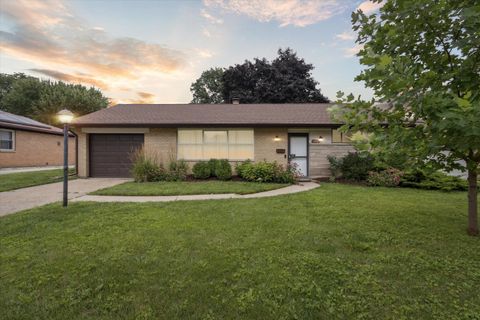
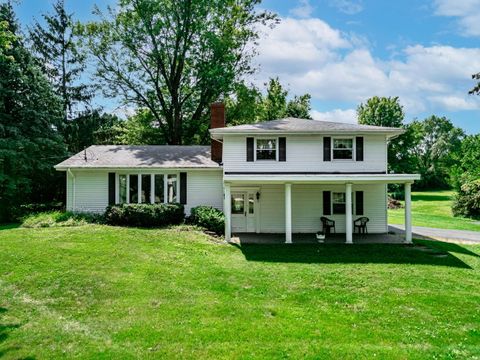
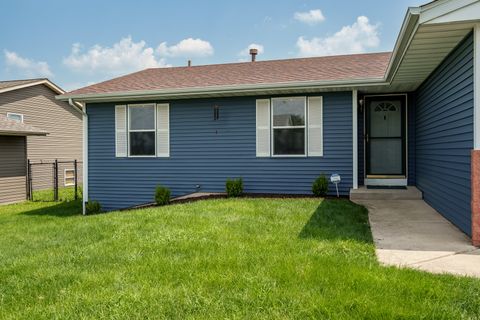
Active
$154,900
2
bds
|
1
ba
|
924
sqft
|
built
1963
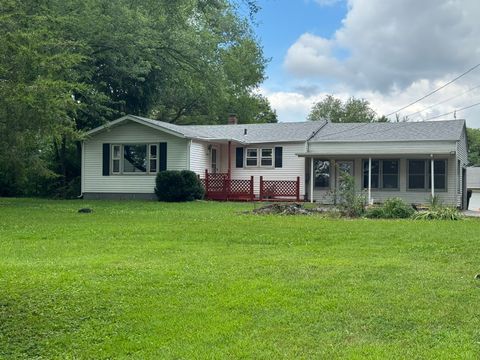
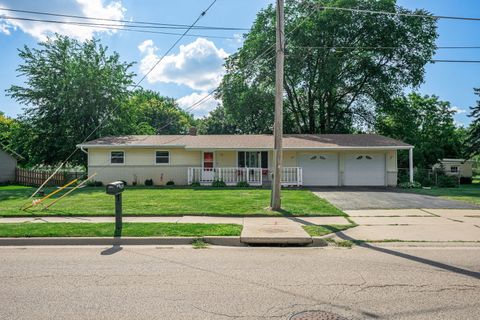
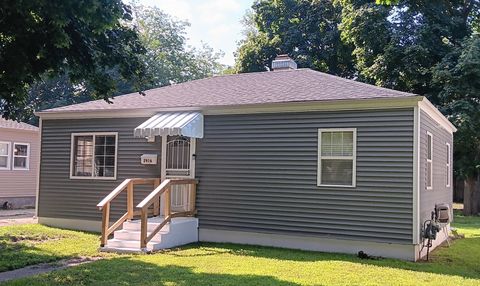
1826 Leonard Rd, Rockford, IL 61109
$185
Cash flow
6.2%
Cash-on-Cash Return
7.1%
Cap rate
1.0%
Rent to Value Ratio
Active
$175,000
6
bds
|
2
ba
|
0
sqft
|
built
1900
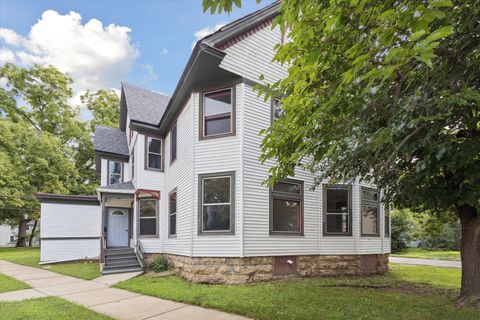
541 Woodlawn Ave, Rockford, IL 61103
$-160
Cash flow
-4.8%
Cash-on-Cash Return
4.6%
Cap rate
0.6%
Rent to Value Ratio
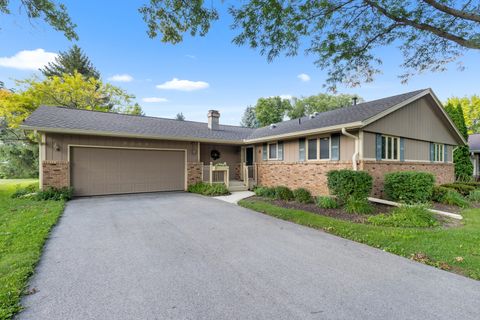
Active
$185,000
2
bds
|
2
ba
|
1,049
sqft
|
built
1981
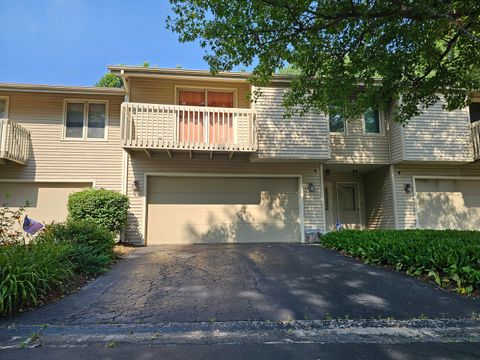
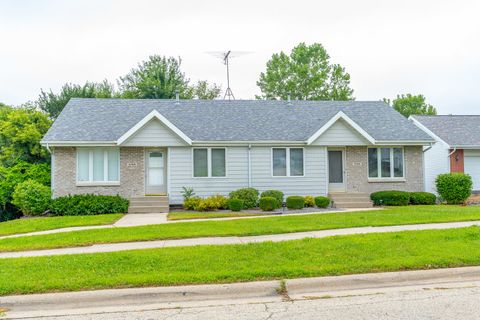
4641 High Point Dr, Rockford, IL 61114
$-122
Cash flow
-3.4%
Cash-on-Cash Return
4.9%
Cap rate
1.0%
Rent to Value Ratio
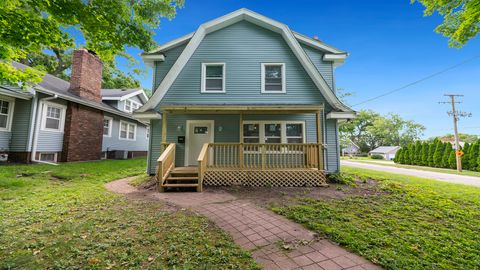
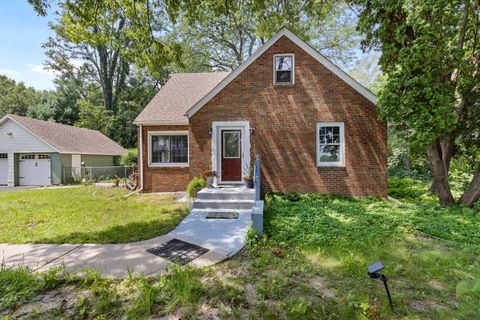
Active
$189,900
3
bds
|
2
ba
|
1,704
sqft
|
built
1920
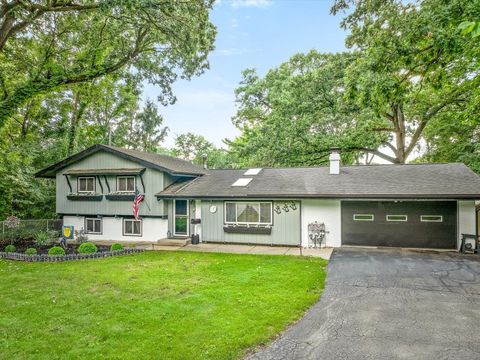
234 N Gardiner Ave, Rockford, IL 61107
$-244
Cash flow
-6.7%
Cash-on-Cash Return
4.1%
Cap rate
0.7%
Rent to Value Ratio
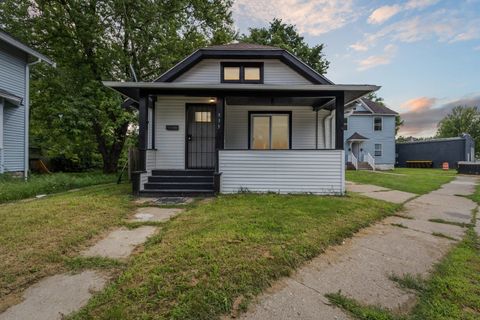
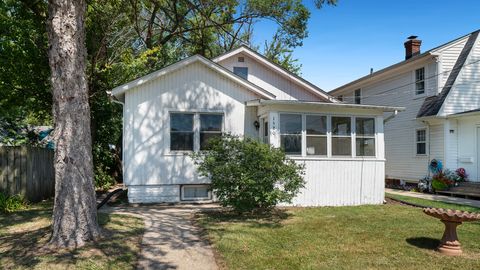
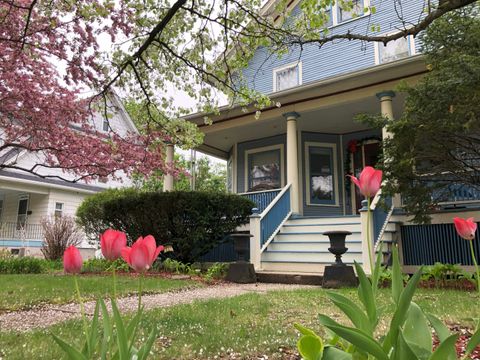
Active
$115,000
2
bds
|
1
ba
|
915
sqft
|
built
1920
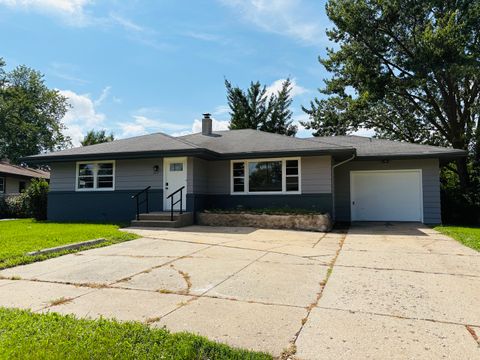
933 Ridge Ave, Rockford, IL 61103
$230
Cash flow
10.4%
Cash-on-Cash Return
8.1%
Cap rate
1.1%
Rent to Value Ratio
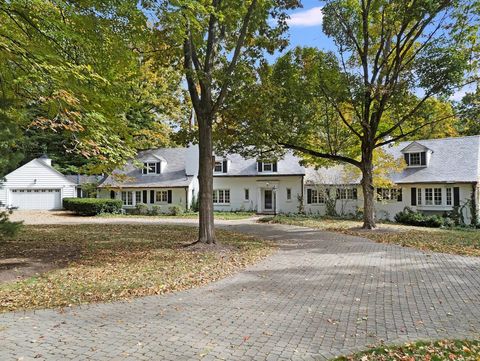
Active
$2,499,000
5
bds
|
7
ba
|
10,000
sqft
|
built
1949
1850 N Mulford Rd, Rockford, IL 61107
$-12,117
Cash flow
-25.3%
Cash-on-Cash Return
-0.1%
Cap rate
0.1%
Rent to Value Ratio
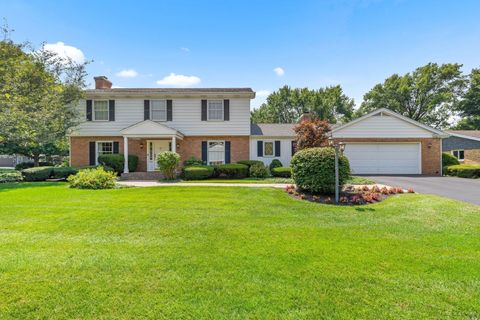
Active
$224,900
3
bds
|
2
ba
|
1,976
sqft
|
built
1973
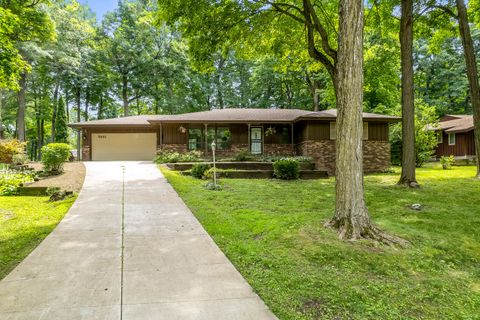
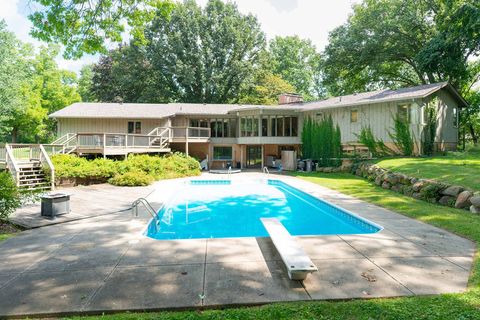
1003 Phelps Ave, Rockford, IL 61108
$133
Cash flow
3.1%
Cash-on-Cash Return
6.4%
Cap rate
1.0%
Rent to Value Ratio
Active
$385,000
4
bds
|
4
ba
|
0
sqft
|
built
1995
3786 Sage Dr, Rockford, IL 61114
$-1,421
Cash flow
-19.3%
Cash-on-Cash Return
1.2%
Cap rate
0.4%
Rent to Value Ratio
Active
$290,000
3
bds
|
3
ba
|
1,956
sqft
|
built
1960
1708 Parkview Ave, Rockford, IL 61107
$-604
Cash flow
-10.9%
Cash-on-Cash Return
3.2%
Cap rate
0.6%
Rent to Value Ratio
Active
$250,000
3
bds
|
2
ba
|
1,891
sqft
|
built
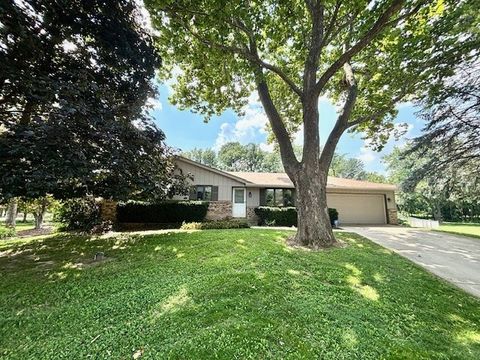
1968
5661 Einor Ave, Rockford, IL 61108
$-211
Cash flow
-4.4%
Cash-on-Cash Return
4.7%
Cap rate
0.9%
Rent to Value Ratio
Active
$205,000
2
bds
|
1
ba
|
1,800
sqft
|
built
1945
2216 Melrose St, Rockford, IL 61103
$-207
Cash flow
-5.3%
Cash-on-Cash Return
4.5%
Cap rate
0.6%
Rent to Value Ratio
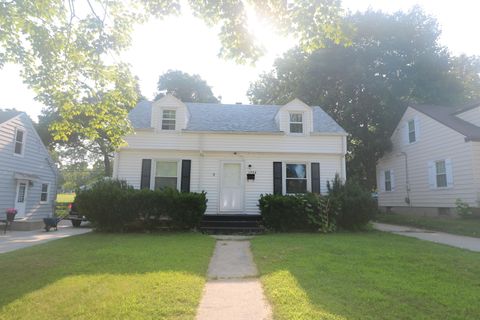
Active
$85,000
3
bds
|
2
ba
|
875
sqft
|
built
1900
444 Forest Ave, Rockford, IL 61101
$359
Cash flow
22.0%
Cash-on-Cash Return
10.7%
Cap rate
1.4%
Rent to Value Ratio
Active
$149,900
2
bds
|
2
ba
|
1,663
sqft
|
built
1900
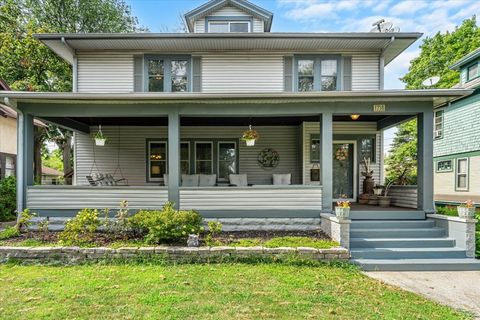
1116 Crosby St, Rockford, IL 61107
$256
Cash flow
8.9%
Cash-on-Cash Return
7.7%
Cap rate
1.1%
Rent to Value Ratio
Active
$79,999
1
bds
|
1
ba
|
708
sqft
|
built
1950
1201 15th St, Rockford, IL 61104
$385
Cash flow
25.1%
Cash-on-Cash Return
11.5%
Cap rate
1.6%
Rent to Value Ratio
Active
$500,000
6
bds
|
4
ba
|
4,172
sqft
|
built
1900
1308 Harlem Blvd, Rockford, IL 61103
$-990
Cash flow
-10.3%
Cash-on-Cash Return
3.3%
Cap rate
0.6%
Rent to Value Ratio
Active
$399,500
3
bds
|
2
ba
|
1,769
sqft
|
built
2002
5309 Browns Beach Rd, Rockford, IL 61103
$-991
Cash flow
-12.9%
Cash-on-Cash Return
2.7%
Cap rate
0.7%
Rent to Value Ratio
Active
$129,900
2
bds
|
1
ba
|
759
sqft
|
built
1950
2916 Kenmore Ave, Rockford, IL 61101
$274
Cash flow
11.0%
Cash-on-Cash Return
8.2%
Cap rate
1.1%
Rent to Value Ratio
Active
$195,000
3
bds
|
3
ba
|
2,315
sqft
|
built
1967
5111 Upland Dr, Rockford, IL 61108
$-160
Cash flow
-4.3%
Cash-on-Cash Return
4.7%
Cap rate
0.8%
Rent to Value Ratio
Active
$89,900
4
bds
|
1
ba
|
1,164
sqft
|
built
1935
617 N Central Ave, Rockford, IL 61101
$537
Cash flow
31.2%
Cash-on-Cash Return
12.8%
Cap rate
1.7%
Rent to Value Ratio
Active
$80,000
4
bds
|
2
ba
|
0
sqft
|
built
1900
906 S 5th St, Rockford, IL 61104
$353
Cash flow
23.0%
Cash-on-Cash Return
11.0%
Cap rate
1.5%
Rent to Value Ratio
Active
$250,000
3
bds
|
3
ba
|
1,961
sqft
|
built
1976
4979 Sudbury Ln, Rockford, IL 61101
$-419
Cash flow
-8.7%
Cash-on-Cash Return
3.7%
Cap rate
0.6%
Rent to Value Ratio
Active
$125,000
2
bds
|
1
ba
|
999
sqft
|
built
1956
1415 Cynthia Dr, Rockford, IL 61107
$326
Cash flow
13.6%
Cash-on-Cash Return
8.8%
Cap rate
1.3%
Rent to Value Ratio
Active
$585,000
3
bds
|
3
ba
|
4,151
sqft
|
built
1963
3406 Roth Rd, Rockford, IL 61114
$-1,444
Cash flow
-12.9%
Cash-on-Cash Return
2.7%
Cap rate
0.6%
Rent to Value Ratio
Active
$250,000
3
bds
|
3
ba
|
2,680
sqft
|
built
1975
5527 Cirrus Ct, Rockford, IL 61109
$-93
Cash flow
-1.9%
Cash-on-Cash Return
5.2%
Cap rate
0.8%
Rent to Value Ratio
Active
$140,000
3
bds
|
1
ba
|
1,254
sqft
|
built
1958
1602 Pierce Ave, Rockford, IL 61103
$296
Cash flow
11.0%
Cash-on-Cash Return
8.2%
Cap rate
1.1%
Rent to Value Ratio
Active
$250,000
4
bds
|
3
ba
|
2,274
sqft
|
built
1905
1718 Camp Ave, Rockford, IL 61103
$-64
Cash flow
-1.3%
Cash-on-Cash Return
5.4%
Cap rate
0.9%
Rent to Value Ratio
Active
$350,000
3
bds
|
2
ba
|
1,922
sqft
|
built
1965
6780 Latham Rd, Rockford, IL 61101
$-978
Cash flow
-14.6%
Cash-on-Cash Return
2.3%
Cap rate
0.5%
Rent to Value Ratio
Active
$90,000
2
bds
|
1
ba
|
850
sqft
|
built
1930
1520 Myott Ave, Rockford, IL 61103
$391
Cash flow
22.7%
Cash-on-Cash Return
10.9%
Cap rate
1.6%
Rent to Value Ratio
Active
$320,000
4
bds
|
4
ba
|
2,480
sqft
|
built
1971
5797 Hoylake Dr, Rockford, IL 61107
$-260
Cash flow
-4.2%
Cash-on-Cash Return
4.7%
Cap rate
0.8%
Rent to Value Ratio
Active
$149,990
4
bds
|
1
ba
|
1,329
sqft
|
built
1946
1904 Colorado Ave, Rockford, IL 61108
$324
Cash flow
11.3%
Cash-on-Cash Return
8.3%
Cap rate
1.2%
Rent to Value Ratio
Active
$324,900
3
bds
|
3
ba
|
1,368
sqft
|
built
1998
3838 Golden Prairie Ave, Rockford, IL 61109
$-517
Cash flow
-8.3%
Cash-on-Cash Return
3.8%
Cap rate
0.7%
Rent to Value Ratio
Active
$140,000
3
bds
|
1
ba
|
960
sqft
|
built
1961
4433 School St, Rockford, IL 61101
$164
Cash flow
6.1%
Cash-on-Cash Return
7.1%
Cap rate
0.9%
Rent to Value Ratio
Active
$209,900
3
bds
|
2
ba
|
1,232
sqft
|
built
1967
2909 Kentwood Pkwy, Rockford, IL 61109
$26
Cash flow
0.6%
Cash-on-Cash Return
5.8%
Cap rate
1.0%
Rent to Value Ratio
Active
$319,600
5
bds
|
3
ba
|
2,686
sqft
|
built
1967
4801 Stage Coach Trl, Rockford, IL 61101
$-809
Cash flow
-13.2%
Cash-on-Cash Return
2.6%
Cap rate
0.5%
Rent to Value Ratio
Active
$210,000
3
bds
|
2
ba
|
1,396
sqft
|
built
2005
4208 Clearfield Ave, Rockford, IL 61109
$-6
Cash flow
-0.1%
Cash-on-Cash Return
5.6%
Cap rate
1.0%
Rent to Value Ratio
Active
$239,900
3
bds
|
2
ba
|
1,736
sqft
|
built
1978
5244 Arbutus Rd, Rockford, IL 61107
$-43
Cash flow
-0.9%
Cash-on-Cash Return
5.5%
Cap rate
0.9%
Rent to Value Ratio
Active
$234,900
3
bds
|
2
ba
|
1,624
sqft
|
built
1947
1615 S Mulford Rd, Rockford, IL 61108
$-134
Cash flow
-3.0%
Cash-on-Cash Return
5.0%
Cap rate
0.9%
Rent to Value Ratio
Active
$189,500
4
bds
|
2
ba
|
2,179
sqft
|
built
1970
1734 Camp Ave, Rockford, IL 61103
$170
Cash flow
4.7%
Cash-on-Cash Return
6.8%
Cap rate
1.1%
Rent to Value Ratio