Rockford, IL Investment Properties for Sale
Browse homes for sale and investment properties in Rockford, IL. Refine your search by price, property type, or more.
Best cash flowing properties in Rockford, IL
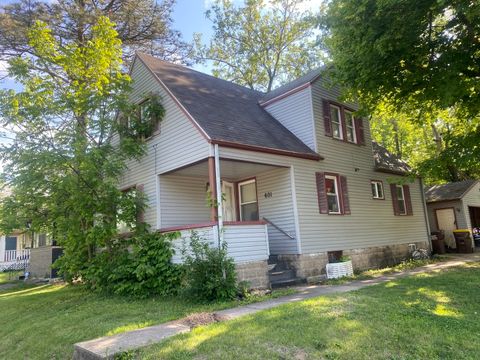
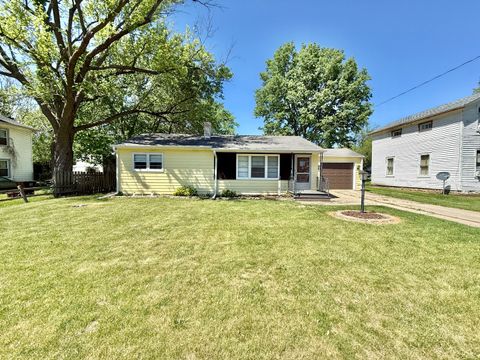
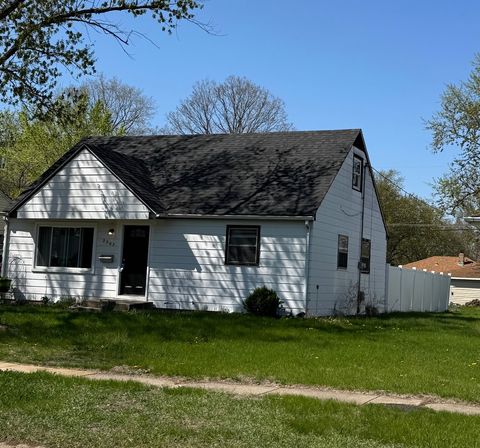
Active
$65,000
4
bds
|
1
ba
|
1,260
sqft
|
built
1920
601 S Henrietta Ave, Rockford, IL 61102
$909
Cash flow
16.3%
Cash-on-Cash Return
16.8%
Cap rate
2.3%
Rent to Value Ratio
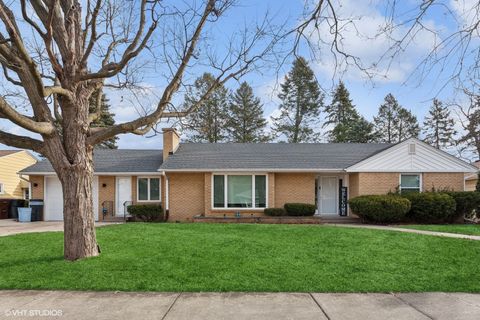
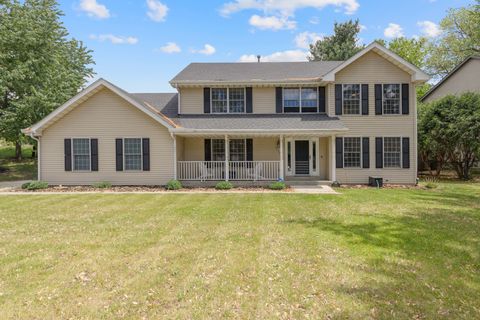
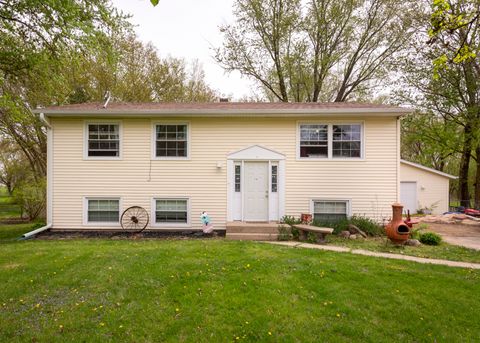
Active
$244,999
3
bds
|
3
ba
|
1,926
sqft
|
built
1956
1010 Woodland Dr, Rockford, IL 61108
$469
Cash flow
10.0%
Cash-on-Cash Return
8.0%
Cap rate
1.1%
Rent to Value Ratio
74 out of 85 properties for sale in Rockford, IL
Limited Results Shown
Create a free account, or log in to reveal all property listings and enjoy the complete experience.
Active
$275,000
3
bds
|
2
ba
|
3,696
sqft
|
built
1967
5308 Dallas Ct, Rockford, IL 61109
$-255
Cash flow
-4.8%
Cash-on-Cash Return
4.6%
Cap rate
0.7%
Rent to Value Ratio
Active
$65,000
4
bds
|
1
ba
|
1,260
sqft
|
built
1920
601 S Henrietta Ave, Rockford, IL 61102
$909
Cash flow
16.3%
Cash-on-Cash Return
16.8%
Cap rate
2.3%
Rent to Value Ratio
Active
$224,900
2
bds
|
2
ba
|
2,506
sqft
|
built
2007
2433 River Oaks Ln, Rockford, IL 61102
$-497
Cash flow
-11.5%
Cash-on-Cash Return
3.0%
Cap rate
0.7%
Rent to Value Ratio
Active
$109,900
5
bds
|
3
ba
|
0
sqft
|
built
1920
1825 S 6th St, Rockford, IL 61104
$266
Cash flow
12.6%
Cash-on-Cash Return
8.6%
Cap rate
1.3%
Rent to Value Ratio
Active
$124,900
3
bds
|
1
ba
|
1,355
sqft
|
built
1939
1602 Price St, Rockford, IL 61103
$387
Cash flow
16.2%
Cash-on-Cash Return
9.4%
Cap rate
1.4%
Rent to Value Ratio

Active
$420,000
3
bds
|
3
ba
|
2,760
sqft
|
built
1954
2501 Spring Brook Ave, Rockford, IL 61107
$-841
Cash flow
-10.4%
Cash-on-Cash Return
3.3%
Cap rate
0.5%
Rent to Value Ratio
Active
$259,900
4
bds
|
3
ba
|
1,600
sqft
|
built
2007
2123 Maxine Ln, Rockford, IL 61102
$-175
Cash flow
-3.5%
Cash-on-Cash Return
4.9%
Cap rate
0.8%
Rent to Value Ratio
Active
$244,999
3
bds
|
3
ba
|
1,926
sqft
|
built
1956
1010 Woodland Dr, Rockford, IL 61108
$469
Cash flow
10.0%
Cash-on-Cash Return
8.0%
Cap rate
1.1%
Rent to Value Ratio
Active
$139,900
3
bds
|
2
ba
|
1,328
sqft
|
built
1956
6480 11th St, Rockford, IL 61109
$304
Cash flow
11.3%
Cash-on-Cash Return
8.3%
Cap rate
1.3%
Rent to Value Ratio
Active
$159,000
2
bds
|
1
ba
|
912
sqft
|
built
1960
2390 New Milford Church Rd, Rockford, IL 61109
$117
Cash flow
3.8%
Cash-on-Cash Return
6.6%
Cap rate
1.0%
Rent to Value Ratio

Active
$179,900
5
bds
|
2
ba
|
0
sqft
|
built
1948
2006 Richmond St, Rockford, IL 61101
$-222
Cash flow
-6.4%
Cash-on-Cash Return
4.2%
Cap rate
0.7%
Rent to Value Ratio
Active
$342,500
4
bds
|
3
ba
|
2,420
sqft
|
built
2001
3739 Applewood Ln, Rockford, IL 61114
$-639
Cash flow
-9.7%
Cash-on-Cash Return
3.4%
Cap rate
0.7%
Rent to Value Ratio

Active
$410,000
3
bds
|
3
ba
|
2,350
sqft
|
built
1997
638 Roxbury Rd, Rockford, IL 61107
$-906
Cash flow
-11.5%
Cash-on-Cash Return
3.0%
Cap rate
0.7%
Rent to Value Ratio
Active
$185,000
3
bds
|
2
ba
|
989
sqft
|
built
1935
826 Barnum Rd, Rockford, IL 61109
$-103
Cash flow
-2.9%
Cash-on-Cash Return
5.0%
Cap rate
0.7%
Rent to Value Ratio
Active
$189,900
3
bds
|
2
ba
|
1,050
sqft
|
built
1965
1418 Iris Ave, Rockford, IL 61102
$55
Cash flow
1.5%
Cash-on-Cash Return
6.0%
Cap rate
0.8%
Rent to Value Ratio
Active
$139,900
3
bds
|
1
ba
|
1,119
sqft
|
built
1956
2307 Paradise Blvd, Rockford, IL 61103
$270
Cash flow
10.1%
Cash-on-Cash Return
8.0%
Cap rate
1.1%
Rent to Value Ratio

Active
$110,000
2
bds
|
1
ba
|
924
sqft
|
built
1948
616 N Day Ave, Rockford, IL 61101
$266
Cash flow
12.6%
Cash-on-Cash Return
8.6%
Cap rate
1.2%
Rent to Value Ratio

Active
$109,900
2
bds
|
1
ba
|
864
sqft
|
built
1929
1611 Ashland Ave, Rockford, IL 61101
$78
Cash flow
3.7%
Cash-on-Cash Return
6.5%
Cap rate
0.9%
Rent to Value Ratio

Active
$249,900
3
bds
|
3
ba
|
2,269
sqft
|
built
1975
3617 Fleetwood Dr, Rockford, IL 61101
$-28
Cash flow
-0.6%
Cash-on-Cash Return
5.5%
Cap rate
0.9%
Rent to Value Ratio
Active
$234,900
4
bds
|
2
ba
|
1,092
sqft
|
built
1970
7912 Wagon Wheel Ln, Rockford, IL 61109
$130
Cash flow
2.9%
Cash-on-Cash Return
6.3%
Cap rate
0.8%
Rent to Value Ratio

Active
$285,000
3
bds
|
3
ba
|
3,122
sqft
|
built
1900
1326 Cosper Ave, Rockford, IL 61107
$101
Cash flow
1.8%
Cash-on-Cash Return
6.1%
Cap rate
1.0%
Rent to Value Ratio
Active
$609,000
3
bds
|
3
ba
|
4,151
sqft
|
built
1963
3406 Roth Rd, Rockford, IL 61114
$-1,558
Cash flow
-13.3%
Cash-on-Cash Return
2.6%
Cap rate
0.6%
Rent to Value Ratio

Active
$599,900
4
bds
|
4
ba
|
4,454
sqft
|
built
2004
921 Tivoli Dr, Rockford, IL 61107
$-1,858
Cash flow
-16.2%
Cash-on-Cash Return
2.0%
Cap rate
0.5%
Rent to Value Ratio

Active
$192,000
2
bds
|
2
ba
|
1,035
sqft
|
built
1954
112 Dawn Ave, Rockford, IL 61107
$4
Cash flow
0.1%
Cash-on-Cash Return
5.7%
Cap rate
0.8%
Rent to Value Ratio
Active
$149,000
3
bds
|
1
ba
|
1,512
sqft
|
built
1960
120 Ashley Ave, Rockford, IL 61102
$283
Cash flow
9.9%
Cash-on-Cash Return
8.0%
Cap rate
1.1%
Rent to Value Ratio

Active
$125,000
2
bds
|
1
ba
|
1,224
sqft
|
built
1930
646 15th St, Rockford, IL 61104
$129
Cash flow
5.4%
Cash-on-Cash Return
6.9%
Cap rate
1.0%
Rent to Value Ratio

Active
$260,000
3
bds
|
2
ba
|
2,000
sqft
|
built
1956
606 N Alpine Rd, Rockford, IL 61107
$-84
Cash flow
-1.7%
Cash-on-Cash Return
5.3%
Cap rate
0.7%
Rent to Value Ratio
Active
$94,900
3
bds
|
2
ba
|
1,249
sqft
|
built
1928
437 Irving Ave, Rockford, IL 61101
$463
Cash flow
25.5%
Cash-on-Cash Return
11.5%
Cap rate
1.5%
Rent to Value Ratio

Active
$112,000
3
bds
|
3
ba
|
0
sqft
|
built
1900
212 N 4th St, Rockford, IL 61107
$300
Cash flow
14.0%
Cash-on-Cash Return
8.9%
Cap rate
1.3%
Rent to Value Ratio
Active
$199,990
7
bds
|
5
ba
|
0
sqft
|
built
1900
628 9th St, Rockford, IL 61104
$-148
Cash flow
-3.9%
Cash-on-Cash Return
4.8%
Cap rate
0.7%
Rent to Value Ratio
Active
$575,000
4
bds
|
3
ba
|
4,076
sqft
|
built
1974
8465 S Mulford Rd, Rockford, IL 61109
$-1,550
Cash flow
-14.1%
Cash-on-Cash Return
2.4%
Cap rate
0.5%
Rent to Value Ratio

Active
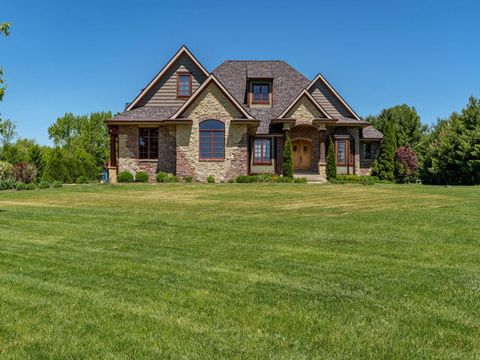
$2,700,000
5
bds
|
7
ba
|
10,000
sqft
|
built
1949
1850 N Mulford Rd, Rockford, IL 61107
$-13,068
Cash flow
-25.3%
Cash-on-Cash Return
-0.1%
Cap rate
0.1%
Rent to Value Ratio
Active
$386,900
4
bds
|
3
ba
|
2,650
sqft
|
built
1961
5588 35th St, Rockford, IL 61109
$-646
Cash flow
-8.7%
Cash-on-Cash Return
3.7%
Cap rate
0.6%
Rent to Value Ratio
Active
$1,199,000
4
bds
|
5
ba
|
6,187
sqft
|
built
2008
6871 Montague Rd, Rockford, IL 61102
$-4,676
Cash flow
-20.3%
Cash-on-Cash Return
1.0%
Cap rate
0.3%
Rent to Value Ratio