Sugar Land, TX Investment Properties for Sale
Browse homes for sale and investment properties in Sugar Land, TX. Refine your search by price, property type, or more.
Best cash flowing properties in Sugar Land, TX

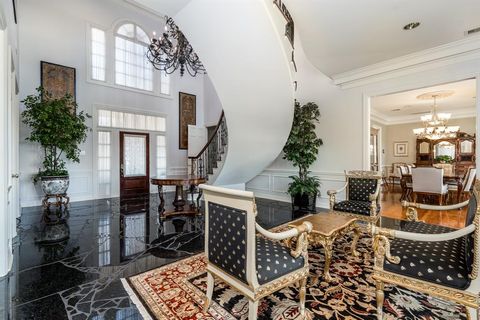
Active
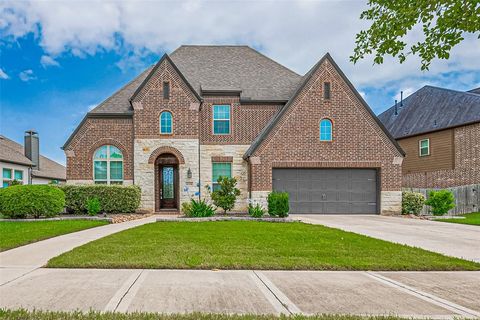
$293,000
3
bds
|
0
ba
|
1,329
sqft
|
built
1983
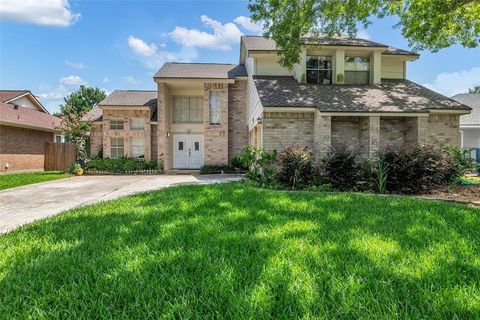
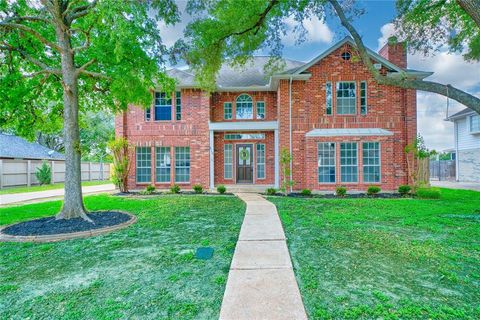
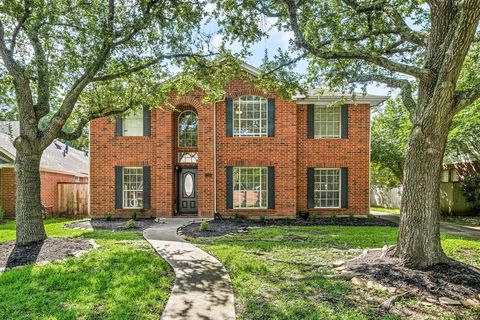
3938 Kitchen Hill Ln, Sugar Land, TX 77479
$-200
Cash flow
-3.6%
Cash-on-Cash Return
5.4%
Cap rate
0.7%
Rent to Value Ratio
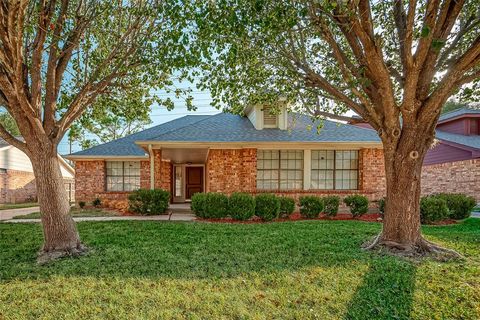
Active
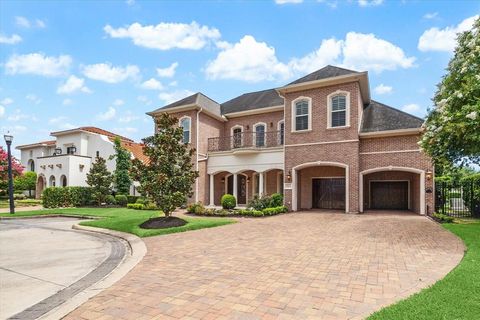
$330,000
4
bds
|
0
ba
|
2,653
sqft
|
built
1973
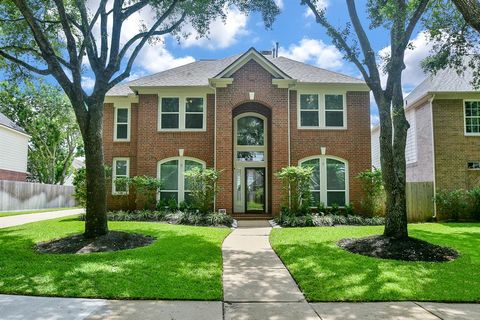
1403 Maygrove Dr, Sugar Land, TX 77498
$-320
Cash flow
-5.1%
Cash-on-Cash Return
4.5%
Cap rate
0.8%
Rent to Value Ratio
425 out of 432 properties for sale in Sugar Land, TX
Limited Results Shown
Create a free account, or log in to reveal all property listings and enjoy the complete experience.
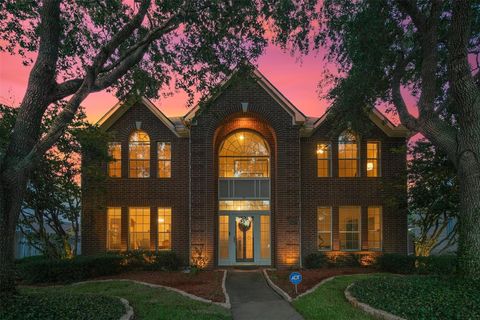
Active
$425,000
4
bds
|
0
ba
|
2,089
sqft
|
built
1984
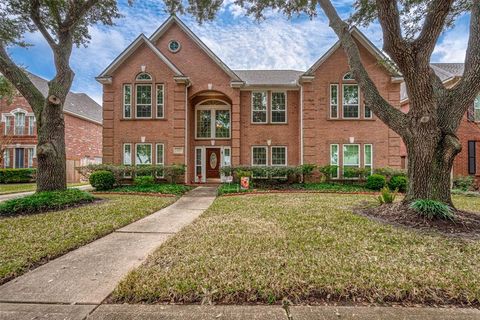
3327 Larkwood Ln, Sugar Land, TX 77479
$-570
Cash flow
-7.0%
Cash-on-Cash Return
4.7%
Cap rate
0.6%
Rent to Value Ratio
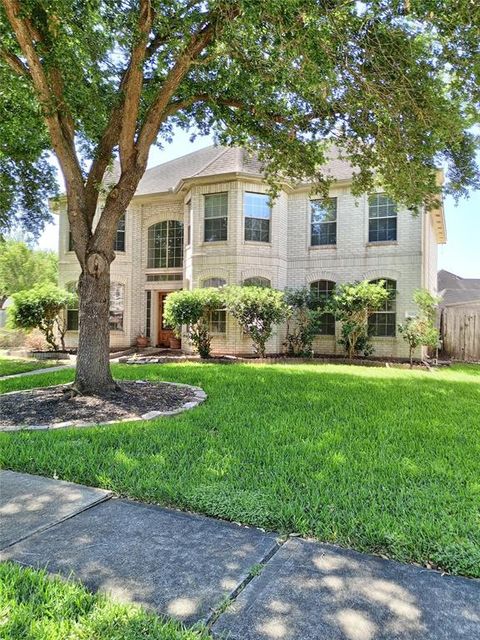
Active
$765,000
5
bds
|
0
ba
|
4,603
sqft
|
built
1985
102 Blancroft Ct, Sugar Land, TX 77478
$-2,544
Cash flow
-17.4%
Cash-on-Cash Return
2.3%
Cap rate
0.5%
Rent to Value Ratio
Active
$417,500
3
bds
|
0
ba
|
2,395
sqft
|
built
1990
6719 Shady Ln, Sugar Land, TX 77479
$-1,160
Cash flow
-14.5%
Cash-on-Cash Return
2.9%
Cap rate
0.6%
Rent to Value Ratio

Active
$495,000
4
bds
|
0
ba
|
3,719
sqft
|
built
2001
13214 Dusty Grove Ln, Sugar Land, TX 77498
$-1,359
Cash flow
-14.3%
Cash-on-Cash Return
3.0%
Cap rate
0.6%
Rent to Value Ratio
Active
$375,000
4
bds
|
0
ba
|
2,454
sqft
|
built
1984
3714 Green Fields Dr, Sugar Land, TX 77479
$-941
Cash flow
-13.1%
Cash-on-Cash Return
3.3%
Cap rate
0.6%
Rent to Value Ratio

Active
$278,000
3
bds
|
0
ba
|
1,499
sqft
|
built
1973
13610 Lynnwood Ln, Sugar Land, TX 77498
$-680
Cash flow
-12.8%
Cash-on-Cash Return
3.3%
Cap rate
0.6%
Rent to Value Ratio

Active
$599,500
3
bds
|
0
ba
|
2,587
sqft
|
built
2008
910 Floriencia St, Sugar Land, TX 77479
$-1,059
Cash flow
-9.2%
Cash-on-Cash Return
4.1%
Cap rate
0.5%
Rent to Value Ratio

Active
$350,000
3
bds
|
0
ba
|
1,888
sqft
|
built
1976
13526 Sherwood St, Sugar Land, TX 77498
$-904
Cash flow
-13.5%
Cash-on-Cash Return
3.2%
Cap rate
0.6%
Rent to Value Ratio
Active
$560,000
4
bds
|
0
ba
|
3,023
sqft
|
built
1998
1623 Heddon Falls Dr, Sugar Land, TX 77479
$-1,710
Cash flow
-15.9%
Cash-on-Cash Return
2.6%
Cap rate
0.6%
Rent to Value Ratio

Active
$725,000
5
bds
|
0
ba
|
3,412
sqft
|
built
1991
311 Lake Bend Dr, Sugar Land, TX 77479
$-2,368
Cash flow
-17.0%
Cash-on-Cash Return
2.3%
Cap rate
0.5%
Rent to Value Ratio

Active
$224,000
2
bds
|
0
ba
|
1,013
sqft
|
built
1982
17002 Rippling Mill Dr, Sugar Land, TX 77498
$-385
Cash flow
-9.0%
Cash-on-Cash Return
4.2%
Cap rate
0.8%
Rent to Value Ratio

Active
$320,000
1
bds
|
0
ba
|
993
sqft
|
built
2004
2299 Lone Star Dr, Sugar Land, TX 77479
$-1,280
Cash flow
-20.9%
Cash-on-Cash Return
1.5%
Cap rate
0.6%
Rent to Value Ratio
Active
$760,000
5
bds
|
0
ba
|
3,775
sqft
|
built
1994
4706 April Meadow Way, Sugar Land, TX 77479
$-2,574
Cash flow
-17.7%
Cash-on-Cash Return
2.2%
Cap rate
0.5%
Rent to Value Ratio
Active
$315,500
1
bds
|
0
ba
|
930
sqft
|
built
2004
2299 Lone Star Dr, Sugar Land, TX 77479
$-867
Cash flow
-14.3%
Cash-on-Cash Return
3.0%
Cap rate
0.6%
Rent to Value Ratio

Active
$539,000
4
bds
|
0
ba
|
3,010
sqft
|
built
1989
4607 Colony Hills Dr, Sugar Land, TX 77479
$-957
Cash flow
-9.3%
Cash-on-Cash Return
4.1%
Cap rate
0.5%
Rent to Value Ratio

Active
$630,000
4
bds
|
0
ba
|
3,356
sqft
|
built
1991
4027 Austin Meadow Dr, Sugar Land, TX 77479
$-1,846
Cash flow
-15.3%
Cash-on-Cash Return
2.7%
Cap rate
0.6%
Rent to Value Ratio

Active
$1,299,000
5
bds
|
0
ba
|
5,074
sqft
|
built
2011
2915 Sentry Oak Way, Sugar Land, TX 77479
$-5,052
Cash flow
-20.3%
Cash-on-Cash Return
1.6%
Cap rate
0.4%
Rent to Value Ratio
Active
$1,550,000
5
bds
|
0
ba
|
6,302
sqft
|
built
1984
45 Queen Mary Ct, Sugar Land, TX 77479
$-4,904
Cash flow
-16.5%
Cash-on-Cash Return
2.5%
Cap rate
0.5%
Rent to Value Ratio
Active
$429,000
4
bds
|
0
ba
|
2,148
sqft
|
built
1982
2810 Pineleaf Dr, Sugar Land, TX 77479
$-1,077
Cash flow
-13.1%
Cash-on-Cash Return
3.3%
Cap rate
0.6%
Rent to Value Ratio

Active
$629,000
3
bds
|
0
ba
|
2,795
sqft
|
built
2017
4926 Thunder Creek Ln, Sugar Land, TX 77479
$-1,972
Cash flow
-16.4%
Cash-on-Cash Return
2.5%
Cap rate
0.5%
Rent to Value Ratio
Active
$445,000
4
bds
|
0
ba
|
2,961
sqft
|
built
1998
2627 Brazos Ridge Dr, Sugar Land, TX 77479
$-1,192
Cash flow
-14.0%
Cash-on-Cash Return
3.0%
Cap rate
0.7%
Rent to Value Ratio
Active
$415,999
5
bds
|
0
ba
|
3,190
sqft
|
built
2004
5014 Misty Park Ln, Sugar Land, TX 77479
$-1,221
Cash flow
-15.3%
Cash-on-Cash Return
2.7%
Cap rate
0.7%
Rent to Value Ratio
Active
$529,998
4
bds
|
0
ba
|
3,309
sqft
|
built
1988
619 Green Belt Dr, Sugar Land, TX 77498
$-2,161
Cash flow
-21.3%
Cash-on-Cash Return
1.4%
Cap rate
0.4%
Rent to Value Ratio
Active
$675,000
5
bds
|
0
ba
|
3,580
sqft
|
built
1990
1714 Forestlake Dr, Sugar Land, TX 77479
$-1,792
Cash flow
-13.9%
Cash-on-Cash Return
3.1%
Cap rate
0.6%
Rent to Value Ratio
Active
$479,900
4
bds
|
0
ba
|
3,065
sqft
|
built
1982
1709 Coles Farm Dr, Sugar Land, TX 77478
$-1,089
Cash flow
-11.8%
Cash-on-Cash Return
3.5%
Cap rate
0.6%
Rent to Value Ratio
Active
$499,000
4
bds
|
0
ba
|
2,741
sqft
|
built
1992
1123 Misty Lake Dr, Sugar Land, TX 77498
$-1,377
Cash flow
-14.4%
Cash-on-Cash Return
3.0%
Cap rate
0.6%
Rent to Value Ratio

Active
$385,000
3
bds
|
0
ba
|
2,174
sqft
|
built
2001
4823 Zachary Ln, Sugar Land, TX 77479
$-986
Cash flow
-13.4%
Cash-on-Cash Return
3.2%
Cap rate
0.6%
Rent to Value Ratio
Active
$2,999,800
6
bds
|
0
ba
|
6,688
sqft
|
built
2000
19 Ellicott Way, Sugar Land, TX 77479
$-11,459
Cash flow
-19.9%
Cash-on-Cash Return
1.7%
Cap rate
0.3%
Rent to Value Ratio
Active
$319,900
3
bds
|
0
ba
|
1,732
sqft
|
built
2004
1742 Pepper Hill Ln, Sugar Land, TX 77479
$-551
Cash flow
-9.0%
Cash-on-Cash Return
3.6%
Cap rate
0.7%
Rent to Value Ratio
Active
$755,000
4
bds
|
0
ba
|
3,709
sqft
|
built
2010
7022 Tiedmann Park Way, Sugar Land, TX 77479
$-2,324
Cash flow
-16.1%
Cash-on-Cash Return
2.0%
Cap rate
0.5%
Rent to Value Ratio
Active
$549,900
4
bds
|
0
ba
|
3,882
sqft
|
built
2001
2026 Avana Glen Ln, Sugar Land, TX 77498
$-1,447
Cash flow
-13.7%
Cash-on-Cash Return
2.5%
Cap rate
0.5%
Rent to Value Ratio
Active
$454,900
4
bds
|
0
ba
|
2,463
sqft
|
built
1994
1206 Rabbs Xing, Sugar Land, TX 77479
$-1,228
Cash flow
-14.1%
Cash-on-Cash Return
3.0%
Cap rate
0.6%
Rent to Value Ratio
Active
$260,000
3
bds
|
0
ba
|
1,584
sqft
|
built
1978
10511 Spanish Grant Dr, Sugar Land, TX 77498
$-478
Cash flow
-9.6%
Cash-on-Cash Return
4.1%
Cap rate
0.7%
Rent to Value Ratio
Active
$419,900
4
bds
|
0
ba
|
2,654
sqft
|
built
1978
2815 Field Line Dr, Sugar Land, TX 77479
$-998
Cash flow
-12.4%
Cash-on-Cash Return
3.4%
Cap rate
0.7%
Rent to Value Ratio
Active
$379,800
4
bds
|
0
ba
|
2,114
sqft
|
built
1986
2915 Cotton Stock Dr, Sugar Land, TX 77479
$-1,064
Cash flow
-14.6%
Cash-on-Cash Return
2.9%
Cap rate
0.6%
Rent to Value Ratio
Active
$699,000
5
bds
|
0
ba
|
3,843
sqft
|
built
2016
6518 Nicholas Trl, Sugar Land, TX 77479
$-2,438
Cash flow
-18.2%
Cash-on-Cash Return
2.1%
Cap rate
0.5%
Rent to Value Ratio
Active
$2,370,000
3
bds
|
0
ba
|
5,542
sqft
|
built
2008
15611 Oyster Cove Dr, Sugar Land, TX 77478
$-10,047
Cash flow
-22.1%
Cash-on-Cash Return
1.2%
Cap rate
0.3%
Rent to Value Ratio
Active
$540,000
4
bds
|
0
ba
|
2,769
sqft
|
built
1992
4910 Canterbury Ln, Sugar Land, TX 77479
$-1,630
Cash flow
-15.7%
Cash-on-Cash Return
2.6%
Cap rate
0.6%
Rent to Value Ratio