Tremonton, UT Investment Properties for Sale
Browse homes for sale and investment properties in Tremonton, UT. Refine your search by price, property type, or more.
Best cash flowing properties in Tremonton, UT
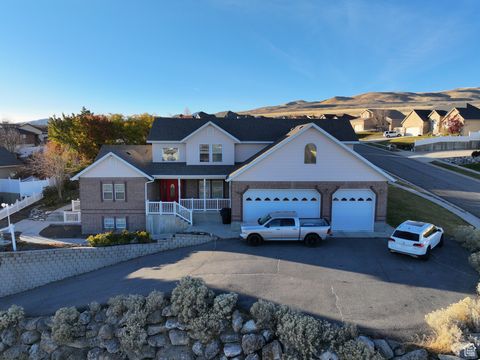
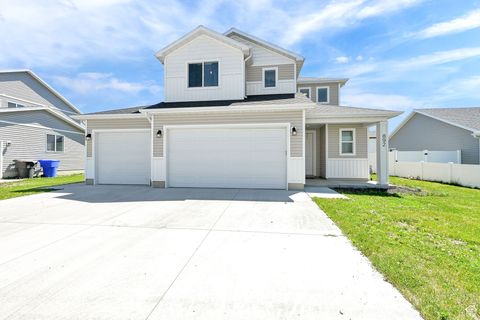
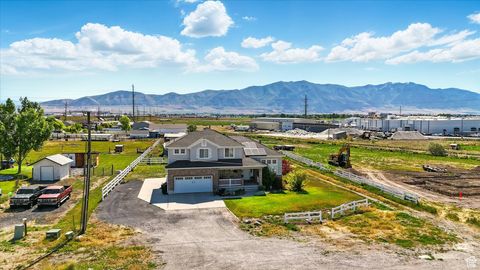
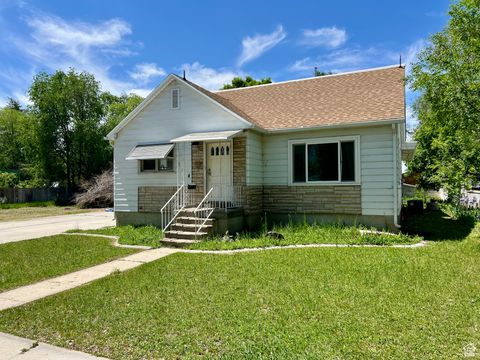
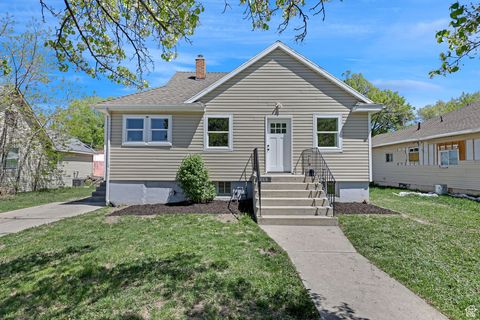
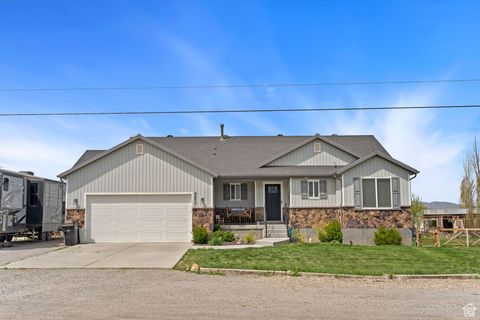
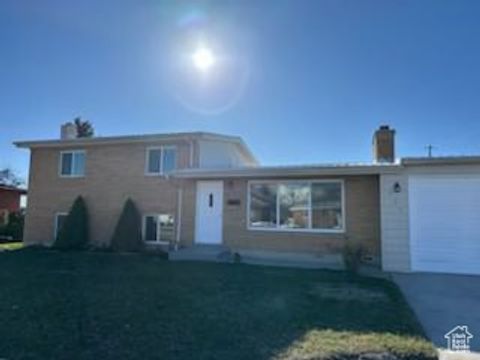
Active
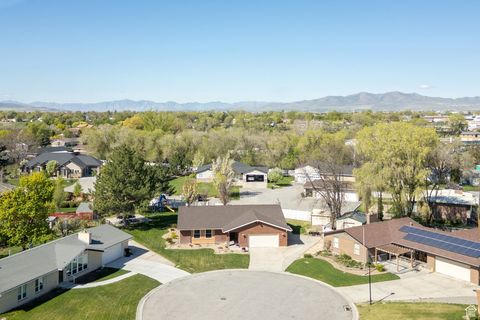
$529,000
4
bds
|
4
ba
|
3,915
sqft
|
built
1999
1035 N Valley View Dr, Tremonton, UT 84337
$-88
Cash flow
-0.9%
Cash-on-Cash Return
5.5%
Cap rate
0.7%
Rent to Value Ratio
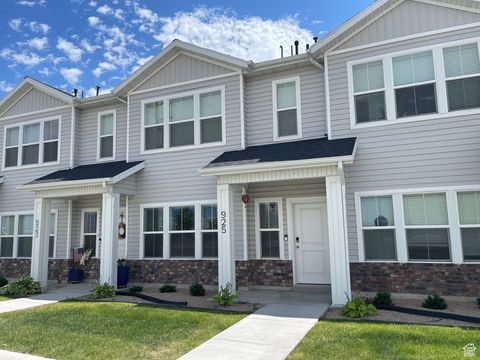
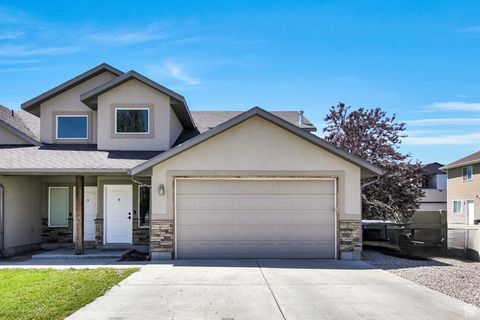
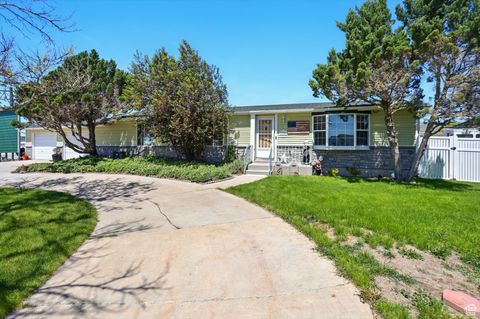
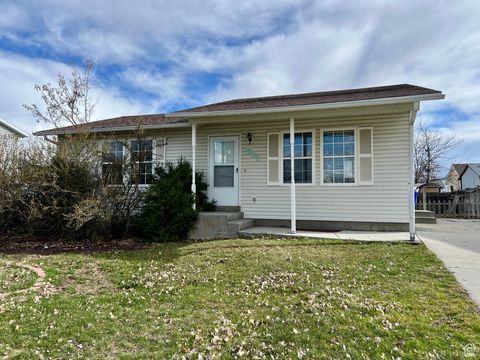
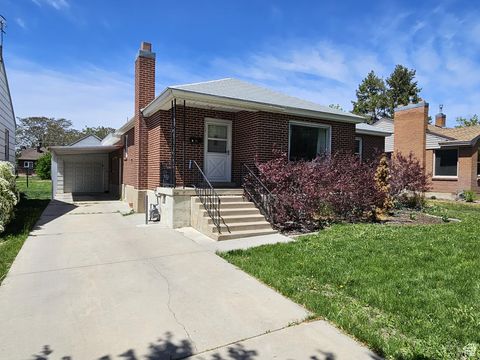
Active
$295,000
3
bds
|
3
ba
|
1,476
sqft
|
built
2021
925 W 1000 N, Tremonton, UT 84337
$-277
Cash flow
-4.9%
Cash-on-Cash Return
4.6%
Cap rate
0.7%
Rent to Value Ratio
44 out of 50 properties for sale in Tremonton, UT
Limited Results Shown
Create a free account, or log in to reveal all property listings and enjoy the complete experience.
Active
$669,000
5
bds
|
3
ba
|
3,948
sqft
|
built
2006
2618 W Mountain Rd, Tremonton, UT 84337
$-1,765
Cash flow
-13.8%
Cash-on-Cash Return
2.5%
Cap rate
0.4%
Rent to Value Ratio
Active
$490,000
3
bds
|
2
ba
|
2,002
sqft
|
built
1945
11395 N 4400 W, Tremonton, UT 84337
$-1,588
Cash flow
-16.9%
Cash-on-Cash Return
2.4%
Cap rate
0.3%
Rent to Value Ratio
Active
$425,000
3
bds
|
3
ba
|
1,547
sqft
|
built
2021
892 N 900 W, Tremonton, UT 84337
$-830
Cash flow
-10.2%
Cash-on-Cash Return
3.3%
Cap rate
0.5%
Rent to Value Ratio
Active
$325,000
3
bds
|
3
ba
|
1,560
sqft
|
built
2010
429 W 350 N, Tremonton, UT 84337
$-789
Cash flow
-12.7%
Cash-on-Cash Return
2.8%
Cap rate
0.4%
Rent to Value Ratio
Active
$333,000
3
bds
|
2
ba
|
2,191
sqft
|
built
1960
960 N 100 W, Tremonton, UT 84337
$-575
Cash flow
-9.0%
Cash-on-Cash Return
3.6%
Cap rate
0.5%
Rent to Value Ratio
Active
$380,000
3
bds
|
2
ba
|
1,650
sqft
|
built
1994
834 S 660 W, Tremonton, UT 84337
$-985
Cash flow
-13.5%
Cash-on-Cash Return
2.6%
Cap rate
0.4%
Rent to Value Ratio
Active
$580,000
4
bds
|
3
ba
|
2,411
sqft
|
built
2000
913 N 2300 W, Tremonton, UT 84337
$-1,358
Cash flow
-12.2%
Cash-on-Cash Return
2.9%
Cap rate
0.4%
Rent to Value Ratio
Active
$675,000
4
bds
|
3
ba
|
3,036
sqft
|
built
1942
102 S 1000 W, Tremonton, UT 84337
$-1,780
Cash flow
-13.8%
Cash-on-Cash Return
2.5%
Cap rate
0.4%
Rent to Value Ratio
Active
$495,000
5
bds
|
2
ba
|
3,452
sqft
|
built
1921
10205 W 10400 N, Tremonton, UT 84337
$-583
Cash flow
-6.1%
Cash-on-Cash Return
4.3%
Cap rate
0.6%
Rent to Value Ratio
Active
$325,000
3
bds
|
3
ba
|
1,590
sqft
|
built
2021
200 W 1200 S, Tremonton, UT 84337
$-928
Cash flow
-14.9%
Cash-on-Cash Return
2.3%
Cap rate
0.4%
Rent to Value Ratio

Active
$379,000
5
bds
|
2
ba
|
2,026
sqft
|
built
1975
981 N Tremont St, Tremonton, UT 84337
$-715
Cash flow
-9.8%
Cash-on-Cash Return
3.4%
Cap rate
0.5%
Rent to Value Ratio
Active
$425,000
3
bds
|
2
ba
|
2,380
sqft
|
built
1940
144 S 100 W, Tremonton, UT 84337
$-1,124
Cash flow
-13.8%
Cash-on-Cash Return
2.5%
Cap rate
0.4%
Rent to Value Ratio
Active
$510,000
3
bds
|
2
ba
|
1,344
sqft
|
built
1972
2226 W 1000 N, Tremonton, UT 84337
$-1,373
Cash flow
-14.0%
Cash-on-Cash Return
2.4%
Cap rate
0.3%
Rent to Value Ratio
Active
$409,900
4
bds
|
2
ba
|
2,502
sqft
|
built
1962
730 N 100 E, Tremonton, UT 84337
$-1,197
Cash flow
-15.2%
Cash-on-Cash Return
2.2%
Cap rate
0.3%
Rent to Value Ratio
Active
$355,000
3
bds
|
3
ba
|
2,053
sqft
|
built
2021
250 W 1200 S, Tremonton, UT 84337
$-1,028
Cash flow
-15.1%
Cash-on-Cash Return
2.2%
Cap rate
0.4%
Rent to Value Ratio
Active
$369,900
5
bds
|
2
ba
|
1,628
sqft
|
built
1936
260 N 100 W, Tremonton, UT 84337
$-849
Cash flow
-12.0%
Cash-on-Cash Return
2.9%
Cap rate
0.4%
Rent to Value Ratio
Active
$290,000
3
bds
|
3
ba
|
1,654
sqft
|
built
2007
855 W 350 N, Tremonton, UT 84337
$-505
Cash flow
-9.1%
Cash-on-Cash Return
3.6%
Cap rate
0.6%
Rent to Value Ratio
Active
$510,000
4
bds
|
4
ba
|
3,590
sqft
|
built
1975
720 N 300 E, Tremonton, UT 84337
$-964
Cash flow
-9.9%
Cash-on-Cash Return
3.4%
Cap rate
0.5%
Rent to Value Ratio
Active
$330,000
3
bds
|
2
ba
|
1,599
sqft
|
built
1962
463 S 700 W, Tremonton, UT 84337
$-747
Cash flow
-11.8%
Cash-on-Cash Return
3.0%
Cap rate
0.4%
Rent to Value Ratio
Active
$519,000
5
bds
|
4
ba
|
3,620
sqft
|
built
1976
518 Wendy Way, Tremonton, UT 84337
$-756
Cash flow
-7.6%
Cash-on-Cash Return
3.9%
Cap rate
0.5%
Rent to Value Ratio
Active
$345,000
3
bds
|
2
ba
|
1,758
sqft
|
built
1950
285 S 100 E, Tremonton, UT 84337
$-806
Cash flow
-12.2%
Cash-on-Cash Return
2.9%
Cap rate
0.4%
Rent to Value Ratio

Active
$349,900
3
bds
|
3
ba
|
1,986
sqft
|
built
2021
250 W 1200 S, Tremonton, UT 84337
$-1,004
Cash flow
-15.0%
Cash-on-Cash Return
2.2%
Cap rate
0.4%
Rent to Value Ratio
Active
$499,000
3
bds
|
3
ba
|
2,213
sqft
|
built
2022
889 N 900 W, Tremonton, UT 84337
$-727
Cash flow
-7.6%
Cash-on-Cash Return
3.9%
Cap rate
0.5%
Rent to Value Ratio
Active
$369,900
3
bds
|
3
ba
|
2,060
sqft
|
built
2023
200 W 1200 S, Tremonton, UT 84337
$-1,109
Cash flow
-15.6%
Cash-on-Cash Return
2.1%
Cap rate
0.4%
Rent to Value Ratio
Active
$595,000
5
bds
|
3
ba
|
3,200
sqft
|
built
2011
9457 N 4800 W, Tremonton, UT 84337
$-1,894
Cash flow
-16.6%
Cash-on-Cash Return
1.9%
Cap rate
0.3%
Rent to Value Ratio
Active
$339,000
4
bds
|
2
ba
|
1,480
sqft
|
built
1908
105 N 100 W, Tremonton, UT 84337
$-767
Cash flow
-11.8%
Cash-on-Cash Return
3.0%
Cap rate
0.4%
Rent to Value Ratio
Active
$540,000
7
bds
|
3
ba
|
3,146
sqft
|
built
2006
680 N 980 W, Tremonton, UT 84337
$-1,618
Cash flow
-15.6%
Cash-on-Cash Return
2.1%
Cap rate
0.3%
Rent to Value Ratio

Active
$389,900
5
bds
|
3
ba
|
2,509
sqft
|
built
2021
250 W 1200 S, Tremonton, UT 84337
$-1,191
Cash flow
-15.9%
Cash-on-Cash Return
2.0%
Cap rate
0.4%
Rent to Value Ratio

Active
$469,000
5
bds
|
3
ba
|
2,372
sqft
|
built
2010
458 W 275 S, Tremonton, UT 84337
$-1,164
Cash flow
-12.9%
Cash-on-Cash Return
2.7%
Cap rate
0.4%
Rent to Value Ratio

Active
$499,900
6
bds
|
3
ba
|
3,869
sqft
|
built
1975
485 N 400 W, Tremonton, UT 84337
$-661
Cash flow
-6.9%
Cash-on-Cash Return
4.1%
Cap rate
0.6%
Rent to Value Ratio
Active
$325,000
3
bds
|
1
ba
|
1,872
sqft
|
built
1993
530 W 800 S, Tremonton, UT 84337
$-733
Cash flow
-11.8%
Cash-on-Cash Return
3.0%
Cap rate
0.4%
Rent to Value Ratio

Active
$325,000
3
bds
|
2
ba
|
1,295
sqft
|
built
1947
219 N 300 W, Tremonton, UT 84337
$-433
Cash flow
-7.0%
Cash-on-Cash Return
4.1%
Cap rate
0.6%
Rent to Value Ratio
Active
$384,900
3
bds
|
2
ba
|
1,900
sqft
|
built
1959
789 N 100 W, Tremonton, UT 84337
$-911
Cash flow
-12.3%
Cash-on-Cash Return
2.8%
Cap rate
0.4%
Rent to Value Ratio

Active
$234,900
2
bds
|
2
ba
|
955
sqft
|
built
2019
483 N 2650 W, Tremonton, UT 84337
$-350
Cash flow
-7.8%
Cash-on-Cash Return
3.9%
Cap rate
0.6%
Rent to Value Ratio

Active
$665,000
6
bds
|
4
ba
|
3,834
sqft
|
built
2005
955 W 720 N, Tremonton, UT 84337
$-1,663
Cash flow
-13.0%
Cash-on-Cash Return
2.7%
Cap rate
0.4%
Rent to Value Ratio

Active
$237,000
2
bds
|
2
ba
|
955
sqft
|
built
2019
483 N 2650 W, Tremonton, UT 84337
$-360
Cash flow
-7.9%
Cash-on-Cash Return
3.9%
Cap rate
0.6%
Rent to Value Ratio
Active
$375,000
4
bds
|
2
ba
|
2,749
sqft
|
built
1948
423 N 200 E, Tremonton, UT 84337
$-387
Cash flow
-5.4%
Cash-on-Cash Return
4.4%
Cap rate
0.6%
Rent to Value Ratio
Active
$534,900
4
bds
|
4
ba
|
4,084
sqft
|
built
1949
575 N 300 E, Tremonton, UT 84337
$-868
Cash flow
-8.5%
Cash-on-Cash Return
3.7%
Cap rate
0.6%
Rent to Value Ratio