Aransas County Investment Properties for Sale
Browse homes for sale and investment properties in Aransas County. Refine your search by price, property type, or more.
Best cash flowing properties in Aransas County
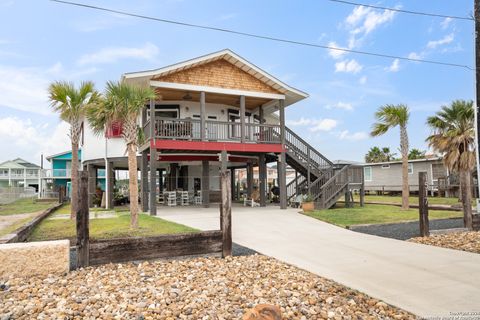
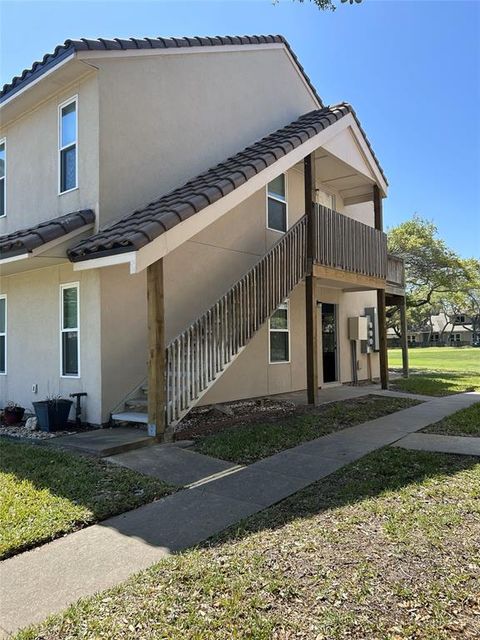
Active
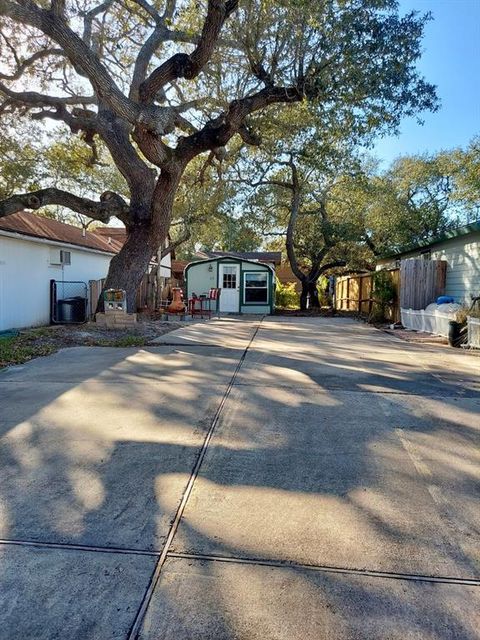
$85,000
1
bds
|
1
ba
|
240
sqft
|
built
2002
15 Saint Charles Bay Dr, Rockport, TX 78382
$180
Cash flow
11.0%
Cash-on-Cash Return
8.2%
Cap rate
1.1%
Rent to Value Ratio
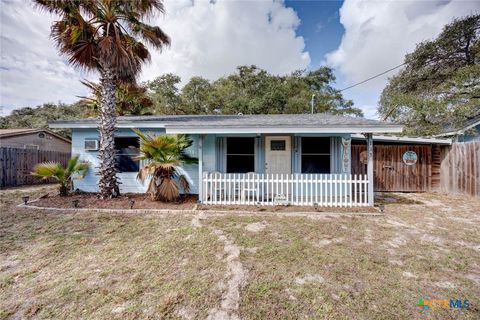
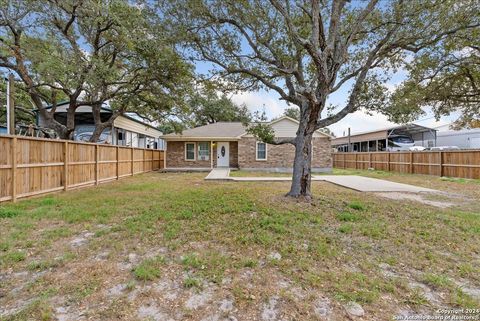
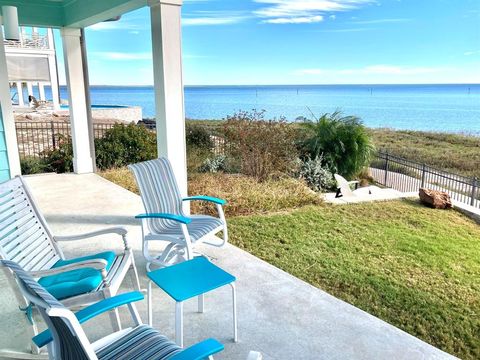
Active
$219,000
2
bds
|
1
ba
|
768
sqft
|
built
1962
713 N Kossuth St, Rockport, TX 78382
$-104
Cash flow
-2.5%
Cash-on-Cash Return
5.1%
Cap rate
0.7%
Rent to Value Ratio
44 out of 67 properties for sale in Aransas County
Limited Results Shown
Create a free account, or log in to reveal all property listings and enjoy the complete experience.
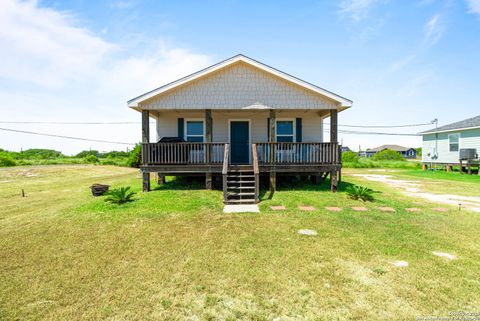
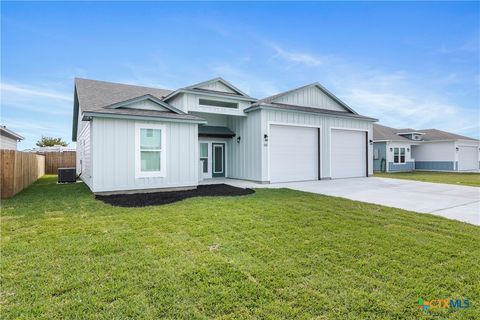
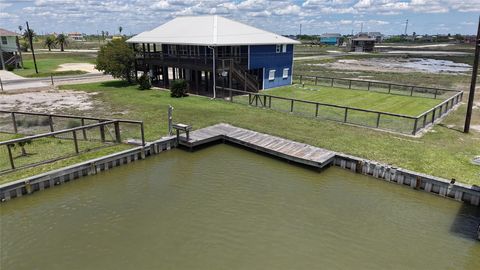
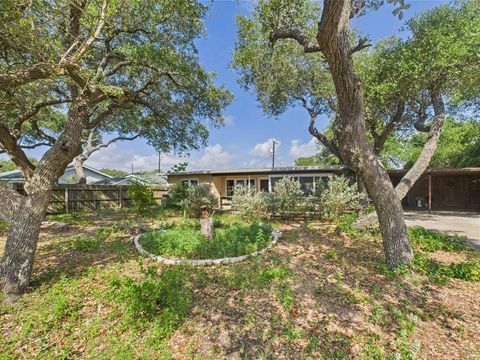
Active
$290,000
3
bds
|
2
ba
|
1,092
sqft
|
built
2021
274 Post Oak Ln, Rockport, TX 78382
$-431
Cash flow
-7.8%
Cash-on-Cash Return
3.9%
Cap rate
0.6%
Rent to Value Ratio
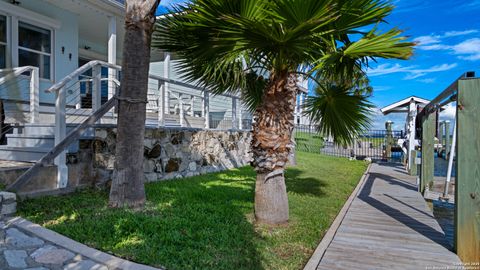
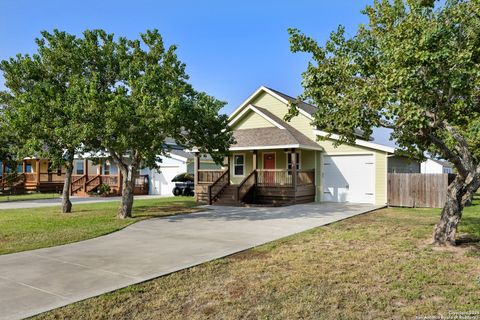
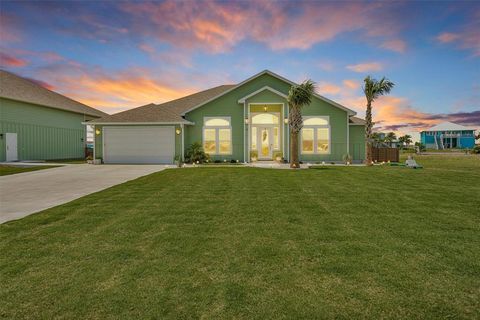
Active
$989,000
4
bds
|
4
ba
|
2,454
sqft
|
built
1999
303 Square Rigger St, Rockport, TX 78382
$-2,681
Cash flow
-14.1%
Cash-on-Cash Return
2.4%
Cap rate
0.5%
Rent to Value Ratio
Active
$524,500
4
bds
|
3
ba
|
2,336
sqft
|
built
2015
142 Vercie St, Rockport, TX 78382
$-996
Cash flow
-9.9%
Cash-on-Cash Return
3.4%
Cap rate
0.5%
Rent to Value Ratio
Active
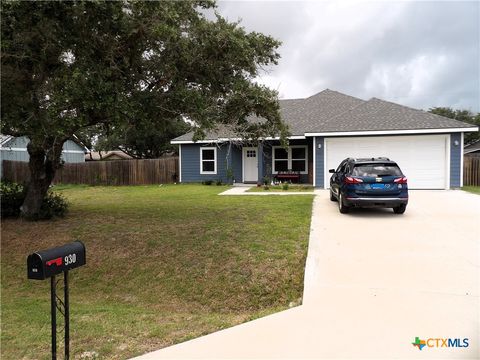
$350,000
3
bds
|
2
ba
|
1,340
sqft
|
built
2021
930 Redwood Ave, Rockport, TX 78382
$-276
Cash flow
-4.1%
Cash-on-Cash Return
4.7%
Cap rate
0.6%
Rent to Value Ratio
Active
$389,999
4
bds
|
3
ba
|
2,373
sqft
|
built
2001
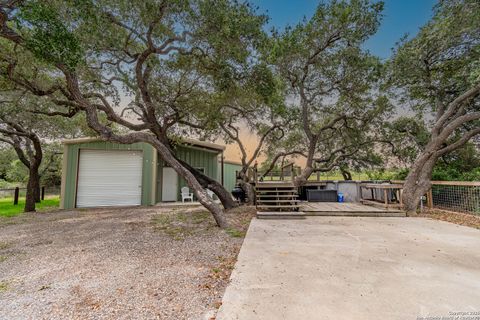
431 Shaver Rd, Aransas Pass, TX 78336
$-681
Cash flow
-9.1%
Cash-on-Cash Return
3.6%
Cap rate
0.6%
Rent to Value Ratio
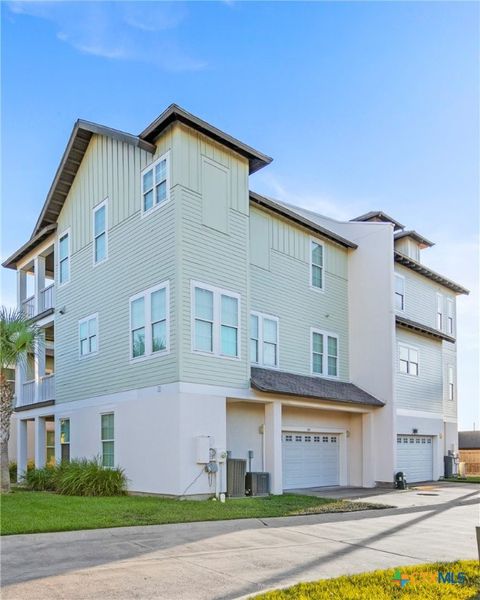
Active
$1,225,000
4
bds
|
4
ba
|
1,797
sqft
|
built
2019
45 Belaire Dr, Rockport, TX 78382
$-4,538
Cash flow
-19.3%
Cash-on-Cash Return
1.2%
Cap rate
0.2%
Rent to Value Ratio
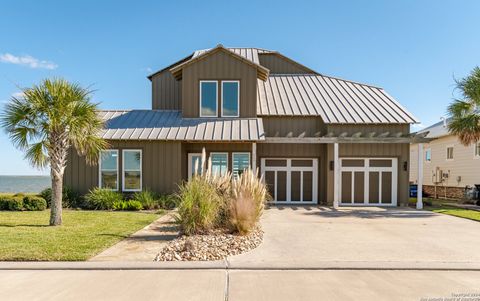
Active
$1,499,900
5
bds
|
4
ba
|
2,552
sqft
|
built
2021
107 Windjammer St, Rockport, TX 78382
$-6,115
Cash flow
-21.3%
Cash-on-Cash Return
0.8%
Cap rate
0.2%
Rent to Value Ratio
Active
$429,000
3
bds
|
2
ba
|
1,132
sqft
|
built
1978
1419 S Magnolia St, Rockport, TX 78382
$-975
Cash flow
-11.9%
Cash-on-Cash Return
3.0%
Cap rate
0.5%
Rent to Value Ratio
Active
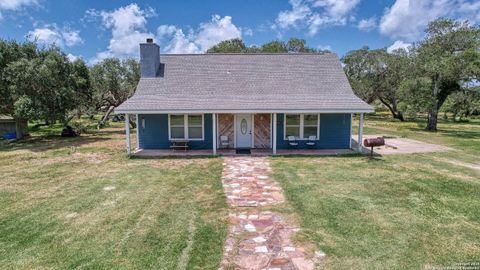
$1,399,000
5
bds
|
3
ba
|
3,120
sqft
|
built
1945
620 Egery Island Rd, Taft, TX 78390
$-5,315
Cash flow
-19.8%
Cash-on-Cash Return
1.1%
Cap rate
0.2%
Rent to Value Ratio
Active
$419,500
3
bds
|
2
ba
|
1,120
sqft
|
built
2023
203 Paradise Dr, Rockport, TX 78382
$-787
Cash flow
-9.8%
Cash-on-Cash Return
3.4%
Cap rate
0.6%
Rent to Value Ratio
Active
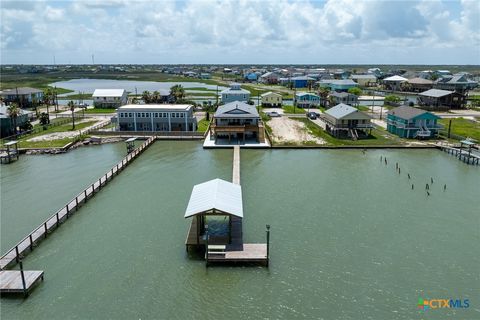
$1,699,000
4
bds
|
4
ba
|
2,947
sqft
|
built
1978
25 Blue Heron Dr, Rockport, TX 78382
$-5,280
Cash flow
-16.2%
Cash-on-Cash Return
1.9%
Cap rate
0.2%
Rent to Value Ratio

Active
$190,000
1
bds
|
1
ba
|
544
sqft
|
built
1950
820 S Magnolia St, Rockport, TX 78382
$-261
Cash flow
-7.2%
Cash-on-Cash Return
4.0%
Cap rate
0.6%
Rent to Value Ratio
Active
$269,000
1
bds
|
1
ba
|
621
sqft
|
built
1986
1021 S Water St, Rockport, TX 78382
$-169
Cash flow
-3.3%
Cash-on-Cash Return
4.9%
Cap rate
0.6%
Rent to Value Ratio
Active
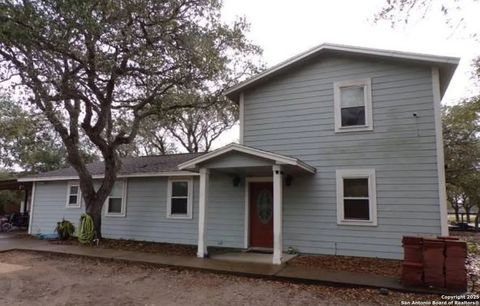
$299,900
3
bds
|
2
ba
|
1,155
sqft
|
built
1973
2003 N Fulton Beach Rd, Rockport, TX 78382
$-511
Cash flow
-8.9%
Cash-on-Cash Return
3.6%
Cap rate
0.7%
Rent to Value Ratio
Active
$499,000
4
bds
|
2
ba
|
1,824
sqft
|
built
1981
1016 S Magnolia St, Rockport, TX 78382
$-1,142
Cash flow
-11.9%
Cash-on-Cash Return
2.9%
Cap rate
0.5%
Rent to Value Ratio
Active
$300,000
1
bds
|
2
ba
|
890
sqft
|
built
1965
71 Nassau Dr, Rockport, TX 78382
$-939
Cash flow
-16.3%
Cash-on-Cash Return
1.9%
Cap rate
0.5%
Rent to Value Ratio
Active
$205,000
1
bds
|
1
ba
|
455
sqft
|
built
1985
2290 N Fulton Beach Rd, Rockport, TX 78382
$-640
Cash flow
-16.3%
Cash-on-Cash Return
1.9%
Cap rate
0.6%
Rent to Value Ratio
Active
$439,000
2
bds
|
2
ba
|
1,175
sqft
|
built
1984
30 Nassau Dr, Rockport, TX 78382
$-730
Cash flow
-8.7%
Cash-on-Cash Return
3.7%
Cap rate
0.5%
Rent to Value Ratio
Active
$435,000
3
bds
|
2
ba
|
1,582
sqft
|
built
2018
53 Tern St, Rockport, TX 78382
$-559
Cash flow
-6.7%
Cash-on-Cash Return
4.1%
Cap rate
0.6%
Rent to Value Ratio
Active
$367,500
3
bds
|
2
ba
|
1,024
sqft
|
built
2023
371 W Misty Oak Ln, Rockport, TX 78382
$-225
Cash flow
-3.2%
Cash-on-Cash Return
4.9%
Cap rate
0.6%
Rent to Value Ratio
Active
$239,900
1
bds
|
1
ba
|
791
sqft
|
built
1984
2292 N Fulton Beach Rd, Rockport, TX 78382
$-362
Cash flow
-7.9%
Cash-on-Cash Return
3.9%
Cap rate
0.7%
Rent to Value Ratio
Active
$1,241,750
4
bds
|
4
ba
|
2,485
sqft
|
built
2023
40 Northpointe Dr, Rockport, TX 78382
$-2,999
Cash flow
-12.6%
Cash-on-Cash Return
2.8%
Cap rate
0.5%
Rent to Value Ratio
Active
$710,000
4
bds
|
3
ba
|
3,032
sqft
|
built
2022
13 Westpointe Dr, Rockport, TX 78382
$-1,181
Cash flow
-8.7%
Cash-on-Cash Return
3.7%
Cap rate
0.5%
Rent to Value Ratio
Active
$549,900
3
bds
|
3
ba
|
1,794
sqft
|
built
2023
161 Shoalwater Way, Rockport, TX 78382
$-463
Cash flow
-4.4%
Cash-on-Cash Return
4.7%
Cap rate
0.6%
Rent to Value Ratio
Active
$229,000
3
bds
|
2
ba
|
1,200
sqft
|
built
2013
618 N Doughty St, Rockport, TX 78382
$-250
Cash flow
-5.7%
Cash-on-Cash Return
4.4%
Cap rate
0.7%
Rent to Value Ratio
Active
$519,000
3
bds
|
2
ba
|
1,493
sqft
|
built
2018
1517 S Magnolia St, Rockport, TX 78382
$-1,024
Cash flow
-10.3%
Cash-on-Cash Return
3.3%
Cap rate
0.6%
Rent to Value Ratio
Active
$359,000
3
bds
|
3
ba
|
1,335
sqft
|
built
2015
1403 S Young St, Rockport, TX 78382
$-682
Cash flow
-9.9%
Cash-on-Cash Return
3.4%
Cap rate
0.6%
Rent to Value Ratio
Active
$249,899
1
bds
|
1
ba
|
896
sqft
|
built
2020
22 Conlin Dr, Rockport, TX 78382
$-337
Cash flow
-7.0%
Cash-on-Cash Return
4.1%
Cap rate
0.6%
Rent to Value Ratio
Active
$375,000
3
bds
|
4
ba
|
2,388
sqft
|
built
2008
114 Lavaca Cir, Rockport, TX 78382
$-275
Cash flow
-3.8%
Cash-on-Cash Return
4.8%
Cap rate
0.7%
Rent to Value Ratio
Active
$1,649,999
3
bds
|
4
ba
|
3,455
sqft
|
built
2011
240 Reserve Ln, Rockport, TX 78382
$-6,170
Cash flow
-19.5%
Cash-on-Cash Return
1.2%
Cap rate
0.4%
Rent to Value Ratio
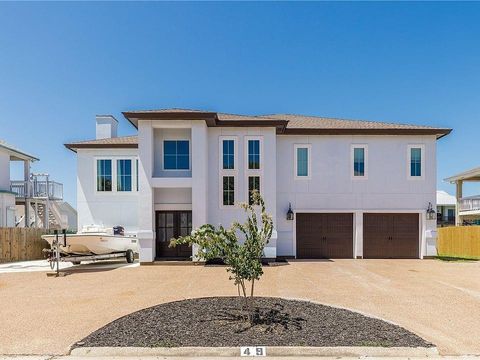
Active
$1,450,000
4
bds
|
4
ba
|
3,750
sqft
|
built
1997
49 Curlew Dr, Rockport, TX 78382
$-4,798
Cash flow
-17.3%
Cash-on-Cash Return
1.7%
Cap rate
0.4%
Rent to Value Ratio
Active
$156,000
1
bds
|
1
ba
|
557
sqft
|
built
1985
221 Marion Dr, Rockport, TX 78382
$-315
Cash flow
-10.5%
Cash-on-Cash Return
3.3%
Cap rate
0.8%
Rent to Value Ratio
Active
$1,090,000
3
bds
|
2
ba
|
2,446
sqft
|
built
2016
276 Reserve Ln, Rockport, TX 78382
$-5,589
Cash flow
-26.8%
Cash-on-Cash Return
-0.5%
Cap rate
0.3%
Rent to Value Ratio
Active
$600,000
3
bds
|
2
ba
|
1,702
sqft
|
built
2005
162 Sailfish Dr, Rockport, TX 78382
$-1,249
Cash flow
-10.9%
Cash-on-Cash Return
3.2%
Cap rate
0.5%
Rent to Value Ratio
Active
$1,999,000
4
bds
|
4
ba
|
3,215
sqft
|
built
2022
18 Peets Bend Dr, Rockport, TX 78382
$-8,431
Cash flow
-22.0%
Cash-on-Cash Return
0.6%
Cap rate
0.1%
Rent to Value Ratio
Active
$1,390,000
4
bds
|
4
ba
|
3,645
sqft
|
built
2006
6 Sea Shell Shores Dr, Rockport, TX 78382
$-3,805
Cash flow
-14.3%
Cash-on-Cash Return
2.4%
Cap rate
0.4%
Rent to Value Ratio
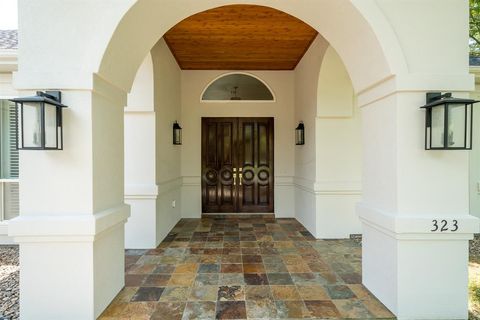
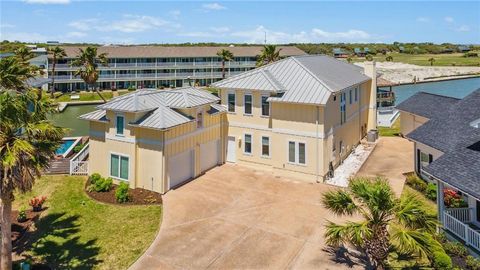
Active
$949,000
4
bds
|
3
ba
|
2,975
sqft
|
built
1999
323 Olympic Dr, Rockport, TX 78382
$-3,212
Cash flow
-17.7%
Cash-on-Cash Return
1.6%
Cap rate
0.3%
Rent to Value Ratio
Active
$250,000
2
bds
|
1
ba
|
1,310
sqft
|
built
1958
1429 S Mathis St, Rockport, TX 78382
$-265
Cash flow
-5.5%
Cash-on-Cash Return
4.4%
Cap rate
0.6%
Rent to Value Ratio