Bell County Investment Properties for Sale
Browse homes for sale and investment properties in Bell County. Refine your search by price, property type, or more.
Best cash flowing properties in Bell County
Active
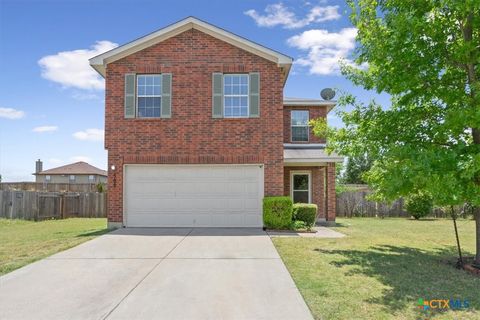
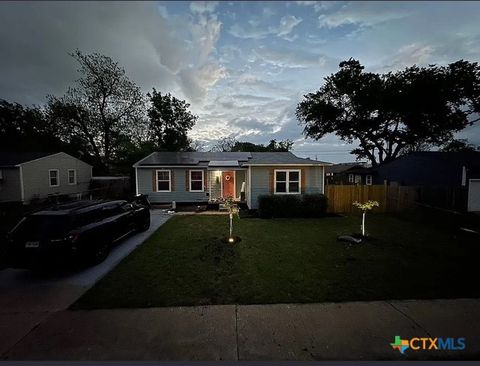
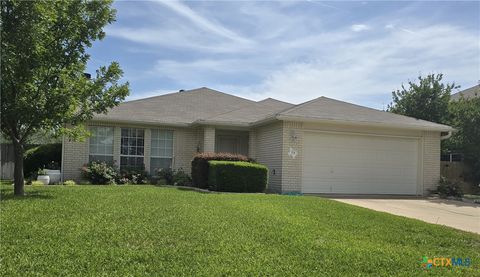
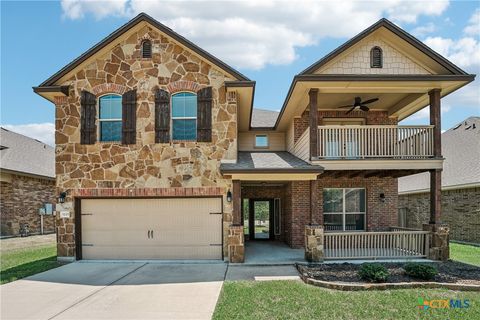
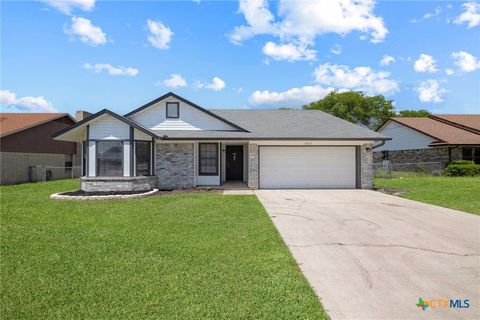
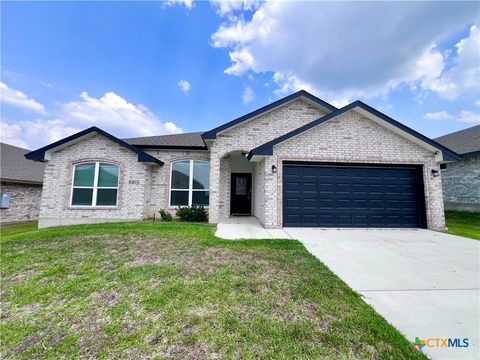
$175,000
3
bds
|
3
ba
|
1,682
sqft
|
built
2008
508 Perseus, Killeen, TX 76542
$-42
Cash flow
-1.3%
Cash-on-Cash Return
6.0%
Cap rate
1.0%
Rent to Value Ratio
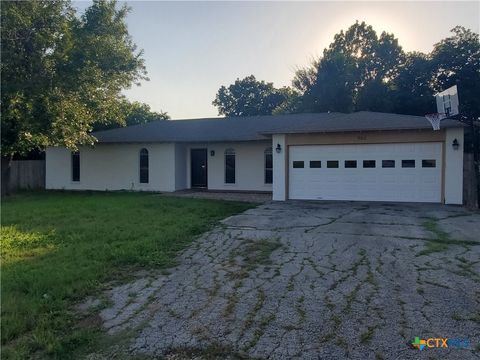
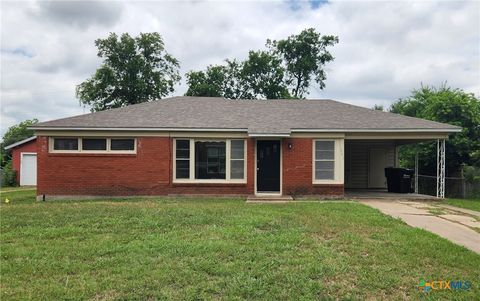
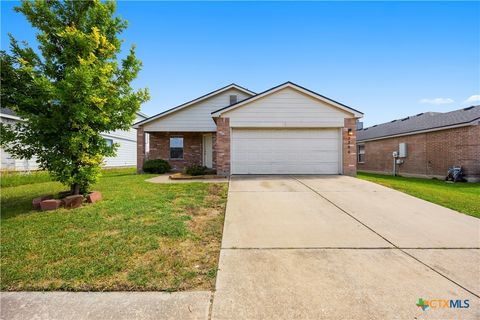
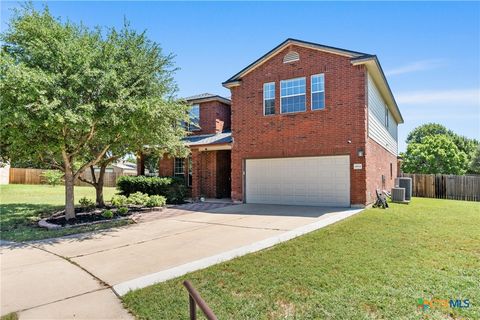
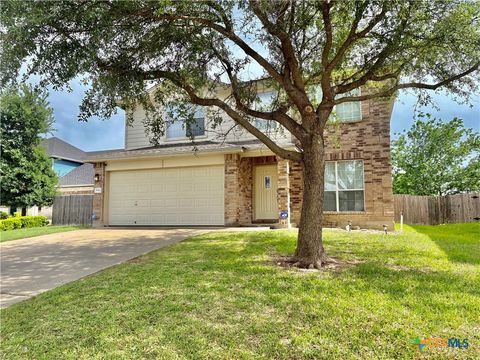
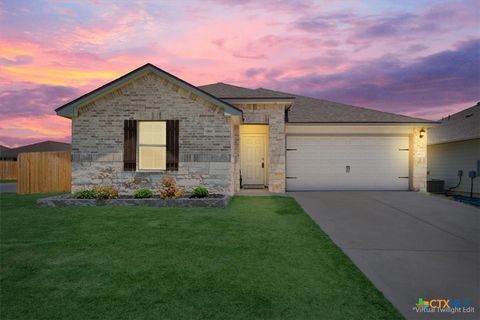
Active
$210,000
3
bds
|
2
ba
|
1,637
sqft
|
built
1978
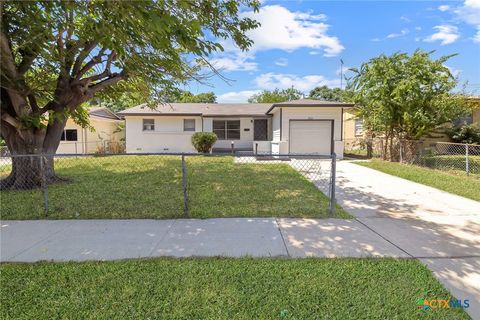
902 Church Ave, Troy, TX 76579
$-149
Cash flow
-3.7%
Cash-on-Cash Return
5.4%
Cap rate
0.9%
Rent to Value Ratio
1,444 out of 2,354 properties for sale in Bell County
Limited Results Shown
Create a free account, or log in to reveal all property listings and enjoy the complete experience.
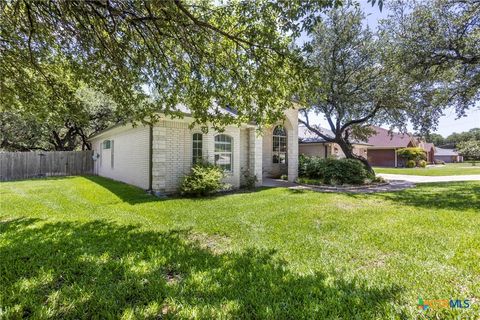
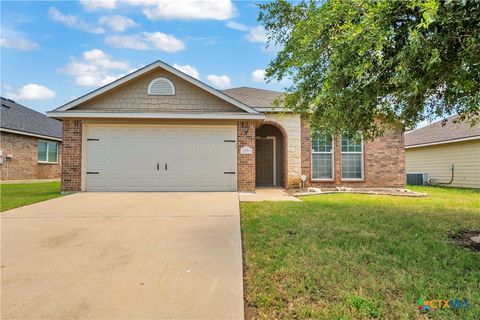
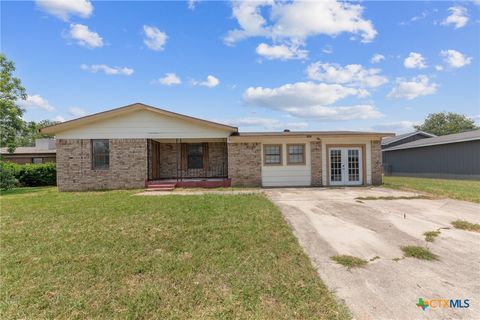
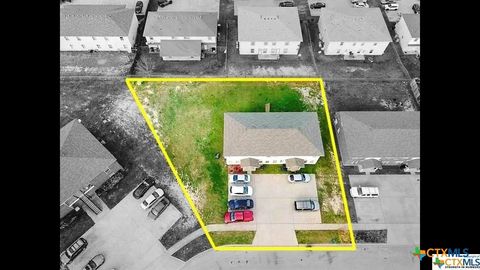
Active
$379,200
4
bds
|
4
ba
|
2,494
sqft
|
built
2005
402 Prospector Trl, Harker Heights, TX 76548
$-921
Cash flow
-12.7%
Cash-on-Cash Return
3.4%
Cap rate
0.6%
Rent to Value Ratio
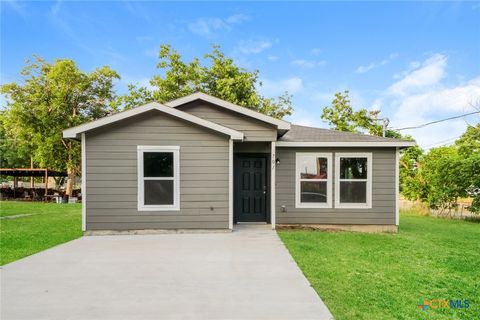
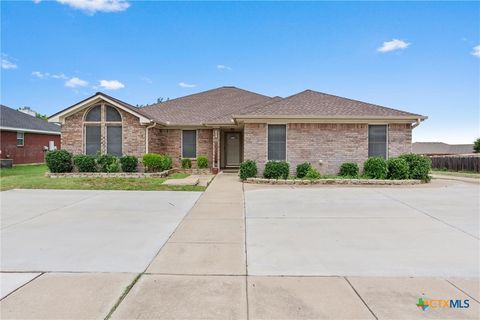
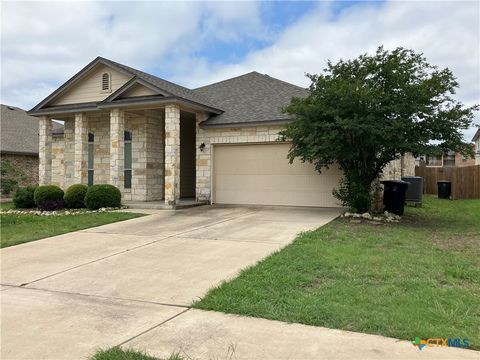
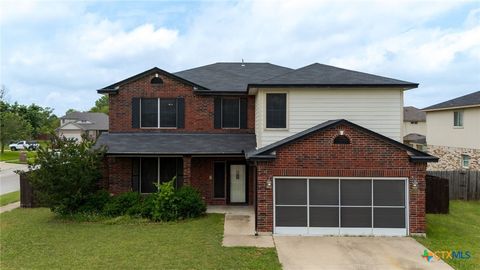
Active
$215,000
3
bds
|
2
ba
|
1,040
sqft
|
built
2022
701 E Avenue A, Temple, TX 76501
$-410
Cash flow
-9.9%
Cash-on-Cash Return
4.0%
Cap rate
0.7%
Rent to Value Ratio
Active
$175,000
3
bds
|
2
ba
|
1,266
sqft
|
built
1962
508 Crockett Dr, Killeen, TX 76541
$-199
Cash flow
-5.9%
Cash-on-Cash Return
4.9%
Cap rate
0.8%
Rent to Value Ratio
Active
$152,000
2
bds
|
1
ba
|
1,096
sqft
|
built
1957
201 W Young Ave, Temple, TX 76501
$-172
Cash flow
-5.9%
Cash-on-Cash Return
4.9%
Cap rate
0.9%
Rent to Value Ratio
Active
$235,000
3
bds
|
2
ba
|
1,336
sqft
|
built
2011
7810 Woodbury Dr, Temple, TX 76502
$-524
Cash flow
-11.6%
Cash-on-Cash Return
3.6%
Cap rate
0.7%
Rent to Value Ratio
Active
$264,700
4
bds
|
2
ba
|
2,129
sqft
|
built
2002
4401 Maggie Dr, Killeen, TX 76549
$-558
Cash flow
-11.0%
Cash-on-Cash Return
3.7%
Cap rate
0.7%
Rent to Value Ratio
Active
$595,000
3
bds
|
3
ba
|
3,520
sqft
|
built
1992
1204 Fairway Cir, Salado, TX 76571
$-1,882
Cash flow
-16.5%
Cash-on-Cash Return
2.5%
Cap rate
0.6%
Rent to Value Ratio
Active
$305,000
4
bds
|
3
ba
|
2,444
sqft
|
built
2017
3500 Aubree Katherine Dr, Killeen, TX 76542
$-624
Cash flow
-10.7%
Cash-on-Cash Return
3.8%
Cap rate
0.7%
Rent to Value Ratio
Active
$242,000
3
bds
|
2
ba
|
1,440
sqft
|
built
1962
6769 Cedar Cove Rd, Belton, TX 76513
$-159
Cash flow
-3.4%
Cash-on-Cash Return
5.5%
Cap rate
0.7%
Rent to Value Ratio

Active
$147,500
3
bds
|
1
ba
|
1,000
sqft
|
built
1963
4802 Renick Ranch Rd, Killeen, TX 76549
$-204
Cash flow
-7.2%
Cash-on-Cash Return
4.6%
Cap rate
0.7%
Rent to Value Ratio
Active
$437,000
3
bds
|
3
ba
|
1,902
sqft
|
built
1982
735 Slawson Ln, Killeen, TX 76542
$-1,162
Cash flow
-13.9%
Cash-on-Cash Return
3.1%
Cap rate
0.5%
Rent to Value Ratio
Active
$294,900
3
bds
|
2
ba
|
2,307
sqft
|
built
1998
114 Quapaw Dr, Harker Heights, TX 76548
$-705
Cash flow
-12.5%
Cash-on-Cash Return
3.4%
Cap rate
0.6%
Rent to Value Ratio
Active
$189,900
4
bds
|
2
ba
|
1,446
sqft
|
built
2006
3204 Neel Ct, Killeen, TX 76543
$-356
Cash flow
-9.8%
Cash-on-Cash Return
4.0%
Cap rate
0.7%
Rent to Value Ratio
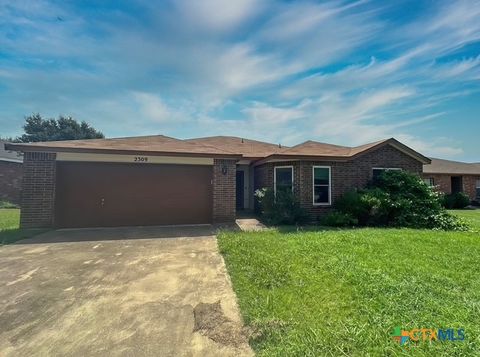
Active
$288,000
4
bds
|
2
ba
|
1,922
sqft
|
built
2006
2309 Miller St, Belton, TX 76513
$-668
Cash flow
-12.1%
Cash-on-Cash Return
3.5%
Cap rate
0.6%
Rent to Value Ratio
Active
$180,000
bds
|
0
ba
|
1,600
sqft
|
built
1968
1018 N 12th St, Killeen, TX 76541
$-719
Cash flow
-20.8%
Cash-on-Cash Return
1.5%
Cap rate
0.3%
Rent to Value Ratio
Active
$409,900
5
bds
|
3
ba
|
3,200
sqft
|
built
2017
3225 Vineyard Trl, Harker Heights, TX 76548
$-910
Cash flow
-11.6%
Cash-on-Cash Return
3.6%
Cap rate
0.7%
Rent to Value Ratio
Active
$379,900
4
bds
|
3
ba
|
3,152
sqft
|
built
2007
4904 Sodalite Ct, Killeen, TX 76542
$-396
Cash flow
-5.4%
Cash-on-Cash Return
5.0%
Cap rate
0.6%
Rent to Value Ratio
Active
$210,000
3
bds
|
2
ba
|
1,980
sqft
|
built
1985
3105 Julie Ln, Killeen, TX 76549
$-225
Cash flow
-5.6%
Cash-on-Cash Return
5.0%
Cap rate
0.9%
Rent to Value Ratio
Active
$289,000
4
bds
|
3
ba
|
2,221
sqft
|
built
2013
6403 Creek Land Rd, Killeen, TX 76549
$-613
Cash flow
-11.1%
Cash-on-Cash Return
3.7%
Cap rate
0.7%
Rent to Value Ratio
Active
$390,000
6
bds
|
3
ba
|
3,016
sqft
|
built
1972
4417 S Pea Ridge Rd, Temple, TX 76502
$-699
Cash flow
-9.4%
Cash-on-Cash Return
4.1%
Cap rate
0.6%
Rent to Value Ratio
Active
$240,000
3
bds
|
2
ba
|
1,972
sqft
|
built
1974
602 Estes Dr, Killeen, TX 76541
$-466
Cash flow
-10.1%
Cash-on-Cash Return
3.9%
Cap rate
0.7%
Rent to Value Ratio
Active
$335,000
5
bds
|
3
ba
|
2,660
sqft
|
built
2018
3612 Aubree Katherine Dr, Killeen, TX 76542
$-640
Cash flow
-10.0%
Cash-on-Cash Return
4.0%
Cap rate
0.7%
Rent to Value Ratio
Active
$389,900
4
bds
|
5
ba
|
2,933
sqft
|
built
1971
105 Oakmont Cir, Harker Heights, TX 76548
$-1,074
Cash flow
-14.4%
Cash-on-Cash Return
3.0%
Cap rate
0.6%
Rent to Value Ratio
Active
$215,000
4
bds
|
2
ba
|
1,458
sqft
|
built
1986
3317 Westrim Dr, Killeen, TX 76549
$-484
Cash flow
-11.7%
Cash-on-Cash Return
3.6%
Cap rate
0.7%
Rent to Value Ratio

Active
$273,000
4
bds
|
2
ba
|
1,657
sqft
|
built
2023
1148 Velvet Ct, Troy, TX 76579
$-447
Cash flow
-8.5%
Cash-on-Cash Return
4.3%
Cap rate
0.7%
Rent to Value Ratio
Active
$265,000
3
bds
|
3
ba
|
2,127
sqft
|
built
2006
5902 Chuckwagon Cir, Killeen, TX 76542
$-564
Cash flow
-11.1%
Cash-on-Cash Return
3.7%
Cap rate
0.7%
Rent to Value Ratio
Active
$405,000
2
bds
|
2
ba
|
3,717
sqft
|
built
2002
1601 Dugger Cir, Killeen, TX 76543
$-2,259
Cash flow
-29.1%
Cash-on-Cash Return
-0.4%
Cap rate
0.2%
Rent to Value Ratio
Active
$255,000
3
bds
|
3
ba
|
2,966
sqft
|
built
2005
1505 Line Dance Ct, Killeen, TX 76542
$-456
Cash flow
-9.3%
Cash-on-Cash Return
4.1%
Cap rate
0.8%
Rent to Value Ratio
Active
$335,000
4
bds
|
3
ba
|
2,329
sqft
|
built
2019
4505 Prewitt Ranch Rd, Killeen, TX 76549
$-682
Cash flow
-10.6%
Cash-on-Cash Return
3.8%
Cap rate
0.7%
Rent to Value Ratio
Active
$275,000
4
bds
|
2
ba
|
1,706
sqft
|
built
2007
4902 Slate Ct, Killeen, TX 76542
$-673
Cash flow
-12.8%
Cash-on-Cash Return
3.3%
Cap rate
0.6%
Rent to Value Ratio
Active
$395,700
3
bds
|
2
ba
|
1,867
sqft
|
built
1994
2216 Smith Bluff Rd, Salado, TX 76571
$-1,034
Cash flow
-13.6%
Cash-on-Cash Return
3.1%
Cap rate
0.6%
Rent to Value Ratio
Active
$285,000
4
bds
|
3
ba
|
2,553
sqft
|
built
2004
2409 Eppinette Dr, Killeen, TX 76542
$-521
Cash flow
-9.5%
Cash-on-Cash Return
4.1%
Cap rate
0.7%
Rent to Value Ratio
Active
$210,000
3
bds
|
2
ba
|
1,637
sqft
|
built
1978
902 Church Ave, Troy, TX 76579
$-149
Cash flow
-3.7%
Cash-on-Cash Return
5.4%
Cap rate
0.9%
Rent to Value Ratio
Active
$690,000
4
bds
|
6
ba
|
6,859
sqft
|
built
1956
707 W Thompson Ave, Temple, TX 76501
$-2,974
Cash flow
-22.5%
Cash-on-Cash Return
1.1%
Cap rate
0.4%
Rent to Value Ratio
Active
$175,000
3
bds
|
3
ba
|
1,682
sqft
|
built
2008
508 Perseus, Killeen, TX 76542
$-42
Cash flow
-1.3%
Cash-on-Cash Return
6.0%
Cap rate
1.0%
Rent to Value Ratio
Active
$175,000
4
bds
|
1
ba
|
1,255
sqft
|
built
1964
3102 Taft St, Killeen, TX 76543
$-186
Cash flow
-5.5%
Cash-on-Cash Return
5.0%
Cap rate
0.7%
Rent to Value Ratio
Active
$287,000
3
bds
|
2
ba
|
1,954
sqft
|
built
2016
7002 Spirit Of The West Dr, Killeen, TX 76549
$-700
Cash flow
-12.7%
Cash-on-Cash Return
3.3%
Cap rate
0.6%
Rent to Value Ratio
Active
$303,821
4
bds
|
2
ba
|
1,881
sqft
|
built
2009
6902 Golden Oak Ln, Killeen, TX 76542
$-785
Cash flow
-13.5%
Cash-on-Cash Return
3.2%
Cap rate
0.6%
Rent to Value Ratio
Active
$339,000
4
bds
|
2
ba
|
1,866
sqft
|
built
2022
8302 Ridge Crest Dr, Killeen, TX 76542
$-1,103
Cash flow
-17.0%
Cash-on-Cash Return
2.4%
Cap rate
0.5%
Rent to Value Ratio
Active
$305,000
4
bds
|
2
ba
|
1,814
sqft
|
built
2022
8812 Cantera Ridge Rd, Temple, TX 76502
$-889
Cash flow
-15.2%
Cash-on-Cash Return
2.8%
Cap rate
0.6%
Rent to Value Ratio