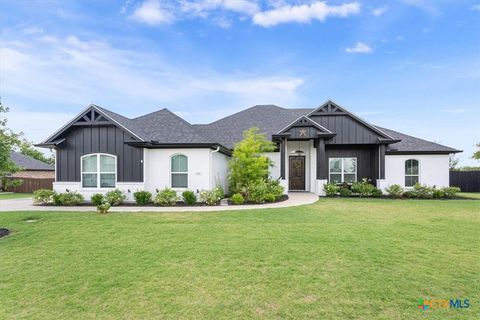
Bell County Investment Properties for Sale
Browse homes for sale and investment properties in Bell County. Refine your search by price, property type, or more.
Best cash flowing properties in Bell County
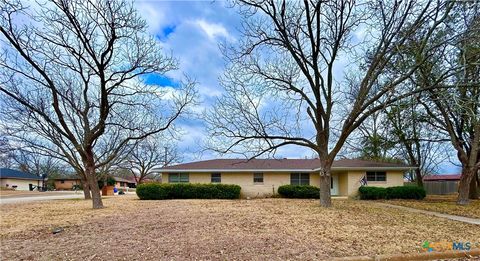
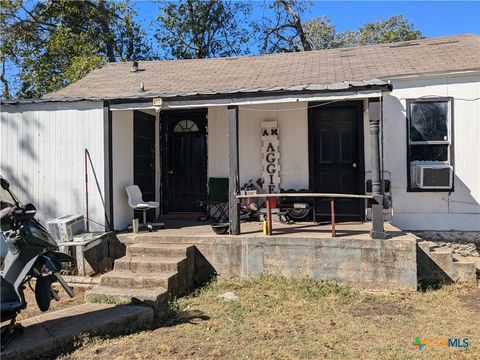
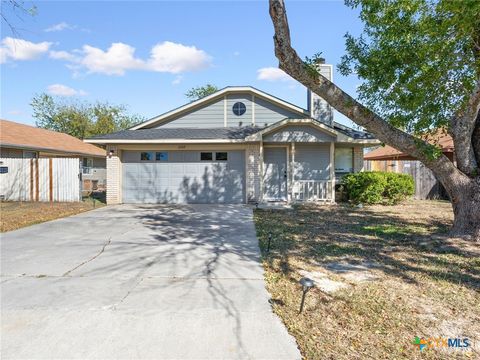
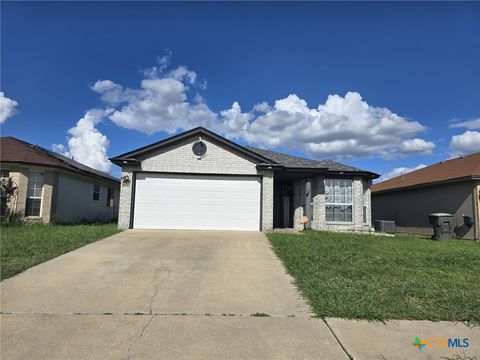
Active
$210,000
3
bds
|
2
ba
|
1,568
sqft
|
built
1966
205 S College Ave, Troy, TX 76579
$248
Cash flow
6.2%
Cash-on-Cash Return
7.1%
Cap rate
0.9%
Rent to Value Ratio

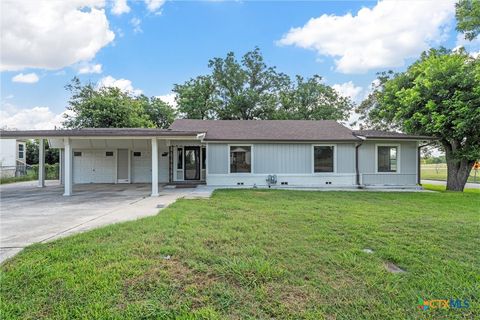
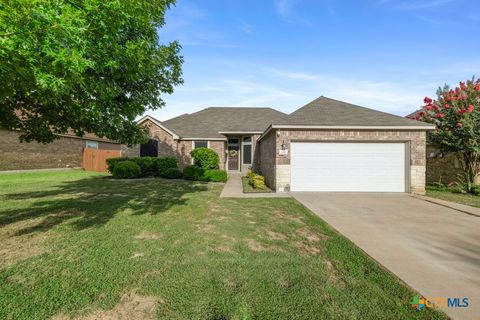
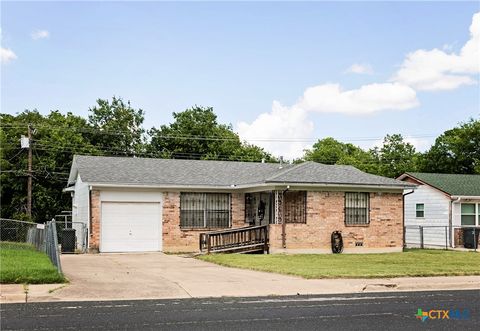
Active
$199,000
3
bds
|
2
ba
|
1,141
sqft
|
built
1985
5600 Fm 439, Belton, TX 76513
$162
Cash flow
4.2%
Cash-on-Cash Return
6.7%
Cap rate
0.8%
Rent to Value Ratio
824 out of 1,303 properties for sale in Bell County
Limited Results Shown
Create a free account, or log in to reveal all property listings and enjoy the complete experience.
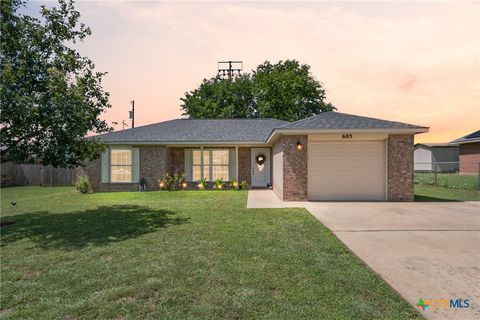
Active
$205,000
3
bds
|
2
ba
|
1,152
sqft
|
built
2003
605 Aikman Dr, Troy, TX 76579
$-291
Cash flow
-7.4%
Cash-on-Cash Return
4.0%
Cap rate
0.7%
Rent to Value Ratio

Active
$290,000
5
bds
|
3
ba
|
2,414
sqft
|
built
2009
4302 Jack Barnes Ave, Killeen, TX 76549
$-238
Cash flow
-4.3%
Cash-on-Cash Return
4.7%
Cap rate
0.8%
Rent to Value Ratio
Active
$199,999
3
bds
|
3
ba
|
1,386
sqft
|
built
1950
401 S 11th St, Temple, TX 76504
$-3
Cash flow
-0.1%
Cash-on-Cash Return
5.7%
Cap rate
0.8%
Rent to Value Ratio
Active
$199,997
4
bds
|
3
ba
|
1,246
sqft
|
built
1949
1211 S 17th St, Temple, TX 76504
$-252
Cash flow
-6.6%
Cash-on-Cash Return
4.2%
Cap rate
0.7%
Rent to Value Ratio
Active
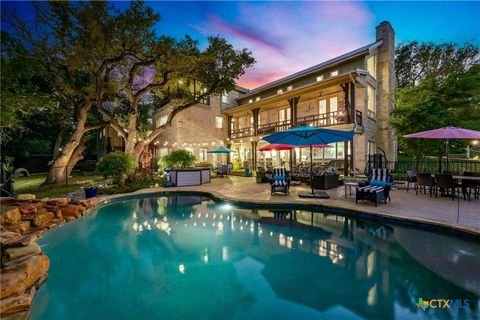
$1,499,000
4
bds
|
5
ba
|
5,631
sqft
|
built
2001
913 Southridge, Salado, TX 76571
$-5,022
Cash flow
-17.5%
Cash-on-Cash Return
1.7%
Cap rate
0.3%
Rent to Value Ratio
Active
$240,000
3
bds
|
2
ba
|
3,577
sqft
|
built
1951
1524 E Avenue B, Temple, TX 76501
$-656
Cash flow
-14.3%
Cash-on-Cash Return
2.4%
Cap rate
0.7%
Rent to Value Ratio
Active
$370,000
bds
|
0
ba
|
2,470
sqft
|
built
2020
1940 Lively Ln, Temple, TX 76502
$-1,380
Cash flow
-19.5%
Cash-on-Cash Return
1.2%
Cap rate
0.4%
Rent to Value Ratio

Active
$670,000
4
bds
|
3
ba
|
2,479
sqft
|
built
2014
11717 Caleigh Anne Dr, Belton, TX 76513
$-2,727
Cash flow
-21.2%
Cash-on-Cash Return
0.8%
Cap rate
0.4%
Rent to Value Ratio
Active
$529,000
4
bds
|
3
ba
|
2,822
sqft
|
built
2008
1135 Redleaf Dr, Nolanville, TX 76559
$-1,524
Cash flow
-15.0%
Cash-on-Cash Return
2.2%
Cap rate
0.5%
Rent to Value Ratio
Active
$75,000
1
bds
|
1
ba
|
581
sqft
|
built
1923
309 W Avenue P, Temple, TX 76504
$-55
Cash flow
-3.8%
Cash-on-Cash Return
4.8%
Cap rate
0.9%
Rent to Value Ratio
Active
$350,000
bds
|
0
ba
|
3,180
sqft
|
built
2000
5903 Greengate Dr, Killeen, TX 76543
$-1,507
Cash flow
-22.5%
Cash-on-Cash Return
0.5%
Cap rate
0.3%
Rent to Value Ratio

Active
$185,000
bds
|
0
ba
|
1,686
sqft
|
built
1959
801 Kern Rd, Killeen, TX 76541
$-232
Cash flow
-6.5%
Cash-on-Cash Return
4.2%
Cap rate
0.7%
Rent to Value Ratio
Active
$1,290,000
5
bds
|
4
ba
|
4,697
sqft
|
built
1995
11421 Somerville, Temple, TX 76502
$-5,864
Cash flow
-23.7%
Cash-on-Cash Return
0.2%
Cap rate
0.2%
Rent to Value Ratio
Active
$380,000
4
bds
|
3
ba
|
2,618
sqft
|
built
2021
5104 Leaning Tree, Temple, TX 76502
$-655
Cash flow
-9.0%
Cash-on-Cash Return
3.6%
Cap rate
0.7%
Rent to Value Ratio

Active
$385,000
4
bds
|
4
ba
|
3,064
sqft
|
built
2013
3312 Vineyard Trl, Harker Heights, TX 76548
$-695
Cash flow
-9.4%
Cash-on-Cash Return
3.5%
Cap rate
0.6%
Rent to Value Ratio

Active
$275,000
4
bds
|
2
ba
|
2,124
sqft
|
built
1964
1506 Westover Dr, Killeen, TX 76549
$-563
Cash flow
-10.7%
Cash-on-Cash Return
3.2%
Cap rate
0.6%
Rent to Value Ratio
Active
$260,000
3
bds
|
2
ba
|
2,026
sqft
|
built
1969
105 E Upshaw Ave, Temple, TX 76501
$-498
Cash flow
-10.0%
Cash-on-Cash Return
3.4%
Cap rate
0.7%
Rent to Value Ratio
Active
$295,000
3
bds
|
2
ba
|
1,722
sqft
|
built
2019
810 Dunford Dr, Temple, TX 76502
$-758
Cash flow
-13.4%
Cash-on-Cash Return
2.6%
Cap rate
0.6%
Rent to Value Ratio
Active
$325,000
4
bds
|
3
ba
|
1,788
sqft
|
built
2021
717 Friars Tuck Dr, Temple, TX 76502
$-856
Cash flow
-13.7%
Cash-on-Cash Return
2.5%
Cap rate
0.6%
Rent to Value Ratio
Active
$330,000
4
bds
|
3
ba
|
2,862
sqft
|
built
2013
306 W Gemini Ln, Killeen, TX 76542
$-841
Cash flow
-13.3%
Cash-on-Cash Return
2.6%
Cap rate
0.5%
Rent to Value Ratio
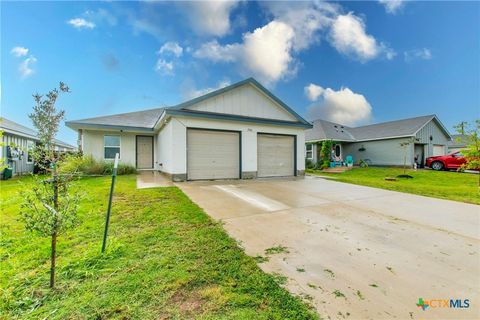
Active
$180,000
3
bds
|
2
ba
|
1,208
sqft
|
built
1983
2109 Cimmaron Dr, Killeen, TX 76543
$114
Cash flow
3.3%
Cash-on-Cash Return
6.4%
Cap rate
0.8%
Rent to Value Ratio

Active
$415,000
4
bds
|
3
ba
|
3,340
sqft
|
built
2014
2014 Deer Field Way, Harker Heights, TX 76548
$-1,086
Cash flow
-13.7%
Cash-on-Cash Return
2.5%
Cap rate
0.5%
Rent to Value Ratio
Active
$259,800
4
bds
|
2
ba
|
1,588
sqft
|
built
2009
1117 Branchwood Way, Temple, TX 76502
$-527
Cash flow
-10.6%
Cash-on-Cash Return
3.2%
Cap rate
0.7%
Rent to Value Ratio

Active
$225,000
3
bds
|
2
ba
|
1,396
sqft
|
built
2016
3312 Parkmill Dr, Killeen, TX 76542
$-365
Cash flow
-8.5%
Cash-on-Cash Return
3.7%
Cap rate
0.7%
Rent to Value Ratio
Active
$696,000
3
bds
|
3
ba
|
3,107
sqft
|
built
2002
1260 Great Oaks, Salado, TX 76571
$-1,362
Cash flow
-10.2%
Cash-on-Cash Return
3.3%
Cap rate
0.4%
Rent to Value Ratio
Active
$305,000
bds
|
0
ba
|
2,265
sqft
|
built
2007
403 W Dale Ave, Nolanville, TX 76559
$-1,077
Cash flow
-18.4%
Cash-on-Cash Return
1.4%
Cap rate
0.3%
Rent to Value Ratio
Active
$85,000
1
bds
|
1
ba
|
720
sqft
|
built
1908
1309 S 4th St, Temple, TX 76504
$-41
Cash flow
-2.5%
Cash-on-Cash Return
5.1%
Cap rate
0.9%
Rent to Value Ratio
Active
$558,000
4
bds
|
2
ba
|
2,429
sqft
|
built
2021
100 Metheglin Dr, Temple, TX 76502
$-1,335
Cash flow
-12.5%
Cash-on-Cash Return
2.8%
Cap rate
0.5%
Rent to Value Ratio

Active
$415,000
4
bds
|
3
ba
|
2,315
sqft
|
built
2021
8306 Callahan Dr, Killeen, TX 76542
$-948
Cash flow
-11.9%
Cash-on-Cash Return
2.9%
Cap rate
0.6%
Rent to Value Ratio
Active
$850,000
6
bds
|
4
ba
|
3,855
sqft
|
built
2019
2037 Heritage Loop, Nolanville, TX 76559
$-2,478
Cash flow
-15.2%
Cash-on-Cash Return
2.2%
Cap rate
0.4%
Rent to Value Ratio

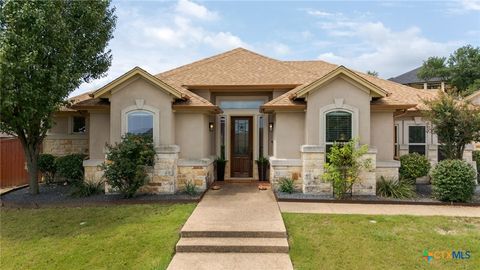
Active
$344,500
4
bds
|
2
ba
|
1,860
sqft
|
built
2016
2042 Yturria Dr, Belton, TX 76513
$-884
Cash flow
-13.4%
Cash-on-Cash Return
2.6%
Cap rate
0.6%
Rent to Value Ratio

Active
$369,900
4
bds
|
3
ba
|
3,041
sqft
|
built
2013
3700 Joyce Ln, Killeen, TX 76549
$-755
Cash flow
-10.6%
Cash-on-Cash Return
3.2%
Cap rate
0.6%
Rent to Value Ratio
Active
$290,000
4
bds
|
2
ba
|
1,606
sqft
|
built
2023
8818 Happy Valley Dr, Temple, TX 76502
$-441
Cash flow
-7.9%
Cash-on-Cash Return
3.9%
Cap rate
0.7%
Rent to Value Ratio

Active
$269,000
3
bds
|
3
ba
|
1,731
sqft
|
built
1987
713 End O Trl, Harker Heights, TX 76548
$-440
Cash flow
-8.5%
Cash-on-Cash Return
3.7%
Cap rate
0.7%
Rent to Value Ratio
Active
$185,000
3
bds
|
2
ba
|
1,273
sqft
|
built
2001
2814 Blackburn Dr, Killeen, TX 76543
$-35
Cash flow
-1.0%
Cash-on-Cash Return
5.4%
Cap rate
0.9%
Rent to Value Ratio
Active
$140,999
3
bds
|
1
ba
|
1,030
sqft
|
built
1965
3003 Zephyr Rd, Killeen, TX 76543
$65
Cash flow
2.4%
Cash-on-Cash Return
6.2%
Cap rate
0.9%
Rent to Value Ratio
Active
$190,000
3
bds
|
3
ba
|
1,412
sqft
|
built
1982
2011 Hinkle Ave, Killeen, TX 76549
$-239
Cash flow
-6.6%
Cash-on-Cash Return
4.2%
Cap rate
0.7%
Rent to Value Ratio
Active
$525,000
5
bds
|
3
ba
|
3,578
sqft
|
built
1973
4101 Briar Cliff Rd, Temple, TX 76502
$-680
Cash flow
-6.8%
Cash-on-Cash Return
4.1%
Cap rate
0.7%
Rent to Value Ratio