Bexar County Investment Properties for Sale
Browse homes for sale and investment properties in Bexar County. Refine your search by price, property type, or more.
Best cash flowing properties in Bexar County
Active
$169,900
3
bds
|
1
ba
|
856
sqft
|
built
1968
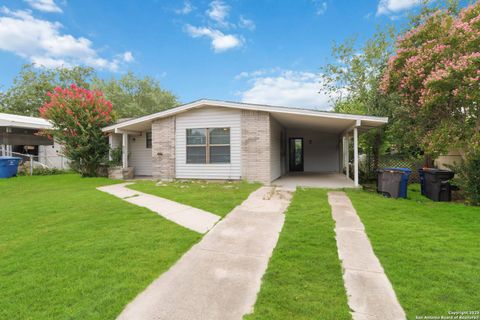
134 Shadowlight Terrace St, San Antonio, TX 78233
$-161
Cash flow
-4.9%
Cash-on-Cash Return
4.5%
Cap rate
0.8%
Rent to Value Ratio

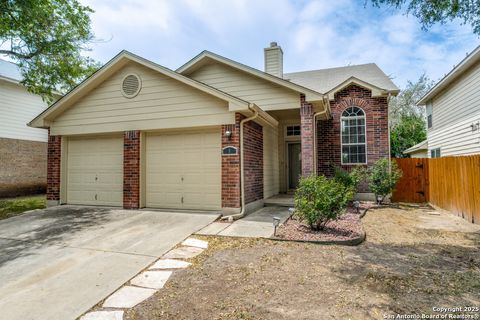
Active
$219,000
3
bds
|
3
ba
|
1,128
sqft
|
built
2001
11442 Blue Mesa Dr, San Antonio, TX 78245
$-213
Cash flow
-5.1%
Cash-on-Cash Return
4.5%
Cap rate
0.7%
Rent to Value Ratio
4,322 out of 4,729 properties for sale in Bexar County
Limited Results Shown
Create a free account, or log in to reveal all property listings and enjoy the complete experience.

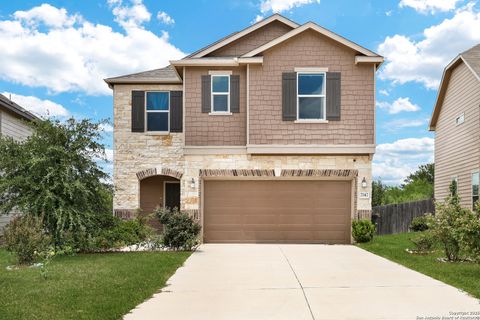
Active
$469,900
4
bds
|
2
ba
|
2,088
sqft
|
built
1981
19706 Encino Knoll St, San Antonio, TX 78259
$-1,534
Cash flow
-17.0%
Cash-on-Cash Return
1.8%
Cap rate
0.5%
Rent to Value Ratio

Active
$330,000
3
bds
|
3
ba
|
1,388
sqft
|
built
2000
22150 Goldcrest Run, San Antonio, TX 78260
$-1,024
Cash flow
-16.2%
Cash-on-Cash Return
2.0%
Cap rate
0.5%
Rent to Value Ratio
Active
$699,000
3
bds
|
3
ba
|
2,260
sqft
|
built
2021
11260 Beverly Hills Dr, Helotes, TX 78023
$-1,775
Cash flow
-13.2%
Cash-on-Cash Return
2.6%
Cap rate
0.6%
Rent to Value Ratio

Active
$299,999
3
bds
|
3
ba
|
2,307
sqft
|
built
2012
8978 Oakwood Park, San Antonio, TX 78254
$-509
Cash flow
-8.9%
Cash-on-Cash Return
3.6%
Cap rate
0.7%
Rent to Value Ratio

Active
$345,000
3
bds
|
3
ba
|
2,729
sqft
|
built
2006
10903 Geneva Moon, San Antonio, TX 78254
$-556
Cash flow
-8.4%
Cash-on-Cash Return
3.7%
Cap rate
0.6%
Rent to Value Ratio

Active
$297,000
4
bds
|
2
ba
|
1,631
sqft
|
built
2021
9619 Littleton Grist, San Antonio, TX 78254
$-536
Cash flow
-9.4%
Cash-on-Cash Return
3.5%
Cap rate
0.7%
Rent to Value Ratio

Active
$290,000
3
bds
|
3
ba
|
2,093
sqft
|
built
2014
8907 Silver City, San Antonio, TX 78254
$-517
Cash flow
-9.3%
Cash-on-Cash Return
3.5%
Cap rate
0.7%
Rent to Value Ratio
Active
$224,900
2
bds
|
2
ba
|
1,036
sqft
|
built
1998
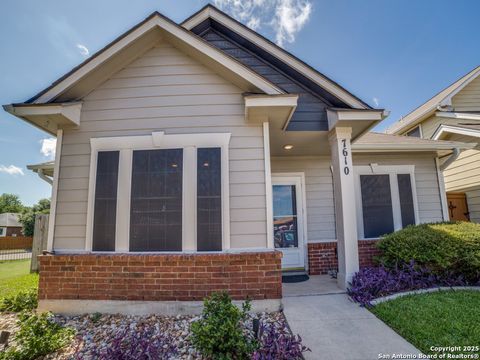
7610 Crown Ledge, San Antonio, TX 78251
$-514
Cash flow
-11.9%
Cash-on-Cash Return
2.9%
Cap rate
0.6%
Rent to Value Ratio

Active
$650,000
4
bds
|
2
ba
|
2,260
sqft
|
built
1961
7014 Scotsdale Dr, San Antonio, TX 78209
$-2,253
Cash flow
-18.1%
Cash-on-Cash Return
1.5%
Cap rate
0.4%
Rent to Value Ratio
Active
$419,999
4
bds
|
3
ba
|
2,233
sqft
|
built
2018
21018 Chestnut Cv, San Antonio, TX 78266
$-855
Cash flow
-10.6%
Cash-on-Cash Return
3.2%
Cap rate
0.6%
Rent to Value Ratio

Active
$749,999
4
bds
|
3
ba
|
2,966
sqft
|
built
1997
26308 Reyglen Dr, San Antonio, TX 78255
$-1,881
Cash flow
-13.1%
Cash-on-Cash Return
2.7%
Cap rate
0.5%
Rent to Value Ratio
Active
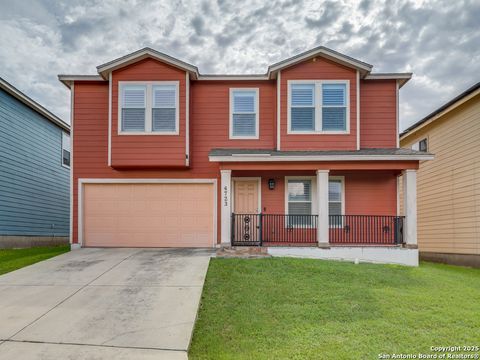
$345,000
4
bds
|
4
ba
|
3,680
sqft
|
built
2007
4723 Stable Holw, San Antonio, TX 78244
$-49,745
Cash flow
-752.3%
Cash-on-Cash Return
-167.3%
Cap rate
0.7%
Rent to Value Ratio
Active
$259,000
2
bds
|
2
ba
|
952
sqft
|
built
1953
135 Saratoga Dr, San Antonio, TX 78213
$-472
Cash flow
-9.5%
Cash-on-Cash Return
3.5%
Cap rate
0.6%
Rent to Value Ratio
Active
$179,000
3
bds
|
3
ba
|
1,237
sqft
|
built
2010
6315 Aspen Hl, San Antonio, TX 78238
$-286
Cash flow
-8.3%
Cash-on-Cash Return
3.8%
Cap rate
0.8%
Rent to Value Ratio
Active
$299,900
3
bds
|
5
ba
|
1,852
sqft
|
built
1928
2055 W Huisache Ave, San Antonio, TX 78201
$-288
Cash flow
-5.0%
Cash-on-Cash Return
4.5%
Cap rate
0.8%
Rent to Value Ratio
Active
$467,900
3
bds
|
2
ba
|
2,038
sqft
|
built
1948
221 Larchmont Dr, San Antonio, TX 78209
$-1,966
Cash flow
-21.9%
Cash-on-Cash Return
0.6%
Cap rate
0.3%
Rent to Value Ratio

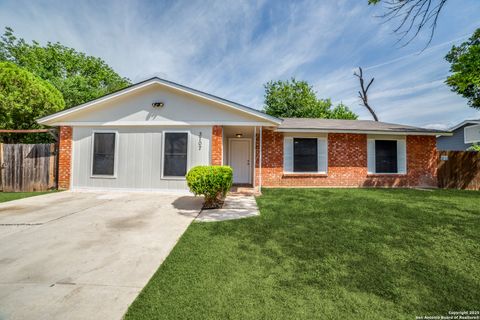
Active
$215,000
3
bds
|
2
ba
|
1,502
sqft
|
built
1983
8304 Spring Town St, Converse, TX 78109
$-307
Cash flow
-7.4%
Cash-on-Cash Return
4.0%
Cap rate
0.7%
Rent to Value Ratio

Active
$340,000
5
bds
|
3
ba
|
2,974
sqft
|
built
2018
6814 Foster Flds, Converse, TX 78109
$-445
Cash flow
-6.8%
Cash-on-Cash Return
4.1%
Cap rate
0.7%
Rent to Value Ratio

Active
$495,000
4
bds
|
3
ba
|
2,116
sqft
|
built
1993
17411 Canyon Boulder, San Antonio, TX 78248
$-872
Cash flow
-9.2%
Cash-on-Cash Return
3.6%
Cap rate
0.7%
Rent to Value Ratio
Active
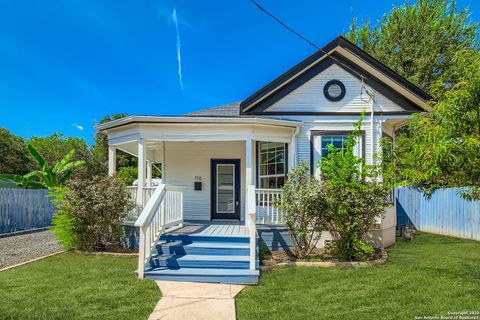
$350,000
2
bds
|
2
ba
|
1,336
sqft
|
built
1920
116 Rehmann St, San Antonio, TX 78204
$-940
Cash flow
-14.0%
Cash-on-Cash Return
2.5%
Cap rate
0.6%
Rent to Value Ratio

Active
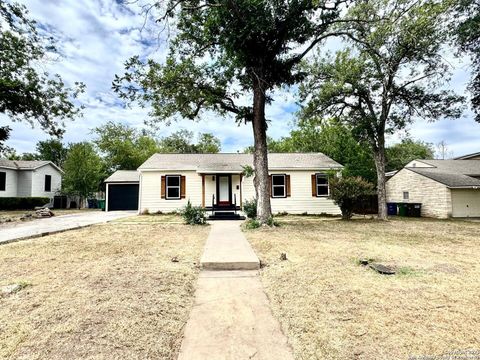
$220,000
3
bds
|
2
ba
|
1,400
sqft
|
built
1942
519 Hoover Ave, San Antonio, TX 78225
$-392
Cash flow
-9.3%
Cash-on-Cash Return
3.5%
Cap rate
0.6%
Rent to Value Ratio

Active
$525,999
4
bds
|
4
ba
|
2,943
sqft
|
built
2021
12344 Fort Duncan, San Antonio, TX 78245
$-933
Cash flow
-9.3%
Cash-on-Cash Return
3.5%
Cap rate
0.7%
Rent to Value Ratio
Active
$285,000
3
bds
|
3
ba
|
1,606
sqft
|
built
1998
9 Pembroke Ct, San Antonio, TX 78240
$-524
Cash flow
-9.6%
Cash-on-Cash Return
3.5%
Cap rate
0.7%
Rent to Value Ratio

Active
$455,000
4
bds
|
3
ba
|
3,191
sqft
|
built
2013
5102 Thymus Dr, San Antonio, TX 78245
$-1,364
Cash flow
-15.6%
Cash-on-Cash Return
2.1%
Cap rate
0.5%
Rent to Value Ratio
Active
$249,999
3
bds
|
2
ba
|
1,583
sqft
|
built
1978
3707 Pipers Cross St, San Antonio, TX 78251
$-534
Cash flow
-11.1%
Cash-on-Cash Return
3.1%
Cap rate
0.6%
Rent to Value Ratio
Active
$249,900
3
bds
|
3
ba
|
2,088
sqft
|
built
2020
7147 Dulce Mdw, San Antonio, TX 78252
$-512
Cash flow
-10.7%
Cash-on-Cash Return
3.2%
Cap rate
0.7%
Rent to Value Ratio

Active
$365,000
4
bds
|
3
ba
|
2,189
sqft
|
built
2013
11648 Northern Star Rd, Schertz, TX 78154
$-942
Cash flow
-13.5%
Cash-on-Cash Return
2.6%
Cap rate
0.6%
Rent to Value Ratio

Active
$509,000
5
bds
|
4
ba
|
3,476
sqft
|
built
2020
7621 Lorca, Boerne, TX 78015
$-1,289
Cash flow
-13.2%
Cash-on-Cash Return
2.6%
Cap rate
0.6%
Rent to Value Ratio

Active
$409,000
4
bds
|
3
ba
|
2,224
sqft
|
built
2020
2506 Castello Way, San Antonio, TX 78259
$-1,338
Cash flow
-17.1%
Cash-on-Cash Return
1.8%
Cap rate
0.5%
Rent to Value Ratio

Active
$349,900
3
bds
|
3
ba
|
3,164
sqft
|
built
1993
1510 Kingsbridge, San Antonio, TX 78253
$-708
Cash flow
-10.6%
Cash-on-Cash Return
3.3%
Cap rate
0.6%
Rent to Value Ratio
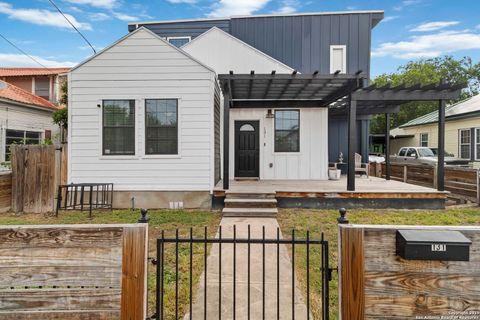
Active
$695,000
4
bds
|
3
ba
|
2,677
sqft
|
built
2018
131 Rehmann St, San Antonio, TX 78204
$-2,249
Cash flow
-16.9%
Cash-on-Cash Return
1.8%
Cap rate
0.5%
Rent to Value Ratio
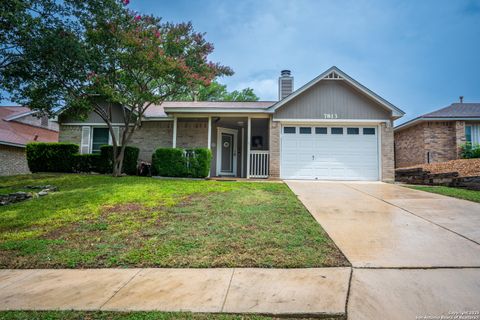
Active
$208,999
2
bds
|
1
ba
|
1,152
sqft
|
built
1983
7813 Forest Briar, Live Oak, TX 78233
$-379
Cash flow
-9.5%
Cash-on-Cash Return
3.5%
Cap rate
0.7%
Rent to Value Ratio
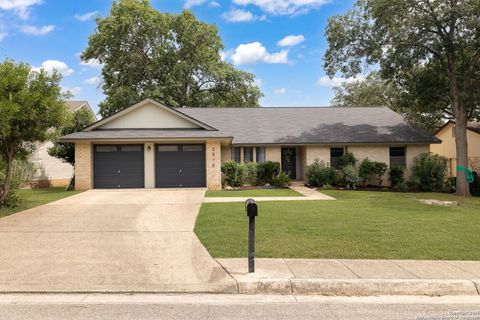
Active
$412,000
4
bds
|
2
ba
|
2,416
sqft
|
built
1979
2515 Reston Dr, San Antonio, TX 78232
$-890
Cash flow
-11.3%
Cash-on-Cash Return
3.1%
Cap rate
0.6%
Rent to Value Ratio
Active
$225,000
3
bds
|
3
ba
|
1,501
sqft
|
built
2000
6143 Lyndell Spgs, San Antonio, TX 78244
$-264
Cash flow
-6.1%
Cash-on-Cash Return
4.3%
Cap rate
0.7%
Rent to Value Ratio

Active
$230,000
3
bds
|
3
ba
|
1,948
sqft
|
built
2008
5314 Harefield Dr, San Antonio, TX 78228
$-325
Cash flow
-7.4%
Cash-on-Cash Return
4.0%
Cap rate
0.8%
Rent to Value Ratio

Active
$329,900
3
bds
|
2
ba
|
1,721
sqft
|
built
2018
11911 Casparis, San Antonio, TX 78254
$-714
Cash flow
-11.3%
Cash-on-Cash Return
3.1%
Cap rate
0.6%
Rent to Value Ratio
Active
$270,000
3
bds
|
2
ba
|
1,684
sqft
|
built
1969
211 Greycliff Dr, Live Oak, TX 78233
$-557
Cash flow
-10.8%
Cash-on-Cash Return
3.2%
Cap rate
0.7%
Rent to Value Ratio

Active
$869,880
4
bds
|
3
ba
|
3,065
sqft
|
built
1974
10156 Axis Cir, Boerne, TX 78006
$-2,607
Cash flow
-15.6%
Cash-on-Cash Return
2.1%
Cap rate
0.5%
Rent to Value Ratio