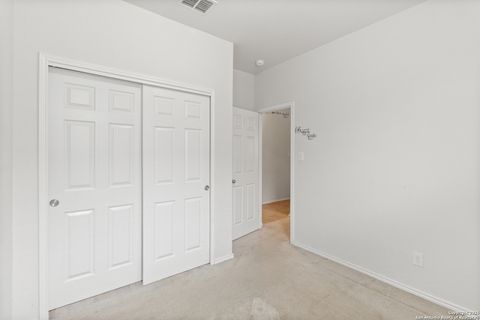
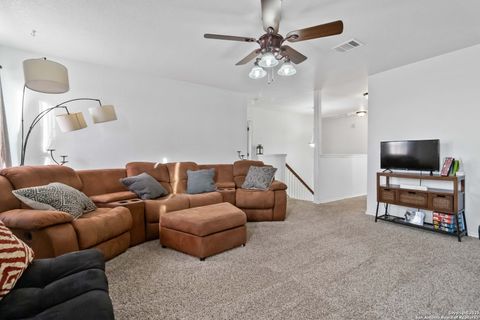
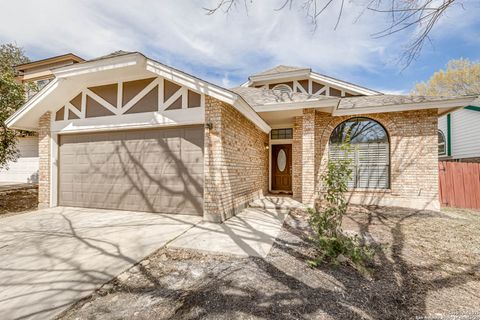
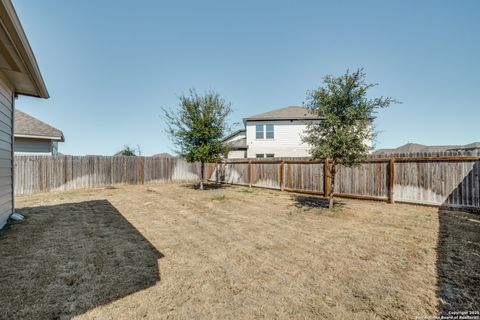
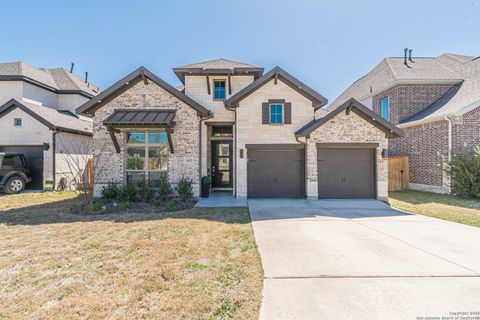
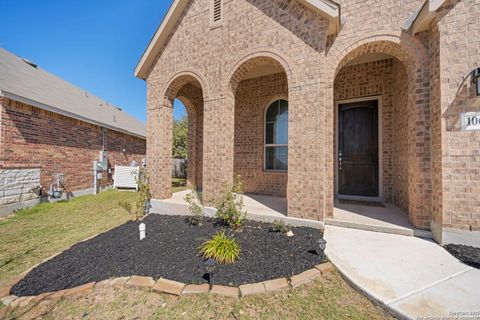
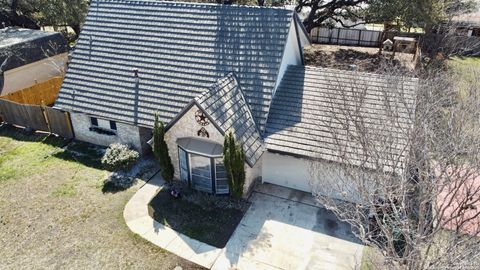
Bexar County Investment Properties for Sale
Browse homes for sale and investment properties in Bexar County. Refine your search by price, property type, or more.
Best cash flowing properties in Bexar County

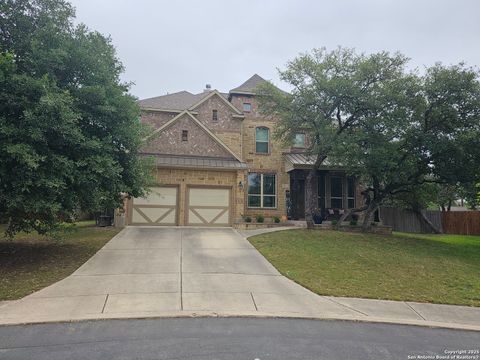
Active
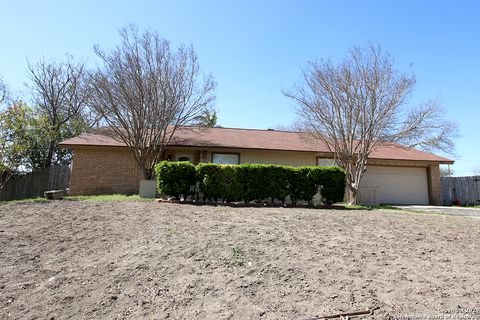
$114,900
1
bds
|
1
ba
|
400
sqft
|
built
1948
534 Sharmain Pl, San Antonio, TX 78221
$-106
Cash flow
-4.8%
Cash-on-Cash Return
4.6%
Cap rate
0.8%
Rent to Value Ratio

Active
$199,900
3
bds
|
2
ba
|
1,399
sqft
|
built
2006
6635 Hartnet Flds, Converse, TX 78109
$-299
Cash flow
-7.8%
Cash-on-Cash Return
3.9%
Cap rate
0.7%
Rent to Value Ratio
3,836 out of 4,208 properties for sale in Bexar County
Limited Results Shown
Create a free account, or log in to reveal all property listings and enjoy the complete experience.

Active
$239,900
2
bds
|
3
ba
|
1,660
sqft
|
built
1996
2779 Del Pilar Dr, San Antonio, TX 78232
$-397
Cash flow
-8.6%
Cash-on-Cash Return
3.7%
Cap rate
0.8%
Rent to Value Ratio

Active
$674,000
4
bds
|
3
ba
|
3,426
sqft
|
built
2013
1907 Lindaver Ln, San Antonio, TX 78260
$-1,890
Cash flow
-14.6%
Cash-on-Cash Return
2.3%
Cap rate
0.5%
Rent to Value Ratio

Active
$750,000
3
bds
|
0
ba
|
1,800
sqft
|
built
1927
333 Florida St, San Antonio, TX 78210
$-3,464
Cash flow
-24.1%
Cash-on-Cash Return
0.1%
Cap rate
0.2%
Rent to Value Ratio

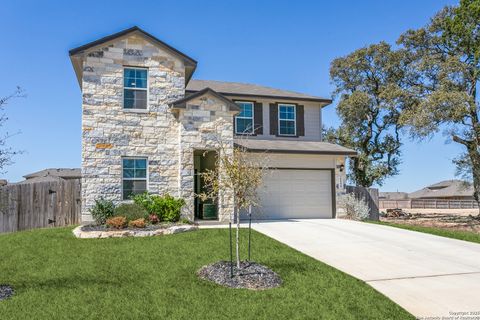
Active
$389,000
5
bds
|
3
ba
|
2,374
sqft
|
built
1968
5318 King George Dr, San Antonio, TX 78229
$-865
Cash flow
-11.6%
Cash-on-Cash Return
3.0%
Cap rate
0.6%
Rent to Value Ratio

Active
$549,000
4
bds
|
4
ba
|
2,298
sqft
|
built
2021
102 Tendick, San Antonio, TX 78209
$-1,867
Cash flow
-17.7%
Cash-on-Cash Return
1.6%
Cap rate
0.6%
Rent to Value Ratio
Active
$274,950
3
bds
|
2
ba
|
1,764
sqft
|
built
1973
13523 Brinwood, Universal City, TX 78148
$-536
Cash flow
-10.2%
Cash-on-Cash Return
3.3%
Cap rate
0.7%
Rent to Value Ratio

Active
$165,000
1
bds
|
2
ba
|
1,028
sqft
|
built
1983
11815 Vance Jackson Rd, San Antonio, TX 78230
$-503
Cash flow
-15.9%
Cash-on-Cash Return
2.0%
Cap rate
0.8%
Rent to Value Ratio

Active
$745,000
4
bds
|
5
ba
|
4,997
sqft
|
built
2000
606 E Sunshine Dr, San Antonio, TX 78228
$-2,564
Cash flow
-18.0%
Cash-on-Cash Return
1.5%
Cap rate
0.5%
Rent to Value Ratio

Active
$263,900
4
bds
|
3
ba
|
1,596
sqft
|
built
2021
10215 Braunig, San Antonio, TX 78252
$-504
Cash flow
-10.0%
Cash-on-Cash Return
3.4%
Cap rate
0.7%
Rent to Value Ratio

Active
$1,100,000
4
bds
|
4
ba
|
3,610
sqft
|
built
1934
422 E Hildebrand Ave, San Antonio, TX 78212
$-4,433
Cash flow
-21.0%
Cash-on-Cash Return
0.8%
Cap rate
0.3%
Rent to Value Ratio

Active
$863,000
3
bds
|
3
ba
|
2,571
sqft
|
built
2018
18810 Canyon View Pass, Helotes, TX 78023
$-2,865
Cash flow
-17.3%
Cash-on-Cash Return
1.7%
Cap rate
0.4%
Rent to Value Ratio

Active
$600,000
2
bds
|
2
ba
|
2,438
sqft
|
built
1925
243 E Lullwood Ave, San Antonio, TX 78212
$-2,163
Cash flow
-18.8%
Cash-on-Cash Return
1.4%
Cap rate
0.4%
Rent to Value Ratio
Active
$569,500
5
bds
|
4
ba
|
3,520
sqft
|
built
2019
1912 Pitcher Bnd, San Antonio, TX 78253
$-1,408
Cash flow
-12.9%
Cash-on-Cash Return
2.7%
Cap rate
0.6%
Rent to Value Ratio
Active
$350,000
3
bds
|
2
ba
|
2,086
sqft
|
built
2011
12535 Quarter J, San Antonio, TX 78254
$-840
Cash flow
-12.5%
Cash-on-Cash Return
2.8%
Cap rate
0.6%
Rent to Value Ratio
Active
$135,000
1
bds
|
1
ba
|
818
sqft
|
built
1982
11610 Vance Jackson Rd, San Antonio, TX 78230
$-427
Cash flow
-16.5%
Cash-on-Cash Return
1.9%
Cap rate
0.8%
Rent to Value Ratio
Active
$269,900
3
bds
|
2
ba
|
1,817
sqft
|
built
2014
6754 Indian Ldg, San Antonio, TX 78253
$-402
Cash flow
-7.8%
Cash-on-Cash Return
3.9%
Cap rate
0.7%
Rent to Value Ratio
Active
$265,000
4
bds
|
3
ba
|
2,485
sqft
|
built
2009
7015 Fisherman Sky, San Antonio, TX 78244
$-504
Cash flow
-9.9%
Cash-on-Cash Return
3.4%
Cap rate
0.8%
Rent to Value Ratio

Active
$699,999
4
bds
|
2
ba
|
2,083
sqft
|
built
1915
116 E French Pl, San Antonio, TX 78212
$-2,110
Cash flow
-15.7%
Cash-on-Cash Return
2.1%
Cap rate
0.5%
Rent to Value Ratio
Active
$268,000
3
bds
|
2
ba
|
1,374
sqft
|
built
1956
314 Haverford Dr, San Antonio, TX 78217
$-593
Cash flow
-11.5%
Cash-on-Cash Return
3.0%
Cap rate
0.6%
Rent to Value Ratio
Active
$289,000
4
bds
|
2
ba
|
1,854
sqft
|
built
1987
7655 Spanish Wood, San Antonio, TX 78249
$-592
Cash flow
-10.7%
Cash-on-Cash Return
3.2%
Cap rate
0.7%
Rent to Value Ratio
Active
$420,000
4
bds
|
3
ba
|
2,257
sqft
|
built
2023
21227 Stonework Spur, San Antonio, TX 78266
$-858
Cash flow
-10.7%
Cash-on-Cash Return
3.2%
Cap rate
0.6%
Rent to Value Ratio
Active
$230,000
3
bds
|
2
ba
|
1,050
sqft
|
built
1999
139 Nancy Pl, San Antonio, TX 78204
$-347
Cash flow
-7.9%
Cash-on-Cash Return
3.9%
Cap rate
0.6%
Rent to Value Ratio

Active
$1,100,000
3
bds
|
4
ba
|
3,214
sqft
|
built
2021
18335 Powder Ml, San Antonio, TX 78257
$-4,108
Cash flow
-19.5%
Cash-on-Cash Return
1.2%
Cap rate
0.4%
Rent to Value Ratio
Active
$231,973
2
bds
|
1
ba
|
816
sqft
|
built
2021
4803 Blue Beech Dr, Elmendorf, TX 78112
$-659
Cash flow
-14.8%
Cash-on-Cash Return
2.3%
Cap rate
0.6%
Rent to Value Ratio
Active
$270,000
3
bds
|
3
ba
|
1,605
sqft
|
built
2022
6215 Willow Point Blvd, San Antonio, TX 78219
$-513
Cash flow
-9.9%
Cash-on-Cash Return
3.4%
Cap rate
0.7%
Rent to Value Ratio

Active
$220,000
3
bds
|
2
ba
|
1,140
sqft
|
built
1949
726 Gabriel, San Antonio, TX 78202
$-335
Cash flow
-7.9%
Cash-on-Cash Return
3.9%
Cap rate
0.7%
Rent to Value Ratio

Active
$469,000
4
bds
|
3
ba
|
3,201
sqft
|
built
2005
1315 Tanager Ct, San Antonio, TX 78260
$-885
Cash flow
-9.8%
Cash-on-Cash Return
3.4%
Cap rate
0.7%
Rent to Value Ratio

Active
$415,000
5
bds
|
4
ba
|
2,004
sqft
|
built
2006
58 Dolores Ave, San Antonio, TX 78228
$-1,237
Cash flow
-15.6%
Cash-on-Cash Return
2.1%
Cap rate
0.4%
Rent to Value Ratio

Active
$385,000
4
bds
|
3
ba
|
2,115
sqft
|
built
1970
11627 Raindrop Dr, San Antonio, TX 78216
$-929
Cash flow
-12.6%
Cash-on-Cash Return
2.8%
Cap rate
0.6%
Rent to Value Ratio

Active
$324,900
4
bds
|
3
ba
|
2,179
sqft
|
built
2022
6424 Embankment Rd, San Antonio, TX 78252
$-741
Cash flow
-11.9%
Cash-on-Cash Return
2.9%
Cap rate
0.6%
Rent to Value Ratio

Active
$899,000
4
bds
|
3
ba
|
3,501
sqft
|
built
1925
343 W Gramercy Pl, San Antonio, TX 78212
$-2,588
Cash flow
-15.0%
Cash-on-Cash Return
2.2%
Cap rate
0.5%
Rent to Value Ratio
Active
$385,000
4
bds
|
2
ba
|
1,992
sqft
|
built
2021
14147 Blind Bandit Crk, San Antonio, TX 78254
$-899
Cash flow
-12.2%
Cash-on-Cash Return
2.9%
Cap rate
0.6%
Rent to Value Ratio

Active
$279,000
3
bds
|
2
ba
|
1,475
sqft
|
built
1967
5110 Village Row, San Antonio, TX 78218
$-675
Cash flow
-12.6%
Cash-on-Cash Return
2.8%
Cap rate
0.6%
Rent to Value Ratio
Active
$449,900
4
bds
|
3
ba
|
2,549
sqft
|
built
2022
1470 Pitcher Bnd, San Antonio, TX 78253
$-929
Cash flow
-10.8%
Cash-on-Cash Return
3.2%
Cap rate
0.6%
Rent to Value Ratio
Active
$429,999
4
bds
|
3
ba
|
2,169
sqft
|
built
2021
10619 Revolver Trl, San Antonio, TX 78254
$-1,069
Cash flow
-13.0%
Cash-on-Cash Return
2.7%
Cap rate
0.5%
Rent to Value Ratio
Active
$339,500
4
bds
|
3
ba
|
2,344
sqft
|
built
1967
6410 Ingram Rd, San Antonio, TX 78238
$-612
Cash flow
-9.4%
Cash-on-Cash Return
3.5%
Cap rate
0.7%
Rent to Value Ratio
Active
$544,000
4
bds
|
3
ba
|
3,596
sqft
|
built
2014
5210 Anemone, San Antonio, TX 78253
$-1,326
Cash flow
-12.7%
Cash-on-Cash Return
2.8%
Cap rate
0.6%
Rent to Value Ratio
Active
$331,700
4
bds
|
3
ba
|
3,070
sqft
|
built
2006
7903 Gate Brg, Selma, TX 78154
$-490
Cash flow
-7.7%
Cash-on-Cash Return
3.9%
Cap rate
0.7%
Rent to Value Ratio