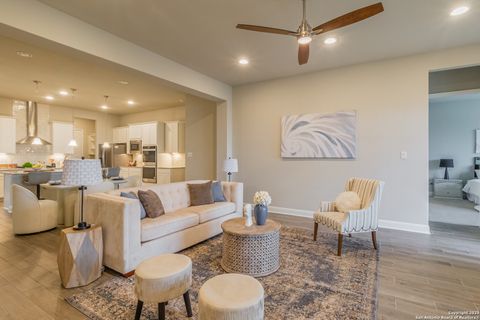
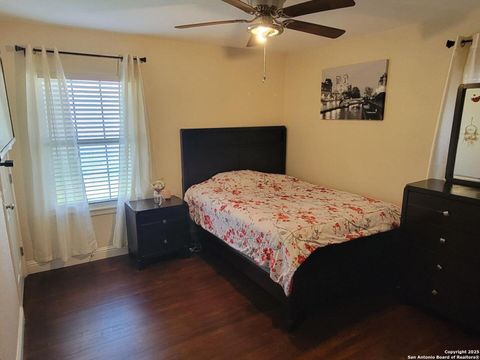
Bexar County Investment Properties for Sale
Browse homes for sale and investment properties in Bexar County. Refine your search by price, property type, or more.
Best cash flowing properties in Bexar County
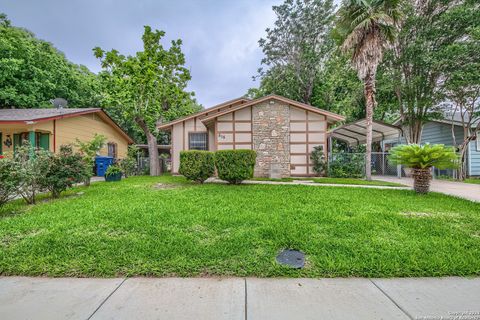
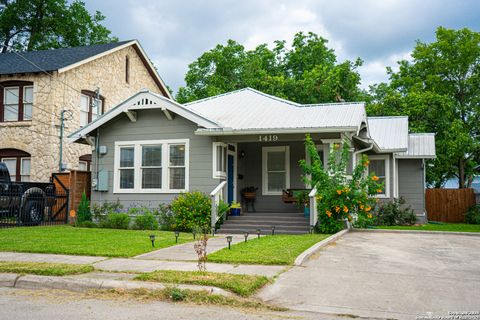
Active
$154,900
3
bds
|
2
ba
|
1,015
sqft
|
built
1970
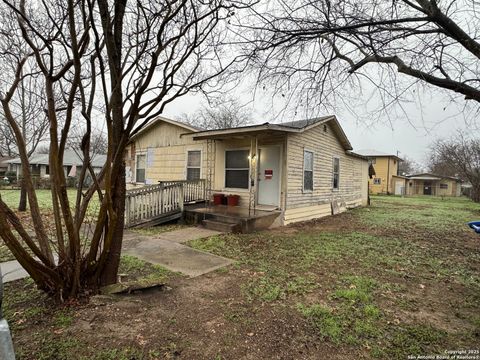
515 Park Meadow Dr, San Antonio, TX 78227
$56
Cash flow
1.9%
Cash-on-Cash Return
6.1%
Cap rate
1.0%
Rent to Value Ratio

Active
$139,975
2
bds
|
1
ba
|
852
sqft
|
built
1941
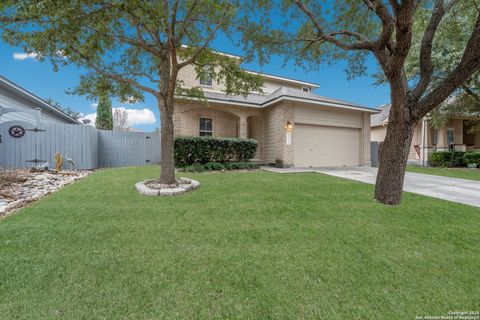
426 Royston Ave, San Antonio, TX 78225
$34
Cash flow
1.3%
Cash-on-Cash Return
6.0%
Cap rate
1.0%
Rent to Value Ratio
3,836 out of 4,208 properties for sale in Bexar County
Limited Results Shown
Create a free account, or log in to reveal all property listings and enjoy the complete experience.

Active
$224,000
3
bds
|
3
ba
|
1,553
sqft
|
built
2007
5714 Fossil Cyn, San Antonio, TX 78252
$-342
Cash flow
-8.0%
Cash-on-Cash Return
3.8%
Cap rate
0.7%
Rent to Value Ratio
Active
$385,000
3
bds
|
3
ba
|
1,638
sqft
|
built
2022
9019 Stillwater Pass, San Antonio, TX 78254
$-678
Cash flow
-9.2%
Cash-on-Cash Return
3.6%
Cap rate
0.6%
Rent to Value Ratio

Active
$249,500
4
bds
|
2
ba
|
1,668
sqft
|
built
2022
5926 Seaside Mnr, Converse, TX 78109
$-505
Cash flow
-10.6%
Cash-on-Cash Return
3.3%
Cap rate
0.7%
Rent to Value Ratio
Active
$214,000
3
bds
|
2
ba
|
1,276
sqft
|
built
2023
4117 Cataract Cir, San Antonio, TX 78223
$-249
Cash flow
-6.1%
Cash-on-Cash Return
4.3%
Cap rate
0.7%
Rent to Value Ratio

Active
$350,000
3
bds
|
3
ba
|
1,258
sqft
|
built
1910
521 N Palmetto, San Antonio, TX 78202
$-945
Cash flow
-14.1%
Cash-on-Cash Return
2.4%
Cap rate
0.6%
Rent to Value Ratio

Active
$279,000
3
bds
|
3
ba
|
2,299
sqft
|
built
2021
5922 Rolling Trail Dr, San Antonio, TX 78250
$-620
Cash flow
-11.6%
Cash-on-Cash Return
3.0%
Cap rate
0.7%
Rent to Value Ratio

Active
$349,900
4
bds
|
3
ba
|
3,288
sqft
|
built
1999
15810 Marisa Pl, San Antonio, TX 78247
$-651
Cash flow
-9.7%
Cash-on-Cash Return
3.4%
Cap rate
0.7%
Rent to Value Ratio
Active
$340,000
4
bds
|
3
ba
|
2,358
sqft
|
built
2018
8547 Laxey Wheel, San Antonio, TX 78254
$-609
Cash flow
-9.3%
Cash-on-Cash Return
3.5%
Cap rate
0.7%
Rent to Value Ratio
Active
$949,999
4
bds
|
5
ba
|
4,084
sqft
|
built
2017
4102 Monteverde Run, San Antonio, TX 78261
$-3,900
Cash flow
-21.4%
Cash-on-Cash Return
0.8%
Cap rate
0.4%
Rent to Value Ratio

Active
$479,000
4
bds
|
4
ba
|
3,455
sqft
|
built
1994
4114 Luckenbach Rd, San Antonio, TX 78251
$-1,325
Cash flow
-14.4%
Cash-on-Cash Return
2.4%
Cap rate
0.6%
Rent to Value Ratio
Active
$224,000
3
bds
|
2
ba
|
1,412
sqft
|
built
2005
6603 Elmer Blvd, San Antonio, TX 78227
$-304
Cash flow
-7.1%
Cash-on-Cash Return
4.1%
Cap rate
0.7%
Rent to Value Ratio

Active
$209,000
2
bds
|
2
ba
|
1,868
sqft
|
built
1973
3678 Hidden Dr, San Antonio, TX 78217
$-628
Cash flow
-15.7%
Cash-on-Cash Return
2.1%
Cap rate
0.8%
Rent to Value Ratio

Active
$315,000
3
bds
|
2
ba
|
1,866
sqft
|
built
2013
9050 Herman Holw, San Antonio, TX 78254
$-639
Cash flow
-10.6%
Cash-on-Cash Return
3.2%
Cap rate
0.6%
Rent to Value Ratio

Active
$199,000
2
bds
|
2
ba
|
902
sqft
|
built
1982
14122 Churchill Estates Blvd, San Antonio, TX 78248
$-760
Cash flow
-19.9%
Cash-on-Cash Return
1.1%
Cap rate
0.7%
Rent to Value Ratio

Active
$449,000
6
bds
|
0
ba
|
3,405
sqft
|
built
1935
404 Donaldson Ave, San Antonio, TX 78201
$-1,928
Cash flow
-22.4%
Cash-on-Cash Return
0.5%
Cap rate
0.2%
Rent to Value Ratio

Active
$229,500
4
bds
|
0
ba
|
1,296
sqft
|
built
1966
1222 Gardina St, San Antonio, TX 78201
$-642
Cash flow
-14.6%
Cash-on-Cash Return
2.3%
Cap rate
0.5%
Rent to Value Ratio

Active
$203,900
2
bds
|
2
ba
|
1,450
sqft
|
built
2022
427 Filibusters Trl, San Antonio, TX 78220
$-397
Cash flow
-10.2%
Cash-on-Cash Return
3.3%
Cap rate
0.8%
Rent to Value Ratio
Active
$350,000
2
bds
|
2
ba
|
1,209
sqft
|
built
2016
330 Clay St, San Antonio, TX 78204
$-1,047
Cash flow
-15.6%
Cash-on-Cash Return
2.1%
Cap rate
0.6%
Rent to Value Ratio

Active
$195,000
3
bds
|
2
ba
|
2,302
sqft
|
built
1958
194 Olga St, San Antonio, TX 78237
$-234
Cash flow
-6.3%
Cash-on-Cash Return
4.2%
Cap rate
0.8%
Rent to Value Ratio

Active
$260,000
2
bds
|
2
ba
|
1,162
sqft
|
built
1935
134 Arlington Ct, San Antonio, TX 78210
$-260
Cash flow
-5.2%
Cash-on-Cash Return
4.5%
Cap rate
0.7%
Rent to Value Ratio
Active
$426,500
5
bds
|
3
ba
|
2,700
sqft
|
built
1987
25002 Silverstone, San Antonio, TX 78258
$-1,276
Cash flow
-15.6%
Cash-on-Cash Return
2.1%
Cap rate
0.6%
Rent to Value Ratio
Active
$309,900
3
bds
|
2
ba
|
1,710
sqft
|
built
1931
1419 Nolan St, San Antonio, TX 78202
$-987
Cash flow
-16.6%
Cash-on-Cash Return
1.9%
Cap rate
0.6%
Rent to Value Ratio
Active
$485,000
4
bds
|
4
ba
|
2,430
sqft
|
built
2023
108 Rosanna Rdg, Universal City, TX 78148
$-1,006
Cash flow
-10.8%
Cash-on-Cash Return
3.2%
Cap rate
0.7%
Rent to Value Ratio

Active
$430,000
4
bds
|
4
ba
|
2,799
sqft
|
built
2016
8707 Shady Mtn, San Antonio, TX 78254
$-971
Cash flow
-11.8%
Cash-on-Cash Return
3.0%
Cap rate
0.7%
Rent to Value Ratio

Active
$275,000
3
bds
|
2
ba
|
1,056
sqft
|
built
1956
9455 S Foster Rd, San Antonio, TX 78222
$-302
Cash flow
-5.7%
Cash-on-Cash Return
4.4%
Cap rate
0.7%
Rent to Value Ratio

Active
$572,500
3
bds
|
3
ba
|
2,585
sqft
|
built
2010
6963 Hallie Hts, Schertz, TX 78154
$-1,478
Cash flow
-13.5%
Cash-on-Cash Return
2.6%
Cap rate
0.5%
Rent to Value Ratio

Active
$475,000
3
bds
|
2
ba
|
1,414
sqft
|
built
1969
10212 Whip O Will Way, Helotes, TX 78023
$-1,448
Cash flow
-15.9%
Cash-on-Cash Return
2.0%
Cap rate
0.4%
Rent to Value Ratio

Active
$2,095,000
5
bds
|
5
ba
|
7,402
sqft
|
built
1999
3 Byron Nelson, San Antonio, TX 78257
$-7,978
Cash flow
-19.9%
Cash-on-Cash Return
1.1%
Cap rate
0.3%
Rent to Value Ratio
Active
$190,000
3
bds
|
2
ba
|
1,484
sqft
|
built
1957
4611 Creekmoor Dr, San Antonio, TX 78220
$-192
Cash flow
-5.3%
Cash-on-Cash Return
4.5%
Cap rate
0.8%
Rent to Value Ratio
Active
$675,000
4
bds
|
3
ba
|
3,547
sqft
|
built
2008
903 Bumelia Dr, San Antonio, TX 78260
$-1,129
Cash flow
-8.7%
Cash-on-Cash Return
3.7%
Cap rate
0.7%
Rent to Value Ratio
Active
$120,000
2
bds
|
1
ba
|
1,045
sqft
|
built
1955
1706 Santa Rita, San Antonio, TX 78214
$17
Cash flow
0.7%
Cash-on-Cash Return
5.9%
Cap rate
1.0%
Rent to Value Ratio

Active
$355,000
4
bds
|
3
ba
|
1,999
sqft
|
built
2018
6106 Akin Elm, San Antonio, TX 78261
$-769
Cash flow
-11.3%
Cash-on-Cash Return
3.1%
Cap rate
0.6%
Rent to Value Ratio

Active
$750,000
7
bds
|
0
ba
|
3,345
sqft
|
built
1948
425 Parland Pl, San Antonio, TX 78209
$-3,694
Cash flow
-25.7%
Cash-on-Cash Return
-0.2%
Cap rate
0.3%
Rent to Value Ratio
Active
$295,000
4
bds
|
3
ba
|
2,344
sqft
|
built
2008
9955 Meadow Lark, Converse, TX 78109
$-579
Cash flow
-10.2%
Cash-on-Cash Return
3.3%
Cap rate
0.7%
Rent to Value Ratio

Active
$275,000
3
bds
|
1
ba
|
1,640
sqft
|
built
1940
2106 Steves Ave, San Antonio, TX 78210
$-556
Cash flow
-10.5%
Cash-on-Cash Return
3.3%
Cap rate
0.7%
Rent to Value Ratio
Active
$875,000
3
bds
|
2
ba
|
2,091
sqft
|
built
1974
12120 Schaefer Rd, Schertz, TX 78108
$0
Cash flow
n/a
Cash-on-Cash Return
n/a
Cap rate
n/a
Rent to Value Ratio
Active
$380,000
3
bds
|
2
ba
|
2,300
sqft
|
built
2006
12943 Palatine Hl, San Antonio, TX 78253
$-958
Cash flow
-13.2%
Cash-on-Cash Return
2.7%
Cap rate
0.6%
Rent to Value Ratio

Active
$215,000
3
bds
|
2
ba
|
1,311
sqft
|
built
2012
714 Canadian Goose, San Antonio, TX 78245
$-335
Cash flow
-8.1%
Cash-on-Cash Return
3.8%
Cap rate
0.7%
Rent to Value Ratio