Bexar County Investment Properties for Sale
Browse homes for sale and investment properties in Bexar County. Refine your search by price, property type, or more.
Best cash flowing properties in Bexar County

Active
$69,900
2
bds
|
1
ba
|
624
sqft
|
built
1930
118 Eross, San Antonio, TX 78202
$433
Cash flow
7.2%
Cash-on-Cash Return
7.4%
Cap rate
1.3%
Rent to Value Ratio

Active
$195,000
3
bds
|
3
ba
|
1,187
sqft
|
built
2022
8151 Nube Medina, San Antonio, TX 78252
$42
Cash flow
1.1%
Cash-on-Cash Return
5.9%
Cap rate
1.0%
Rent to Value Ratio
4,322 out of 4,729 properties for sale in Bexar County
Limited Results Shown
Create a free account, or log in to reveal all property listings and enjoy the complete experience.
Active
$289,900
3
bds
|
3
ba
|
2,195
sqft
|
built
2000
9458 Sycamore Brk, San Antonio, TX 78254
$-636
Cash flow
-11.4%
Cash-on-Cash Return
3.0%
Cap rate
0.7%
Rent to Value Ratio

Active
$234,000
3
bds
|
2
ba
|
1,216
sqft
|
built
1968
207 Brenda Dr, Converse, TX 78109
$-466
Cash flow
-10.4%
Cash-on-Cash Return
3.3%
Cap rate
0.6%
Rent to Value Ratio
Active
$290,000
4
bds
|
2
ba
|
1,835
sqft
|
built
2006
5002 Fountain Hl, San Antonio, TX 78244
$-657
Cash flow
-11.8%
Cash-on-Cash Return
3.0%
Cap rate
0.6%
Rent to Value Ratio

Active
$260,000
3
bds
|
2
ba
|
1,392
sqft
|
built
1959
4542 Lyceum Dr, San Antonio, TX 78229
$-306
Cash flow
-6.1%
Cash-on-Cash Return
4.3%
Cap rate
0.8%
Rent to Value Ratio

Active
$215,000
3
bds
|
2
ba
|
1,182
sqft
|
built
1983
11426 Black Fox Dr, San Antonio, TX 78245
$-257
Cash flow
-6.2%
Cash-on-Cash Return
4.2%
Cap rate
0.7%
Rent to Value Ratio

Active
$1,395,000
5
bds
|
5
ba
|
4,381
sqft
|
built
1930
134 W Elsmere Pl, San Antonio, TX 78212
$-4,331
Cash flow
-16.2%
Cash-on-Cash Return
2.0%
Cap rate
0.5%
Rent to Value Ratio
Active
$245,000
3
bds
|
3
ba
|
2,102
sqft
|
built
2005
215 Quince Flower, San Antonio, TX 78253
$-302
Cash flow
-6.4%
Cash-on-Cash Return
4.2%
Cap rate
0.7%
Rent to Value Ratio

Active
$499,000
5
bds
|
4
ba
|
3,044
sqft
|
built
2017
11921 Spoke Holw, Schertz, TX 78154
$-1,546
Cash flow
-16.2%
Cash-on-Cash Return
2.0%
Cap rate
0.6%
Rent to Value Ratio
Active
$243,400
3
bds
|
2
ba
|
1,577
sqft
|
built
2005
10251 Crystal Vw, Universal City, TX 78148
$-308
Cash flow
-6.6%
Cash-on-Cash Return
4.2%
Cap rate
0.8%
Rent to Value Ratio

Active
$195,000
2
bds
|
1
ba
|
871
sqft
|
built
1935
414 Barrett Pl, San Antonio, TX 78225
$-354
Cash flow
-9.5%
Cash-on-Cash Return
3.5%
Cap rate
0.7%
Rent to Value Ratio
Active
$200,000
3
bds
|
2
ba
|
1,444
sqft
|
built
2005
7727 Cortland Oak, San Antonio, TX 78254
$-121
Cash flow
-3.2%
Cash-on-Cash Return
5.0%
Cap rate
0.9%
Rent to Value Ratio

Active
$315,000
3
bds
|
2
ba
|
1,667
sqft
|
built
1986
2411 Facet Oak, San Antonio, TX 78232
$-578
Cash flow
-9.6%
Cash-on-Cash Return
3.5%
Cap rate
0.6%
Rent to Value Ratio
Active
$305,000
4
bds
|
3
ba
|
1,622
sqft
|
built
2021
7353 Storms End, San Antonio, TX 78253
$-662
Cash flow
-11.3%
Cash-on-Cash Return
3.1%
Cap rate
0.6%
Rent to Value Ratio

Active
$278,000
3
bds
|
2
ba
|
1,878
sqft
|
built
1997
8626 Park Olympia, Universal City, TX 78148
$-651
Cash flow
-12.2%
Cash-on-Cash Return
2.9%
Cap rate
0.6%
Rent to Value Ratio
Active
$314,000
4
bds
|
2
ba
|
1,700
sqft
|
built
2022
9927 Pears Ml, San Antonio, TX 78254
$-373
Cash flow
-6.2%
Cash-on-Cash Return
4.3%
Cap rate
0.7%
Rent to Value Ratio

Active
$235,000
3
bds
|
2
ba
|
2,095
sqft
|
built
1966
7500 Callaghan Rd, San Antonio, TX 78229
$-740
Cash flow
-16.4%
Cash-on-Cash Return
1.9%
Cap rate
0.9%
Rent to Value Ratio

Active
$325,000
3
bds
|
2
ba
|
1,608
sqft
|
built
1973
8223 Joe Dimaggio St, San Antonio, TX 78240
$-788
Cash flow
-12.7%
Cash-on-Cash Return
2.8%
Cap rate
0.6%
Rent to Value Ratio
Active
$83,500
1
bds
|
1
ba
|
664
sqft
|
built
1968
911 Vance Jackson Rd, San Antonio, TX 78201
$-173
Cash flow
-10.8%
Cash-on-Cash Return
3.2%
Cap rate
1.2%
Rent to Value Ratio

Active
$850,000
4
bds
|
4
ba
|
3,758
sqft
|
built
2004
26039 Echo Mtn, San Antonio, TX 78260
$-2,141
Cash flow
-13.1%
Cash-on-Cash Return
2.7%
Cap rate
0.5%
Rent to Value Ratio

Active
$378,000
4
bds
|
3
ba
|
2,976
sqft
|
built
1992
13602 Possum Hl, San Antonio, TX 78232
$-878
Cash flow
-12.1%
Cash-on-Cash Return
2.9%
Cap rate
0.7%
Rent to Value Ratio

Active
$3,195,000
5
bds
|
7
ba
|
4,788
sqft
|
built
2003
34 Galleria Dr, San Antonio, TX 78257
$-14,096
Cash flow
-23.0%
Cash-on-Cash Return
0.4%
Cap rate
0.1%
Rent to Value Ratio

Active
$850,000
4
bds
|
4
ba
|
4,279
sqft
|
built
2005
23019 Prescott Fls, San Antonio, TX 78255
$-1,922
Cash flow
-11.8%
Cash-on-Cash Return
3.0%
Cap rate
0.6%
Rent to Value Ratio

Active
$203,000
3
bds
|
2
ba
|
1,095
sqft
|
built
1984
10015 Amber Field Dr, San Antonio, TX 78245
$-140
Cash flow
-3.6%
Cash-on-Cash Return
4.9%
Cap rate
0.8%
Rent to Value Ratio
Active
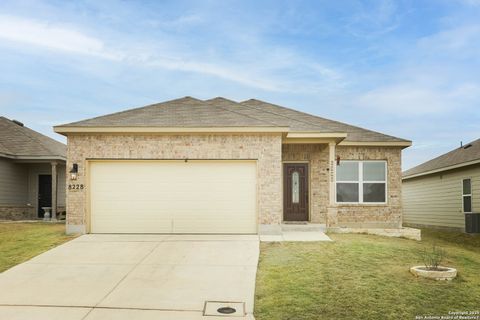
$279,000
3
bds
|
2
ba
|
1,612
sqft
|
built
2022
8228 Brucks Dr, San Antonio, TX 78244
$-589
Cash flow
-11.0%
Cash-on-Cash Return
3.1%
Cap rate
0.6%
Rent to Value Ratio
Active
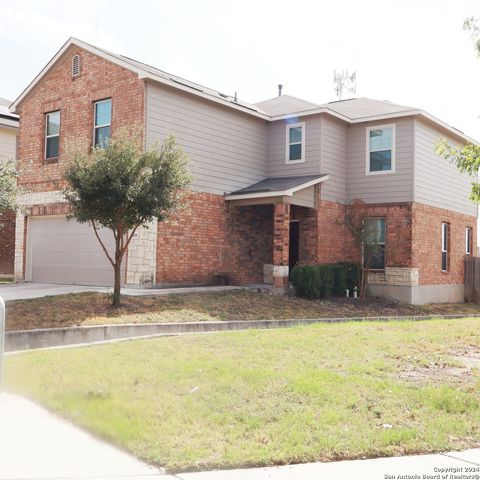
$278,000
3
bds
|
3
ba
|
2,138
sqft
|
built
2017
11830 Bricewood Pass, San Antonio, TX 78254
$-545
Cash flow
-10.2%
Cash-on-Cash Return
3.3%
Cap rate
0.7%
Rent to Value Ratio

Active
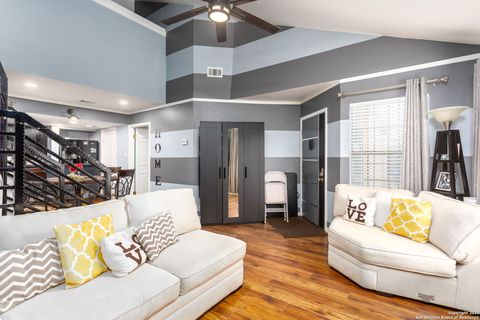
$295,000
3
bds
|
3
ba
|
1,519
sqft
|
built
1966
7707 Broadway, San Antonio, TX 78209
$-1,513
Cash flow
-26.8%
Cash-on-Cash Return
-0.5%
Cap rate
0.7%
Rent to Value Ratio

Active
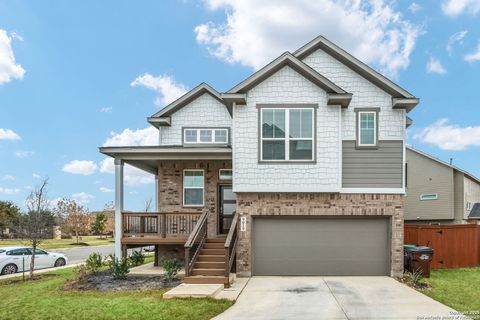
$490,000
3
bds
|
3
ba
|
3,344
sqft
|
built
2020
5104 Tupelo Row, San Antonio, TX 78263
$-1,983
Cash flow
-21.1%
Cash-on-Cash Return
0.8%
Cap rate
0.4%
Rent to Value Ratio

Active
$430,000
5
bds
|
4
ba
|
2,443
sqft
|
built
1999
607 Turtle Hl, San Antonio, TX 78260
$-1,062
Cash flow
-12.9%
Cash-on-Cash Return
2.7%
Cap rate
0.6%
Rent to Value Ratio
Active
$134,500
1
bds
|
1
ba
|
818
sqft
|
built
1982
11610 Vance Jackson Rd, San Antonio, TX 78230
$-355
Cash flow
-13.8%
Cash-on-Cash Return
2.5%
Cap rate
0.9%
Rent to Value Ratio

Active
$275,000
4
bds
|
2
ba
|
1,702
sqft
|
built
1993
4503 Stradford Pl, San Antonio, TX 78217
$-433
Cash flow
-8.2%
Cash-on-Cash Return
3.8%
Cap rate
0.7%
Rent to Value Ratio

Active
$224,000
3
bds
|
3
ba
|
1,553
sqft
|
built
2007
5714 Fossil Cyn, San Antonio, TX 78252
$-342
Cash flow
-8.0%
Cash-on-Cash Return
3.8%
Cap rate
0.7%
Rent to Value Ratio
Active
$385,000
3
bds
|
3
ba
|
1,638
sqft
|
built
2022
9019 Stillwater Pass, San Antonio, TX 78254
$-678
Cash flow
-9.2%
Cash-on-Cash Return
3.6%
Cap rate
0.6%
Rent to Value Ratio

Active
$249,500
4
bds
|
2
ba
|
1,668
sqft
|
built
2022
5926 Seaside Mnr, Converse, TX 78109
$-505
Cash flow
-10.6%
Cash-on-Cash Return
3.3%
Cap rate
0.7%
Rent to Value Ratio

Active
$519,900
4
bds
|
3
ba
|
2,505
sqft
|
built
2022
2710 Sueno Pt, San Antonio, TX 78245
$-1,417
Cash flow
-14.2%
Cash-on-Cash Return
2.4%
Cap rate
0.6%
Rent to Value Ratio
Active
$214,000
3
bds
|
2
ba
|
1,276
sqft
|
built
2023
4117 Cataract Cir, San Antonio, TX 78223
$-249
Cash flow
-6.1%
Cash-on-Cash Return
4.3%
Cap rate
0.7%
Rent to Value Ratio
Active
$340,000
4
bds
|
3
ba
|
2,358
sqft
|
built
2018
8547 Laxey Wheel, San Antonio, TX 78254
$-609
Cash flow
-9.3%
Cash-on-Cash Return
3.5%
Cap rate
0.7%
Rent to Value Ratio

Active
$139,975
2
bds
|
1
ba
|
852
sqft
|
built
1941
426 Royston Ave, San Antonio, TX 78225
$34
Cash flow
1.3%
Cash-on-Cash Return
6.0%
Cap rate
1.0%
Rent to Value Ratio

Active
$350,000
3
bds
|
3
ba
|
1,258
sqft
|
built
1910
521 N Palmetto, San Antonio, TX 78202
$-945
Cash flow
-14.1%
Cash-on-Cash Return
2.4%
Cap rate
0.6%
Rent to Value Ratio