Bexar County Investment Properties for Sale
Browse homes for sale and investment properties in Bexar County. Refine your search by price, property type, or more.
Best cash flowing properties in Bexar County
Active
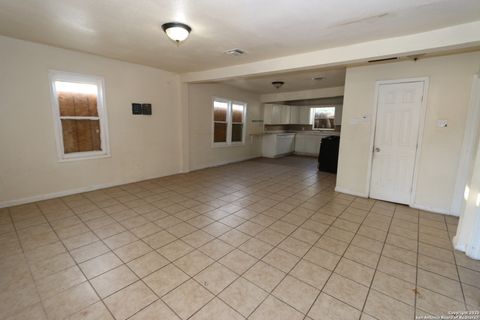
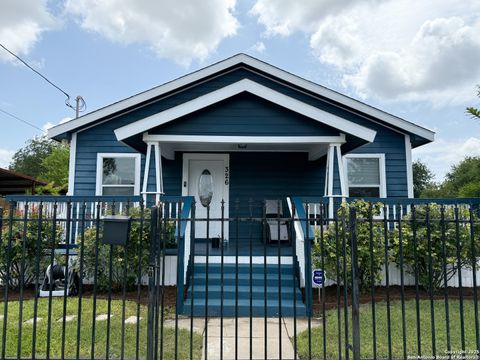
$85,000
2
bds
|
1
ba
|
960
sqft
|
built
1950
503 Ferris Ave, San Antonio, TX 78220
$100
Cash flow
6.1%
Cash-on-Cash Return
7.1%
Cap rate
1.3%
Rent to Value Ratio
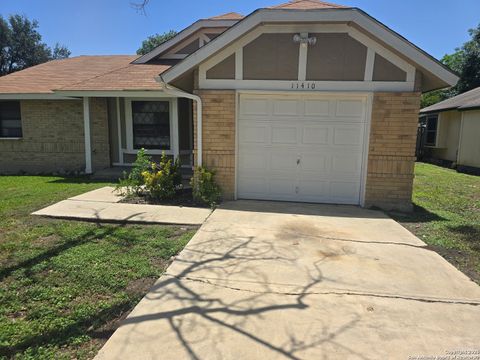
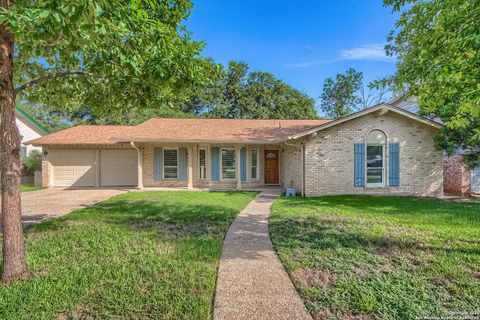
Active
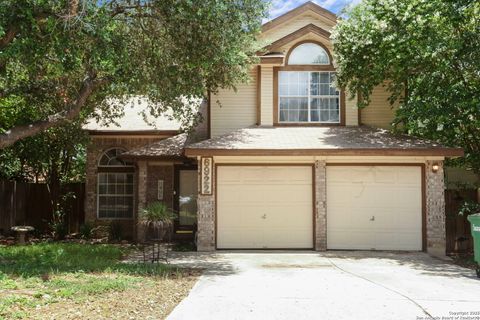
$179,900
3
bds
|
1
ba
|
1,375
sqft
|
built
1984
11410 Hatchet Pass Dr, San Antonio, TX 78245
$-94
Cash flow
-2.7%
Cash-on-Cash Return
5.0%
Cap rate
0.9%
Rent to Value Ratio
4,322 out of 4,729 properties for sale in Bexar County
Limited Results Shown
Create a free account, or log in to reveal all property listings and enjoy the complete experience.

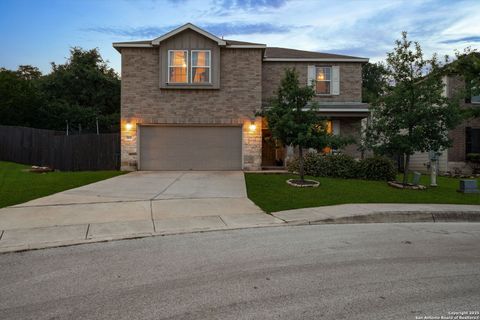
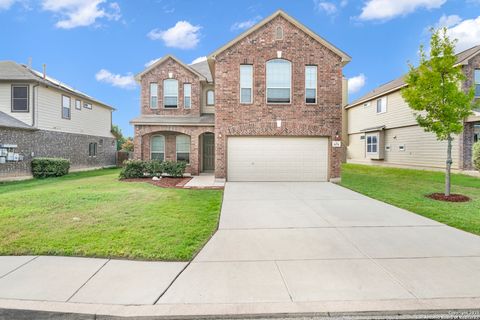
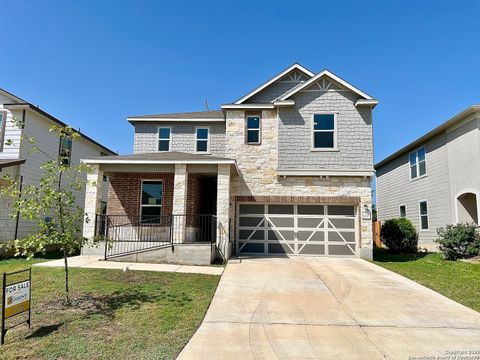
Active
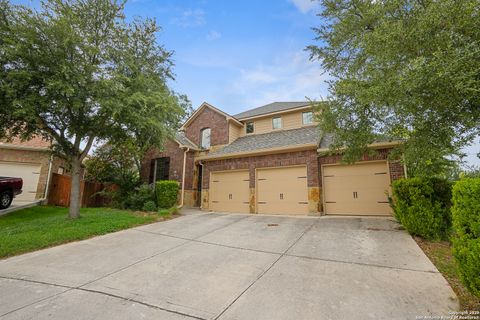
$292,000
3
bds
|
2
ba
|
1,876
sqft
|
built
2005
202 Willow Grove Dr, San Antonio, TX 78245
$-717
Cash flow
-12.8%
Cash-on-Cash Return
2.7%
Cap rate
0.6%
Rent to Value Ratio

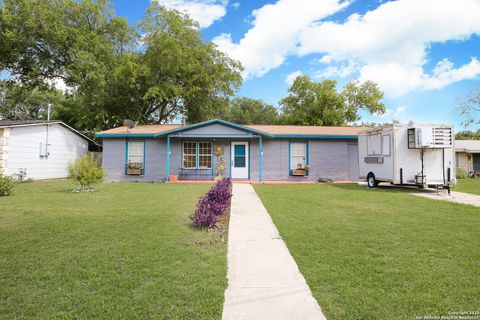
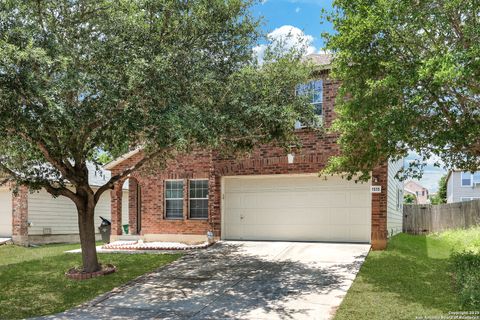
Active
$519,900
3
bds
|
2
ba
|
2,579
sqft
|
built
2002
306 Legend Breeze, San Antonio, TX 78260
$-1,475
Cash flow
-14.8%
Cash-on-Cash Return
2.3%
Cap rate
0.6%
Rent to Value Ratio
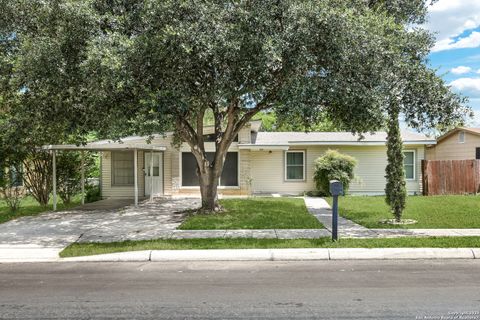
Active
$365,000
5
bds
|
4
ba
|
2,388
sqft
|
built
2015
701 Trinity Star, San Antonio, TX 78260
$-603
Cash flow
-8.6%
Cash-on-Cash Return
3.7%
Cap rate
0.7%
Rent to Value Ratio

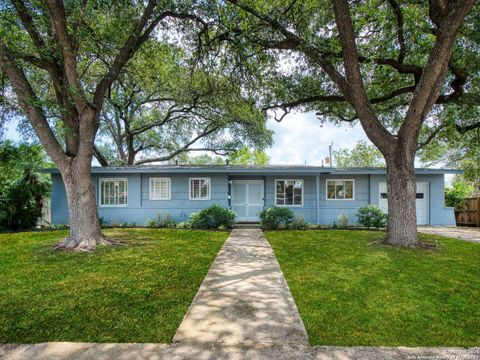
Active
$254,000
3
bds
|
3
ba
|
1,527
sqft
|
built
1973
1770 Thousand Oaks Dr, San Antonio, TX 78232
$-565
Cash flow
-11.6%
Cash-on-Cash Return
3.0%
Cap rate
0.7%
Rent to Value Ratio

Active
$630,000
3
bds
|
3
ba
|
1,692
sqft
|
built
1928
327 Barrera St, San Antonio, TX 78210
$-1,668
Cash flow
-13.8%
Cash-on-Cash Return
2.5%
Cap rate
0.5%
Rent to Value Ratio
Active
$248,000
5
bds
|
2
ba
|
1,738
sqft
|
built
1964
246 Flintstone Ln, Universal City, TX 78148
$-421
Cash flow
-8.9%
Cash-on-Cash Return
3.6%
Cap rate
0.7%
Rent to Value Ratio
Active
$299,500
3
bds
|
2
ba
|
1,859
sqft
|
built
2019
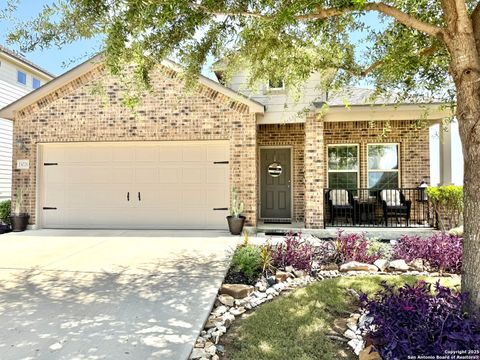
13026 Bunkhouse, San Antonio, TX 78245
$-459
Cash flow
-8.0%
Cash-on-Cash Return
3.8%
Cap rate
0.7%
Rent to Value Ratio

Active
$200,000
3
bds
|
2
ba
|
1,226
sqft
|
built
2018
6538 Marcum Dr, San Antonio, TX 78227
$-258
Cash flow
-6.7%
Cash-on-Cash Return
4.1%
Cap rate
0.8%
Rent to Value Ratio
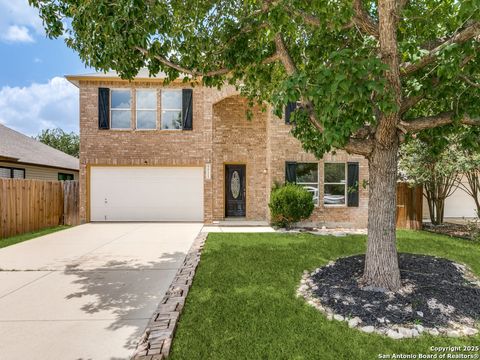
Active
$239,900
3
bds
|
3
ba
|
1,673
sqft
|
built
1998
9878 Lauren Mist, San Antonio, TX 78251
$-544
Cash flow
-11.8%
Cash-on-Cash Return
3.0%
Cap rate
0.7%
Rent to Value Ratio
Active
$405,000
4
bds
|
3
ba
|
2,473
sqft
|
built
2001
1319 Arrow Bow, San Antonio, TX 78258
$-1,019
Cash flow
-13.1%
Cash-on-Cash Return
2.7%
Cap rate
0.6%
Rent to Value Ratio

Active
$375,000
4
bds
|
3
ba
|
2,331
sqft
|
built
1994
4110 Buffalo Bayou Rd, San Antonio, TX 78251
$-1,113
Cash flow
-15.5%
Cash-on-Cash Return
2.1%
Cap rate
0.5%
Rent to Value Ratio
Active
$230,000
4
bds
|
3
ba
|
2,305
sqft
|
built
1975
5207 Starfire St, Kirby, TX 78219
$-608
Cash flow
-13.8%
Cash-on-Cash Return
2.5%
Cap rate
0.7%
Rent to Value Ratio

Active
$285,000
3
bds
|
3
ba
|
2,311
sqft
|
built
2006
10707 Axis Xing, San Antonio, TX 78245
$-466
Cash flow
-8.5%
Cash-on-Cash Return
3.7%
Cap rate
0.7%
Rent to Value Ratio
Active
$424,700
4
bds
|
2
ba
|
2,003
sqft
|
built
1967
11627 Temptation St, San Antonio, TX 78216
$-1,143
Cash flow
-14.0%
Cash-on-Cash Return
2.4%
Cap rate
0.5%
Rent to Value Ratio

Active
$290,000
4
bds
|
3
ba
|
2,542
sqft
|
built
2015
8255 Puente, San Antonio, TX 78223
$-402
Cash flow
-7.2%
Cash-on-Cash Return
4.0%
Cap rate
0.8%
Rent to Value Ratio
Active
$368,000
4
bds
|
3
ba
|
2,490
sqft
|
built
2014
8470 Buckhorn Parke, San Antonio, TX 78254
$-548
Cash flow
-7.8%
Cash-on-Cash Return
3.9%
Cap rate
0.7%
Rent to Value Ratio

Active
$344,900
4
bds
|
3
ba
|
2,314
sqft
|
built
1996
7 Lockspring, San Antonio, TX 78254
$-814
Cash flow
-12.3%
Cash-on-Cash Return
2.8%
Cap rate
0.6%
Rent to Value Ratio

Active
$585,000
3
bds
|
2
ba
|
1,712
sqft
|
built
1954
303 Ridgehaven Pl, San Antonio, TX 78209
$-1,904
Cash flow
-17.0%
Cash-on-Cash Return
1.8%
Cap rate
0.4%
Rent to Value Ratio

Active
$440,000
4
bds
|
3
ba
|
2,881
sqft
|
built
2003
9243 Mc Cafferty Dr, Helotes, TX 78023
$-1,149
Cash flow
-13.6%
Cash-on-Cash Return
2.5%
Cap rate
0.6%
Rent to Value Ratio
Active
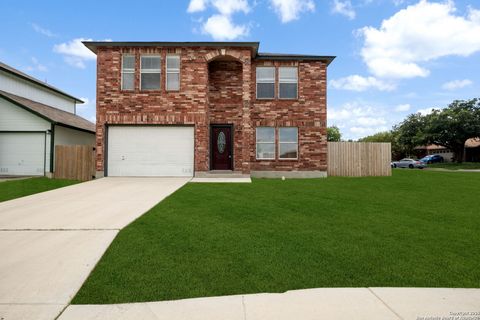
$365,000
4
bds
|
2
ba
|
2,500
sqft
|
built
2006
1515 Agency Pt, San Antonio, TX 78245
$-921
Cash flow
-13.2%
Cash-on-Cash Return
2.6%
Cap rate
0.5%
Rent to Value Ratio
Active
$188,500
3
bds
|
1
ba
|
1,288
sqft
|
built
1957
551 Lanark Dr, San Antonio, TX 78218
$-179
Cash flow
-5.0%
Cash-on-Cash Return
4.5%
Cap rate
0.8%
Rent to Value Ratio

Active
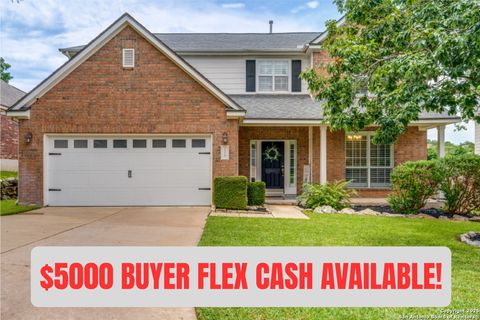
$369,000
3
bds
|
3
ba
|
2,385
sqft
|
built
2012
23802 Stately Oaks, San Antonio, TX 78260
$-844
Cash flow
-11.9%
Cash-on-Cash Return
2.9%
Cap rate
0.7%
Rent to Value Ratio
Active
$359,999
3
bds
|
2
ba
|
1,710
sqft
|
built
1940
326 Connelly St, San Antonio, TX 78203
$-842
Cash flow
-12.2%
Cash-on-Cash Return
2.9%
Cap rate
0.6%
Rent to Value Ratio
Active
$454,900
5
bds
|
3
ba
|
3,679
sqft
|
built
2010
15302 Round Pond Pl, San Antonio, TX 78245
$-933
Cash flow
-10.7%
Cash-on-Cash Return
3.2%
Cap rate
0.6%
Rent to Value Ratio
Active
$239,000
3
bds
|
3
ba
|
1,395
sqft
|
built
1994
6922 Quail Pne, San Antonio, TX 78250
$-478
Cash flow
-10.4%
Cash-on-Cash Return
3.3%
Cap rate
0.7%
Rent to Value Ratio

Active
$497,000
4
bds
|
3
ba
|
2,526
sqft
|
built
2022
3902 Gervasi, San Antonio, TX 78261
$-1,592
Cash flow
-16.7%
Cash-on-Cash Return
1.8%
Cap rate
0.6%
Rent to Value Ratio

Active
$285,000
4
bds
|
3
ba
|
1,839
sqft
|
built
2022
15302 Smoky Honeyeater, San Antonio, TX 78253
$-820
Cash flow
-15.0%
Cash-on-Cash Return
2.2%
Cap rate
0.6%
Rent to Value Ratio

Active
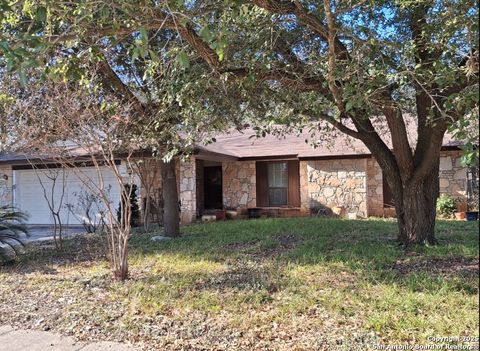
$205,000
4
bds
|
3
ba
|
1,804
sqft
|
built
1973
4903 Arbor Ridge Dr, San Antonio, TX 78228
$-492
Cash flow
-12.5%
Cash-on-Cash Return
2.8%
Cap rate
0.8%
Rent to Value Ratio
Active
$369,900
4
bds
|
2
ba
|
2,247
sqft
|
built
2016
8614 Pardner Rnch, San Antonio, TX 78254
$-806
Cash flow
-11.4%
Cash-on-Cash Return
3.1%
Cap rate
0.6%
Rent to Value Ratio
Active
$329,000
4
bds
|
3
ba
|
2,381
sqft
|
built
2021
5630 Tranquil Dawn, San Antonio, TX 78218
$-648
Cash flow
-10.3%
Cash-on-Cash Return
3.3%
Cap rate
0.7%
Rent to Value Ratio
Active
$299,000
3
bds
|
2
ba
|
1,602
sqft
|
built
1955
366 Springwood Ln, San Antonio, TX 78216
$-552
Cash flow
-9.6%
Cash-on-Cash Return
3.5%
Cap rate
0.7%
Rent to Value Ratio

Active
$625,000
4
bds
|
3
ba
|
2,610
sqft
|
built
2021
11323 Cottage Grv, San Antonio, TX 78230
$-1,960
Cash flow
-16.4%
Cash-on-Cash Return
1.9%
Cap rate
0.5%
Rent to Value Ratio
Active
$329,000
3
bds
|
3
ba
|
2,575
sqft
|
built
1999
9511 Marshall Pt, San Antonio, TX 78240
$-702
Cash flow
-11.1%
Cash-on-Cash Return
3.1%
Cap rate
0.7%
Rent to Value Ratio

Active
$264,900
4
bds
|
0
ba
|
1,592
sqft
|
built
1982
8842 Meadow Trace St, San Antonio, TX 78250
$-777
Cash flow
-15.3%
Cash-on-Cash Return
2.2%
Cap rate
0.5%
Rent to Value Ratio

Active
$405,000
4
bds
|
3
ba
|
2,149
sqft
|
built
2018
22630 Carriage Blf, San Antonio, TX 78261
$-1,073
Cash flow
-13.8%
Cash-on-Cash Return
2.5%
Cap rate
0.5%
Rent to Value Ratio
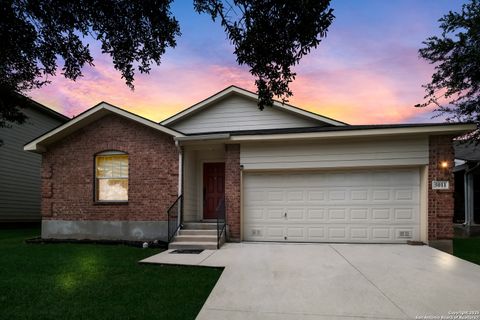
Active
$210,000
3
bds
|
2
ba
|
1,398
sqft
|
built
2006
5011 Fountain Hl, San Antonio, TX 78244
$-330
Cash flow
-8.2%
Cash-on-Cash Return
3.8%
Cap rate
0.8%
Rent to Value Ratio
Active
$225,000
3
bds
|
2
ba
|
1,493
sqft
|
built
1983
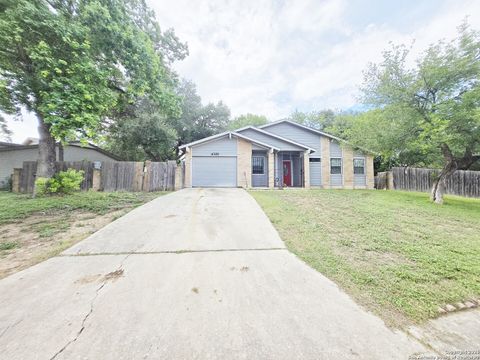
4319 Golden Spice Dr, San Antonio, TX 78222
$-362
Cash flow
-8.4%
Cash-on-Cash Return
3.7%
Cap rate
0.7%
Rent to Value Ratio
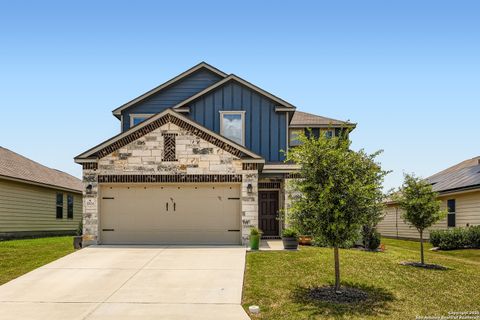
Active
$355,000
4
bds
|
4
ba
|
2,657
sqft
|
built
2020
10634 Penelope Way, Converse, TX 78109
$-745
Cash flow
-10.9%
Cash-on-Cash Return
3.2%
Cap rate
0.6%
Rent to Value Ratio