Fort Bend County Investment Properties for Sale
Browse homes for sale and investment properties in Fort Bend County. Refine your search by price, property type, or more.
Best cash flowing properties in Fort Bend County

Active
$289,900
3
bds
|
0
ba
|
1,631
sqft
|
built
2023
7003 Tehama Ln, Rosharon, TX 77583
$-41
Cash flow
-0.7%
Cash-on-Cash Return
6.1%
Cap rate
0.8%
Rent to Value Ratio

Active
$220,000
4
bds
|
0
ba
|
1,292
sqft
|
built
1958
915 Avenue E, Rosenberg, TX 77471
$-168
Cash flow
-4.0%
Cash-on-Cash Return
5.4%
Cap rate
0.7%
Rent to Value Ratio
2,641 out of 3,247 properties for sale in Fort Bend County
Limited Results Shown
Create a free account, or log in to reveal all property listings and enjoy the complete experience.
Active
$395,000
4
bds
|
0
ba
|
2,845
sqft
|
built
2023
2231 Bright Sunrise Trl, Fresno, TX 77545
$-173
Cash flow
-2.3%
Cash-on-Cash Return
5.7%
Cap rate
0.7%
Rent to Value Ratio
Active
$415,000
4
bds
|
0
ba
|
2,630
sqft
|
built
2022
4951 Gazelle Leap Ln, Richmond, TX 77406
$-1,110
Cash flow
-14.0%
Cash-on-Cash Return
3.1%
Cap rate
0.7%
Rent to Value Ratio

Active
$549,000
4
bds
|
0
ba
|
3,390
sqft
|
built
2023
10638 Kingston Spring Dr, Missouri City, TX 77459
$-865
Cash flow
-8.2%
Cash-on-Cash Return
4.4%
Cap rate
0.7%
Rent to Value Ratio

Active
$600,000
4
bds
|
0
ba
|
3,504
sqft
|
built
2022
5015 Albany Shores Ln, Fulshear, TX 77441
$-2,069
Cash flow
-18.0%
Cash-on-Cash Return
2.1%
Cap rate
0.7%
Rent to Value Ratio
Active
$510,000
4
bds
|
0
ba
|
2,575
sqft
|
built
2022
23719 Sweeny Valley Dr, Richmond, TX 77469
$-1,642
Cash flow
-16.8%
Cash-on-Cash Return
2.4%
Cap rate
0.6%
Rent to Value Ratio

Active
$349,999
2
bds
|
0
ba
|
1,451
sqft
|
built
2022
27946 Western Creek Ct, Katy, TX 77494
$-1,129
Cash flow
-16.8%
Cash-on-Cash Return
2.4%
Cap rate
0.6%
Rent to Value Ratio
Active
$835,000
4
bds
|
0
ba
|
3,554
sqft
|
built
2022
5722 Logan Ridge Ln, Fulshear, TX 77441
$-2,940
Cash flow
-18.4%
Cash-on-Cash Return
2.0%
Cap rate
0.6%
Rent to Value Ratio

Active
$450,000
3
bds
|
0
ba
|
1,538
sqft
|
built
2023
9714 Perdita Trl, Missouri City, TX 77459
$-743
Cash flow
-8.6%
Cash-on-Cash Return
4.3%
Cap rate
0.6%
Rent to Value Ratio

Active
$415,000
4
bds
|
0
ba
|
2,638
sqft
|
built
2023
1035 Park Crest Dr, Missouri City, TX 77459
$-1,071
Cash flow
-13.5%
Cash-on-Cash Return
3.2%
Cap rate
0.7%
Rent to Value Ratio
Active
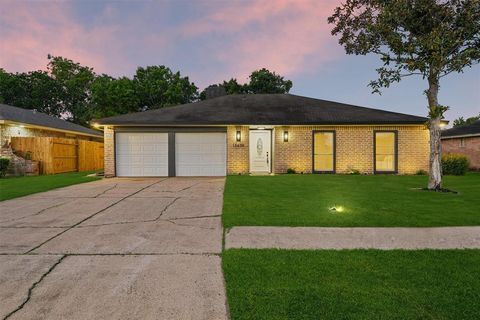
$289,900
3
bds
|
0
ba
|
1,631
sqft
|
built
2023
7003 Tehama Ln, Rosharon, TX 77583
$-41
Cash flow
-0.7%
Cash-on-Cash Return
6.1%
Cap rate
0.8%
Rent to Value Ratio
Active
$519,900
4
bds
|
0
ba
|
3,200
sqft
|
built
2000
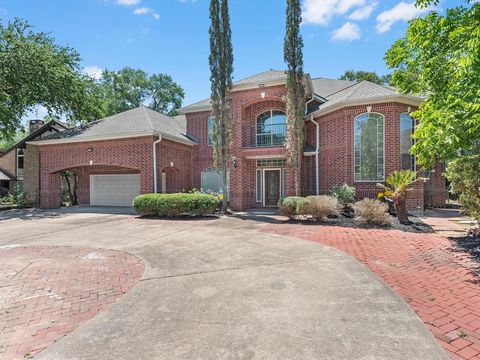
2914 Renoir, Sugar Land, TX 77479
$-1,292
Cash flow
-13.0%
Cash-on-Cash Return
3.3%
Cap rate
0.6%
Rent to Value Ratio

Active
$1,749,000
4
bds
|
0
ba
|
6,024
sqft
|
built
2004
3320 Wild River Dr, Richmond, TX 77406
$-5,625
Cash flow
-16.8%
Cash-on-Cash Return
2.4%
Cap rate
0.5%
Rent to Value Ratio

Active
$278,800
1
bds
|
0
ba
|
835
sqft
|
built
2004
2299 Lone Star Dr, Sugar Land, TX 77479
$-1,007
Cash flow
-18.8%
Cash-on-Cash Return
1.9%
Cap rate
0.7%
Rent to Value Ratio

Active
$669,000
5
bds
|
0
ba
|
4,179
sqft
|
built
2012
90 Wyndehaven Lakes Dr, Katy, TX 77494
$-789
Cash flow
-6.2%
Cash-on-Cash Return
4.9%
Cap rate
0.6%
Rent to Value Ratio
Active
$340,000
4
bds
|
0
ba
|
2,138
sqft
|
built
2021
1714 Avocet Way, Missouri City, TX 77489
$-647
Cash flow
-9.9%
Cash-on-Cash Return
4.0%
Cap rate
0.8%
Rent to Value Ratio
Active
$750,000
5
bds
|
0
ba
|
4,266
sqft
|
built
2014
17414 Waeback Dr, Richmond, TX 77407
$-1,191
Cash flow
-8.3%
Cash-on-Cash Return
4.4%
Cap rate
0.5%
Rent to Value Ratio

Active
$344,900
3
bds
|
0
ba
|
2,088
sqft
|
built
2006
2619 Winners Ct, Rosenberg, TX 77471
$-942
Cash flow
-14.2%
Cash-on-Cash Return
3.0%
Cap rate
0.6%
Rent to Value Ratio

Active
$500,000
5
bds
|
0
ba
|
3,249
sqft
|
built
1996
23207 Greenrush Dr, Katy, TX 77494
$-1,297
Cash flow
-13.5%
Cash-on-Cash Return
3.2%
Cap rate
0.6%
Rent to Value Ratio
Active
$394,000
4
bds
|
0
ba
|
2,325
sqft
|
built
1997
2906 Huckleberry St, Missouri City, TX 77459
$-406
Cash flow
-5.4%
Cash-on-Cash Return
5.0%
Cap rate
0.6%
Rent to Value Ratio
Active
$273,890
4
bds
|
0
ba
|
1,428
sqft
|
built
1971
15439 Indian Woods Dr, Missouri City, TX 77489
$-446
Cash flow
-8.5%
Cash-on-Cash Return
4.3%
Cap rate
0.7%
Rent to Value Ratio

Active
$939,000
4
bds
|
0
ba
|
4,259
sqft
|
built
1993
3807 Snead Ct, Sugar Land, TX 77479
$-3,539
Cash flow
-19.7%
Cash-on-Cash Return
1.7%
Cap rate
0.4%
Rent to Value Ratio
Active
$480,000
4
bds
|
0
ba
|
2,489
sqft
|
built
1997
1606 Parkview Ln, Missouri City, TX 77459
$-1,056
Cash flow
-11.5%
Cash-on-Cash Return
3.6%
Cap rate
0.7%
Rent to Value Ratio
Active
$349,900
3
bds
|
0
ba
|
1,960
sqft
|
built
1999
2311 Foster Leaf Ct, Richmond, TX 77406
$-880
Cash flow
-13.1%
Cash-on-Cash Return
3.2%
Cap rate
0.6%
Rent to Value Ratio
Active
$299,000
3
bds
|
0
ba
|
2,168
sqft
|
built
1984
2526 Windswept Dr, Richmond, TX 77406
$-513
Cash flow
-9.0%
Cash-on-Cash Return
4.2%
Cap rate
0.7%
Rent to Value Ratio

Active
$700,000
1
bds
|
0
ba
|
977
sqft
|
built
1998
3745 Clayhead Rd, Richmond, TX 77406
$-2,619
Cash flow
-19.5%
Cash-on-Cash Return
1.8%
Cap rate
0.3%
Rent to Value Ratio

Active
$250,000
1
bds
|
0
ba
|
1,118
sqft
|
built
1984
4144 Greystone Way, Sugar Land, TX 77479
$-639
Cash flow
-13.3%
Cash-on-Cash Return
3.2%
Cap rate
0.7%
Rent to Value Ratio

Active
$307,000
4
bds
|
0
ba
|
2,621
sqft
|
built
2007
2707 Long Grove Ln, Richmond, TX 77469
$-859
Cash flow
-14.6%
Cash-on-Cash Return
2.9%
Cap rate
0.7%
Rent to Value Ratio

Active
$500,000
5
bds
|
0
ba
|
3,227
sqft
|
built
1977
3606 E Creek Club Dr, Missouri City, TX 77459
$-1,394
Cash flow
-14.5%
Cash-on-Cash Return
2.9%
Cap rate
0.6%
Rent to Value Ratio
Active
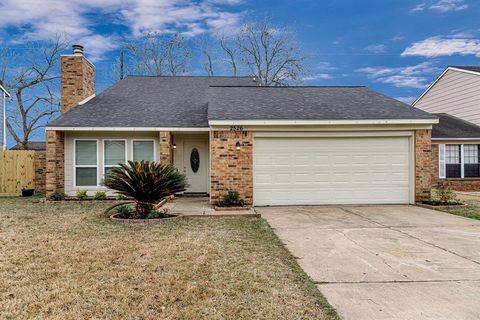
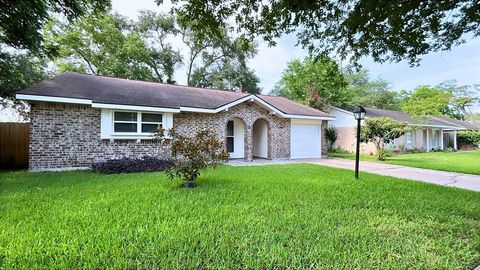
$220,000
4
bds
|
0
ba
|
1,292
sqft
|
built
1958
915 Avenue E, Rosenberg, TX 77471
$-168
Cash flow
-4.0%
Cash-on-Cash Return
5.4%
Cap rate
0.7%
Rent to Value Ratio
Active
$775,000
5
bds
|
0
ba
|
5,919
sqft
|
built
1998
3311 El Dorado Blvd, Missouri City, TX 77459
$-3,457
Cash flow
-23.3%
Cash-on-Cash Return
0.9%
Cap rate
0.5%
Rent to Value Ratio

Active
$375,000
4
bds
|
0
ba
|
2,544
sqft
|
built
1973
3142 La Quinta Dr, Missouri City, TX 77459
$-883
Cash flow
-12.3%
Cash-on-Cash Return
3.4%
Cap rate
0.7%
Rent to Value Ratio
Active
$285,000
3
bds
|
0
ba
|
1,414
sqft
|
built
1970
13419 Greenway Dr, Sugar Land, TX 77498
$-615
Cash flow
-11.3%
Cash-on-Cash Return
3.7%
Cap rate
0.6%
Rent to Value Ratio

Active
$450,000
3
bds
|
0
ba
|
2,822
sqft
|
built
2007
4319 Stonebrook Ln, Missouri City, TX 77459
$-1,397
Cash flow
-16.2%
Cash-on-Cash Return
2.5%
Cap rate
0.6%
Rent to Value Ratio
Active
$780,000
5
bds
|
0
ba
|
3,961
sqft
|
built
2006
1811 Cambria Ln, Sugar Land, TX 77479
$-2,948
Cash flow
-19.7%
Cash-on-Cash Return
1.7%
Cap rate
0.5%
Rent to Value Ratio
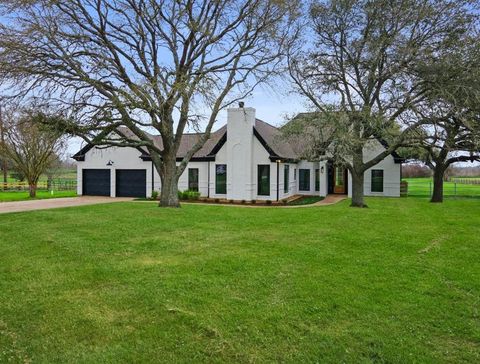
Active
$950,000
3
bds
|
0
ba
|
2,709
sqft
|
built
1995
32826 Rogers Rd, Fulshear, TX 77441
$-1,313
Cash flow
-7.2%
Cash-on-Cash Return
4.6%
Cap rate
0.7%
Rent to Value Ratio

Active
$1,680,000
4
bds
|
0
ba
|
5,661
sqft
|
built
2002
22 Berenger Pl, Sugar Land, TX 77479
$-6,015
Cash flow
-18.7%
Cash-on-Cash Return
2.0%
Cap rate
0.4%
Rent to Value Ratio
Active
$1,100,000
5
bds
|
0
ba
|
5,000
sqft
|
built
2022
323 E Palm St, Fresno, TX 77545
$-2,638
Cash flow
-12.5%
Cash-on-Cash Return
3.4%
Cap rate
0.4%
Rent to Value Ratio
Active
$380,000
3
bds
|
0
ba
|
3,032
sqft
|
built
1993
2210 Geronimo Ln, Rosenberg, TX 77471
$-1,054
Cash flow
-14.5%
Cash-on-Cash Return
2.9%
Cap rate
0.6%
Rent to Value Ratio
Active
$610,000
4
bds
|
0
ba
|
2,909
sqft
|
built
1995
7103 Adobe Meadows Ct, Sugar Land, TX 77479
$-718
Cash flow
-6.1%
Cash-on-Cash Return
4.9%
Cap rate
0.8%
Rent to Value Ratio
Active
$589,900
3
bds
|
0
ba
|
1,924
sqft
|
built
1992
13302 Kettler Rd, Needville, TX 77461
$-2,182
Cash flow
-19.3%
Cash-on-Cash Return
1.8%
Cap rate
0.4%
Rent to Value Ratio