Fort Bend County Investment Properties for Sale
Browse homes for sale and investment properties in Fort Bend County. Refine your search by price, property type, or more.
Best cash flowing properties in Fort Bend County

Active
$160,000
3
bds
|
0
ba
|
1,488
sqft
|
built
1986
827 Coen Rd, Rosharon, TX 77583
$66
Cash flow
2.2%
Cash-on-Cash Return
6.8%
Cap rate
1.0%
Rent to Value Ratio

Active
$199,000
2
bds
|
0
ba
|
896
sqft
|
built
1945
1602 Elizabeth Ave, Rosenberg, TX 77471
$-233
Cash flow
-6.1%
Cash-on-Cash Return
4.9%
Cap rate
0.7%
Rent to Value Ratio
2,641 out of 3,247 properties for sale in Fort Bend County
Limited Results Shown
Create a free account, or log in to reveal all property listings and enjoy the complete experience.
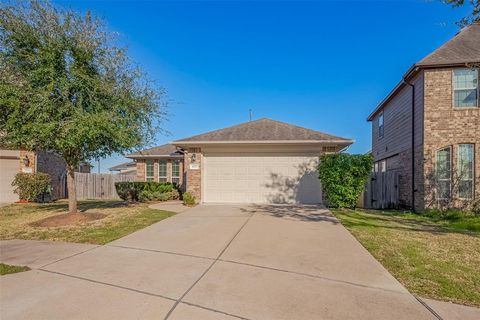
Active
$415,000
4
bds
|
0
ba
|
2,586
sqft
|
built
2005
7507 Trail Holw, Missouri City, TX 77459
$-1,280
Cash flow
-16.1%
Cash-on-Cash Return
2.6%
Cap rate
0.6%
Rent to Value Ratio
Active
$199,000
2
bds
|
0
ba
|
896
sqft
|
built
1945
1602 Elizabeth Ave, Rosenberg, TX 77471
$-233
Cash flow
-6.1%
Cash-on-Cash Return
4.9%
Cap rate
0.7%
Rent to Value Ratio

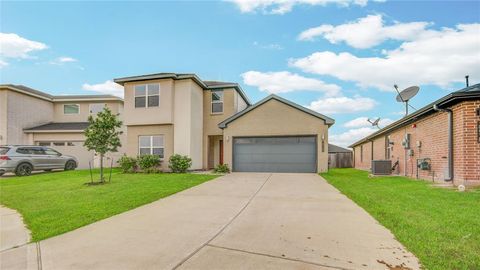
Active
$380,000
3
bds
|
0
ba
|
2,889
sqft
|
built
2006
342 Silver Creek Cir, Richmond, TX 77406
$-836
Cash flow
-11.5%
Cash-on-Cash Return
3.6%
Cap rate
0.7%
Rent to Value Ratio

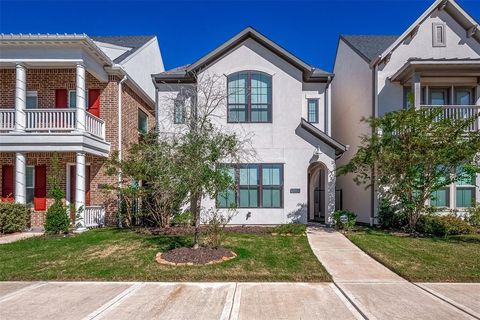
Active
$285,000
4
bds
|
0
ba
|
2,269
sqft
|
built
1977
3102 Blue Hills Dr, Missouri City, TX 77459
$-504
Cash flow
-9.2%
Cash-on-Cash Return
4.1%
Cap rate
0.8%
Rent to Value Ratio
Active
$440,000
4
bds
|
0
ba
|
2,947
sqft
|
built
2007
13703 Evening Wind Dr, Pearland, TX 77584
$-1,254
Cash flow
-14.9%
Cash-on-Cash Return
2.8%
Cap rate
0.6%
Rent to Value Ratio

Active
$515,000
4
bds
|
0
ba
|
3,783
sqft
|
built
2008
2107 Pearl Bay Ct, Pearland, TX 77584
$-1,242
Cash flow
-12.6%
Cash-on-Cash Return
3.4%
Cap rate
0.7%
Rent to Value Ratio
Active
$660,000
4
bds
|
0
ba
|
3,510
sqft
|
built
2022
1511 Forest Brk, Sugar Land, TX 77479
$-2,587
Cash flow
-20.5%
Cash-on-Cash Return
1.6%
Cap rate
0.5%
Rent to Value Ratio
Active
$1,200,000
5
bds
|
0
ba
|
5,793
sqft
|
built
2004
2710 Fort Caney Dr, Richmond, TX 77406
$-2,746
Cash flow
-11.9%
Cash-on-Cash Return
3.5%
Cap rate
0.6%
Rent to Value Ratio

Active
$375,000
3
bds
|
0
ba
|
1,940
sqft
|
built
2007
7922 Linden Oaks Ln, Richmond, TX 77407
$-1,099
Cash flow
-15.3%
Cash-on-Cash Return
2.7%
Cap rate
0.6%
Rent to Value Ratio
Active
$620,000
5
bds
|
0
ba
|
4,226
sqft
|
built
2010
26223 Rustic Ranch Ln, Katy, TX 77494
$-1,836
Cash flow
-15.5%
Cash-on-Cash Return
2.7%
Cap rate
0.6%
Rent to Value Ratio
Active
$350,000
3
bds
|
0
ba
|
1,747
sqft
|
built
2020
11607 Brookside Arbor Ln, Richmond, TX 77406
$-1,054
Cash flow
-15.7%
Cash-on-Cash Return
2.7%
Cap rate
0.7%
Rent to Value Ratio

Active
$315,000
3
bds
|
0
ba
|
2,044
sqft
|
built
2017
5906 Yaupon Ridge Dr, Rosenberg, TX 77469
$-867
Cash flow
-14.4%
Cash-on-Cash Return
3.0%
Cap rate
0.7%
Rent to Value Ratio

Active
$290,890
3
bds
|
0
ba
|
1,446
sqft
|
built
1963
526 Guyer St, Sugar Land, TX 77498
$-640
Cash flow
-11.5%
Cash-on-Cash Return
3.6%
Cap rate
0.6%
Rent to Value Ratio

Active
$359,650
3
bds
|
0
ba
|
2,295
sqft
|
built
2020
5819 Southern Rose Ln, Rosenberg, TX 77469
$-857
Cash flow
-12.4%
Cash-on-Cash Return
3.4%
Cap rate
0.7%
Rent to Value Ratio

Active
$729,900
4
bds
|
0
ba
|
3,636
sqft
|
built
2018
4423 Sterling Heights Ln, Sugar Land, TX 77479
$-1,782
Cash flow
-12.7%
Cash-on-Cash Return
3.3%
Cap rate
0.6%
Rent to Value Ratio

Active
$437,900
4
bds
|
0
ba
|
2,570
sqft
|
built
2018
2318 Anzio Ct, Missouri City, TX 77459
$-1,104
Cash flow
-13.2%
Cash-on-Cash Return
3.2%
Cap rate
0.7%
Rent to Value Ratio
Active
$306,000
3
bds
|
0
ba
|
1,652
sqft
|
built
2018
25319 Western Sage Ln, Richmond, TX 77406
$-681
Cash flow
-11.6%
Cash-on-Cash Return
3.6%
Cap rate
0.7%
Rent to Value Ratio
Active
$378,000
4
bds
|
0
ba
|
2,287
sqft
|
built
2018
8310 Remington Bluff Ln, Richmond, TX 77407
$-1,214
Cash flow
-16.8%
Cash-on-Cash Return
2.4%
Cap rate
0.6%
Rent to Value Ratio
Active
$389,000
4
bds
|
0
ba
|
2,451
sqft
|
built
1998
7402 Broken Oak Ln, Sugar Land, TX 77479
$-902
Cash flow
-12.1%
Cash-on-Cash Return
3.5%
Cap rate
0.7%
Rent to Value Ratio
Active
$340,000
3
bds
|
0
ba
|
1,738
sqft
|
built
2015
18707 Majestic Vista Ln, Richmond, TX 77407
$-753
Cash flow
-11.6%
Cash-on-Cash Return
3.6%
Cap rate
0.7%
Rent to Value Ratio

Active
$619,000
4
bds
|
0
ba
|
3,106
sqft
|
built
1996
23210 Greenrush Dr, Katy, TX 77494
$-1,677
Cash flow
-14.1%
Cash-on-Cash Return
3.0%
Cap rate
0.6%
Rent to Value Ratio

Active
$469,000
4
bds
|
0
ba
|
2,538
sqft
|
built
2015
29006 Dryander Forest Ct, Katy, TX 77494
$-414
Cash flow
-4.6%
Cash-on-Cash Return
5.2%
Cap rate
0.7%
Rent to Value Ratio
Active
$349,000
4
bds
|
0
ba
|
2,197
sqft
|
built
2021
29542 Bryans Mnr, Katy, TX 77494
$-810
Cash flow
-12.1%
Cash-on-Cash Return
3.5%
Cap rate
0.8%
Rent to Value Ratio
Active
$475,000
3
bds
|
0
ba
|
2,549
sqft
|
built
2021
5038 Galahad Ct, Missouri City, TX 77459
$-1,111
Cash flow
-12.2%
Cash-on-Cash Return
3.5%
Cap rate
0.7%
Rent to Value Ratio

Active
$519,000
5
bds
|
0
ba
|
3,190
sqft
|
built
2022
842 Dahlia Petal Dr, Missouri City, TX 77459
$-1,682
Cash flow
-16.9%
Cash-on-Cash Return
2.4%
Cap rate
0.6%
Rent to Value Ratio

Active
$815,000
5
bds
|
0
ba
|
4,253
sqft
|
built
2021
4411 Windy Oaks Dr, Fulshear, TX 77441
$-2,557
Cash flow
-16.4%
Cash-on-Cash Return
2.5%
Cap rate
0.7%
Rent to Value Ratio

Active
$350,000
3
bds
|
0
ba
|
2,274
sqft
|
built
1997
915 Featherbrook Ct, Sugar Land, TX 77479
$-1,042
Cash flow
-15.5%
Cash-on-Cash Return
2.7%
Cap rate
0.6%
Rent to Value Ratio
Active
$565,000
4
bds
|
0
ba
|
3,304
sqft
|
built
2014
4511 Hickory Branch Ln, Sugar Land, TX 77479
$-1,587
Cash flow
-14.7%
Cash-on-Cash Return
2.9%
Cap rate
0.6%
Rent to Value Ratio
Active
$1,900,000
5
bds
|
0
ba
|
6,521
sqft
|
built
2016
2803 Chester Knoll Ct, Katy, TX 77494
$-8,556
Cash flow
-23.5%
Cash-on-Cash Return
0.9%
Cap rate
0.3%
Rent to Value Ratio
Active
$474,786
3
bds
|
0
ba
|
2,544
sqft
|
built
2017
918 Marigold Park Pl, Richmond, TX 77406
$-1,909
Cash flow
-21.0%
Cash-on-Cash Return
1.4%
Cap rate
0.6%
Rent to Value Ratio
Active
$389,000
3
bds
|
0
ba
|
2,400
sqft
|
built
2016
7923 Cheyenne Hills Trl, Richmond, TX 77406
$-1,013
Cash flow
-13.6%
Cash-on-Cash Return
3.1%
Cap rate
0.6%
Rent to Value Ratio
Active
$425,000
4
bds
|
0
ba
|
2,601
sqft
|
built
2019
23430 Peareson Bend Ln, Richmond, TX 77469
$-1,257
Cash flow
-15.4%
Cash-on-Cash Return
2.7%
Cap rate
0.7%
Rent to Value Ratio
Active
$439,000
4
bds
|
0
ba
|
2,017
sqft
|
built
1999
22630 Cascade Springs Dr, Katy, TX 77494
$-1,239
Cash flow
-14.7%
Cash-on-Cash Return
2.9%
Cap rate
0.6%
Rent to Value Ratio
Active
$1,589,000
5
bds
|
0
ba
|
5,726
sqft
|
built
2018
18303 Meikle Path, Richmond, TX 77407
$-6,781
Cash flow
-22.3%
Cash-on-Cash Return
1.1%
Cap rate
0.3%
Rent to Value Ratio
Active
$160,000
3
bds
|
0
ba
|
1,488
sqft
|
built
1986
827 Coen Rd, Rosharon, TX 77583
$66
Cash flow
2.2%
Cash-on-Cash Return
6.8%
Cap rate
1.0%
Rent to Value Ratio
Active
$445,000
4
bds
|
0
ba
|
2,649
sqft
|
built
2019
11115 Elderflower Dr, Missouri City, TX 77459
$-1,342
Cash flow
-15.7%
Cash-on-Cash Return
2.6%
Cap rate
0.6%
Rent to Value Ratio
Active
$440,000
3
bds
|
0
ba
|
2,052
sqft
|
built
2020
2146 Coyote Run Dr, Katy, TX 77494
$-1,169
Cash flow
-13.9%
Cash-on-Cash Return
3.1%
Cap rate
0.7%
Rent to Value Ratio
Active
$342,900
4
bds
|
0
ba
|
2,602
sqft
|
built
2020
2446 Wembley Way, Rosenberg, TX 77471
$-987
Cash flow
-15.0%
Cash-on-Cash Return
2.8%
Cap rate
0.7%
Rent to Value Ratio
Active
$929,000
5
bds
|
0
ba
|
4,128
sqft
|
built
2021
2002 Morton Cove Ct, Richmond, TX 77469
$-2,643
Cash flow
-14.8%
Cash-on-Cash Return
2.9%
Cap rate
0.6%
Rent to Value Ratio
Active
$314,990
3
bds
|
0
ba
|
1,750
sqft
|
built
2020
3510 Sicily Island Ln, Katy, TX 77494
$-946
Cash flow
-15.7%
Cash-on-Cash Return
2.7%
Cap rate
0.7%
Rent to Value Ratio