Galveston County Investment Properties for Sale
Browse homes for sale and investment properties in Galveston County. Refine your search by price, property type, or more.
Best cash flowing properties in Galveston County
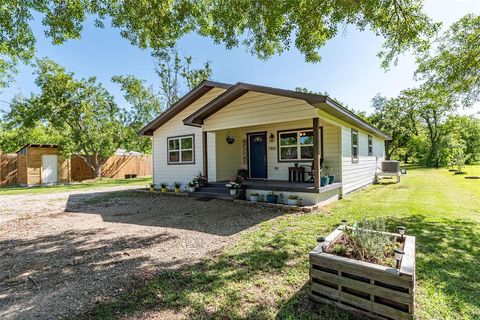
Active
$60,000
bds
|
1
ba
|
432
sqft
|
built
1955
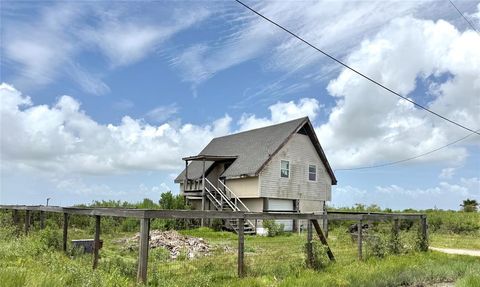
2009 Anderson Ave, Port Bolivar, TX 77650
$657
Cash flow
12.8%
Cash-on-Cash Return
13.1%
Cap rate
2.0%
Rent to Value Ratio
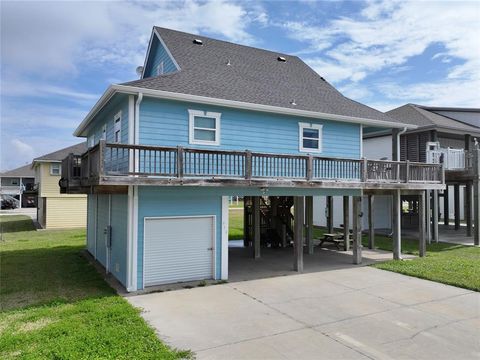
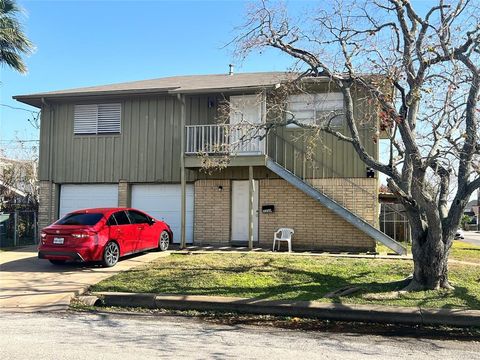
Active
$99,000
2
bds
|
1
ba
|
632
sqft
|
built
1983
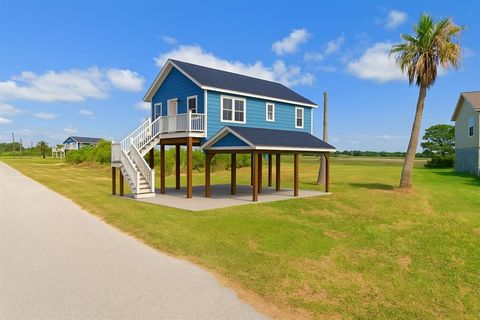
1157 N Tinkle Ln, Crystal Beach, TX 77650
$404
Cash flow
21.3%
Cash-on-Cash Return
10.6%
Cap rate
1.4%
Rent to Value Ratio
1,739 out of 2,071 properties for sale in Galveston County
Limited Results Shown
Create a free account, or log in to reveal all property listings and enjoy the complete experience.
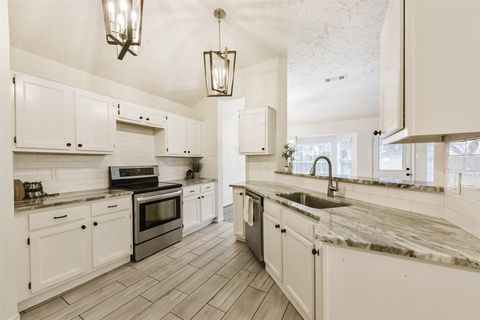
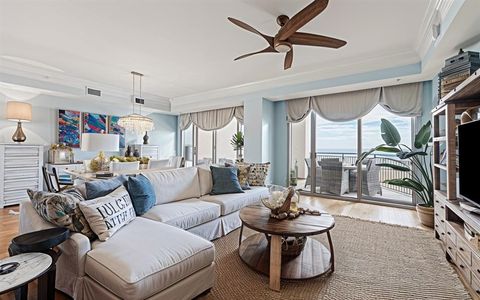
Active
$2,249,000
4
bds
|
5
ba
|
3,483
sqft
|
built
2007
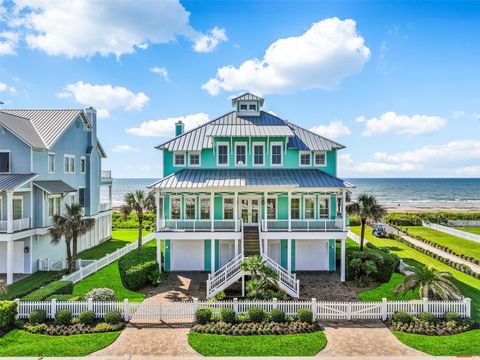
11511 Beachside, Galveston, TX 77554
$-10,635
Cash flow
-24.7%
Cash-on-Cash Return
0.0%
Cap rate
0.2%
Rent to Value Ratio
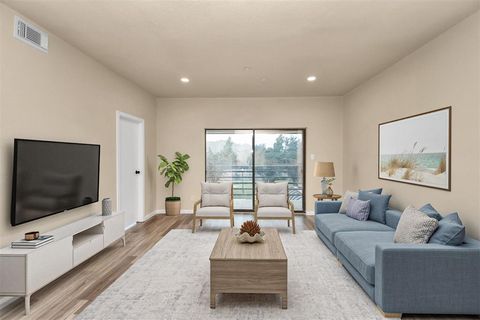
Active
$754,000
3
bds
|
2
ba
|
1,857
sqft
|
built
2013
1314 Sunrise, Crystal Beach, TX 77650
$-2,187
Cash flow
-15.1%
Cash-on-Cash Return
2.2%
Cap rate
0.4%
Rent to Value Ratio
Active
$489,500
4
bds
|
3
ba
|
2,462
sqft
|
built
1974
218 Barracuda St, Bayou Vista, TX 77563
$168
Cash flow
1.8%
Cash-on-Cash Return
6.1%
Cap rate
0.7%
Rent to Value Ratio
Active
$599,999
4
bds
|
4
ba
|
3,138
sqft
|
built
2004
15 N Flamingo St, La Marque, TX 77568
$-1,041
Cash flow
-9.1%
Cash-on-Cash Return
3.6%
Cap rate
0.8%
Rent to Value Ratio
Active
$495,000
3
bds
|
2
ba
|
1,680
sqft
|
built
2011
936 Surf Rd, Crystal Beach, TX 77650
$-1,017
Cash flow
-10.7%
Cash-on-Cash Return
3.2%
Cap rate
0.6%
Rent to Value Ratio

Active
$699,000
3
bds
|
3
ba
|
1,608
sqft
|
built
1983
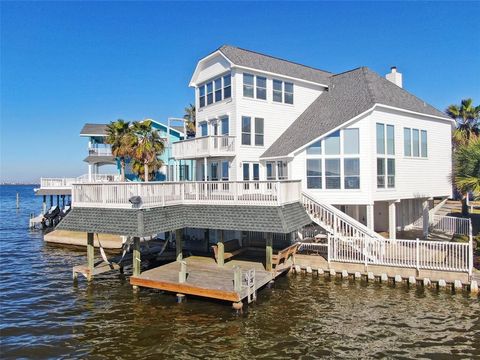
1818 Tiki Dr, Tiki Island, TX 77554
$-1,884
Cash flow
-14.1%
Cash-on-Cash Return
2.4%
Cap rate
0.5%
Rent to Value Ratio
Active
$269,000
3
bds
|
2
ba
|
1,401
sqft
|
built
1981
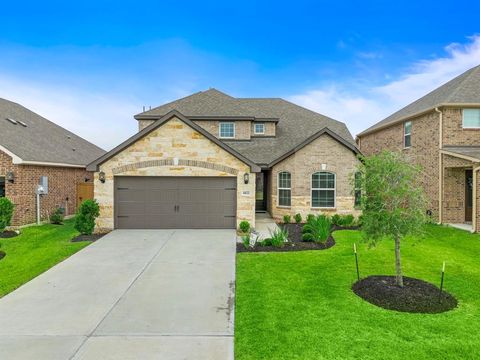
2797 Wood Hollow Dr, League City, TX 77573
$-167
Cash flow
-3.2%
Cash-on-Cash Return
4.9%
Cap rate
0.8%
Rent to Value Ratio
Active
$400,000
2
bds
|
2
ba
|
1,080
sqft
|
built
2004
986 Tuna Dr, Crystal Beach, TX 77650
$-1,003
Cash flow
-13.1%
Cash-on-Cash Return
2.7%
Cap rate
0.5%
Rent to Value Ratio
Active
$2,949,000
4
bds
|
6
ba
|
4,151
sqft
|
built
2013
9 Happy Jack, Hitchcock, TX 77563
$-14,235
Cash flow
-25.2%
Cash-on-Cash Return
-0.1%
Cap rate
0.2%
Rent to Value Ratio
Active
$570,000
3
bds
|
2
ba
|
1,332
sqft
|
built
2010
919 Eastview, Crystal Beach, TX 77650
$-1,420
Cash flow
-13.0%
Cash-on-Cash Return
2.7%
Cap rate
0.5%
Rent to Value Ratio
Active
$550,000
3
bds
|
2
ba
|
4,028
sqft
|
built
1991
8412 Avenue L, Santa Fe, TX 77510
$-1,667
Cash flow
-15.8%
Cash-on-Cash Return
2.0%
Cap rate
0.4%
Rent to Value Ratio
Active
$625,000
3
bds
|
2
ba
|
2,080
sqft
|
built
2021
1003 Redfish St, Bayou Vista, TX 77563
$-1,233
Cash flow
-10.3%
Cash-on-Cash Return
3.3%
Cap rate
0.6%
Rent to Value Ratio
Active
$499,000
3
bds
|
2
ba
|
1,688
sqft
|
built
2003
22409 Vista Del Mar, Galveston, TX 77554
$-527
Cash flow
-5.5%
Cash-on-Cash Return
4.4%
Cap rate
0.7%
Rent to Value Ratio
Active
$560,000
2
bds
|
2
ba
|
1,320
sqft
|
built
1976
22118 Matagorda Dr, Galveston, TX 77554
$-1,243
Cash flow
-11.6%
Cash-on-Cash Return
3.0%
Cap rate
0.6%
Rent to Value Ratio
Active
$290,000
4
bds
|
3
ba
|
1,800
sqft
|
built
1970
806 Moody Ave, League City, TX 77573
$-60
Cash flow
-1.1%
Cash-on-Cash Return
5.4%
Cap rate
0.9%
Rent to Value Ratio
Active
$329,999
3
bds
|
2
ba
|
1,230
sqft
|
built
1970
1803 Avenue Q, Santa Fe, TX 77510
$-486
Cash flow
-7.7%
Cash-on-Cash Return
3.9%
Cap rate
0.7%
Rent to Value Ratio
Active
$373,500
3
bds
|
2
ba
|
1,408
sqft
|
built
2007
976 Bahama Dr, Crystal Beach, TX 77650
$-483
Cash flow
-6.7%
Cash-on-Cash Return
4.1%
Cap rate
0.7%
Rent to Value Ratio
Active
$275,000
3
bds
|
2
ba
|
1,713
sqft
|
built
1981
622 Magnolia Bend St, League City, TX 77573
$-193
Cash flow
-3.7%
Cash-on-Cash Return
4.8%
Cap rate
0.8%
Rent to Value Ratio
Active
$159,000
2
bds
|
1
ba
|
740
sqft
|
built
1983
793 Davis Rd, League City, TX 77573
$-368
Cash flow
-12.1%
Cash-on-Cash Return
2.9%
Cap rate
1.0%
Rent to Value Ratio
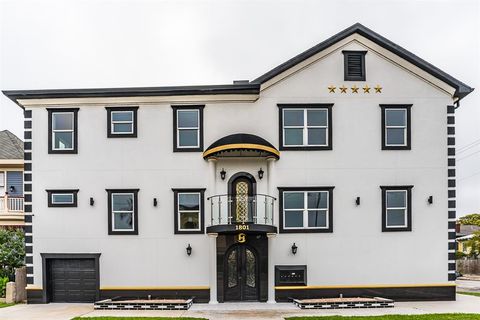
Active
$1,950,000
3
bds
|
3
ba
|
8,082
sqft
|
built
1970
1801 25th St, Galveston, TX 77550
$-8,507
Cash flow
-22.8%
Cash-on-Cash Return
0.4%
Cap rate
0.2%
Rent to Value Ratio
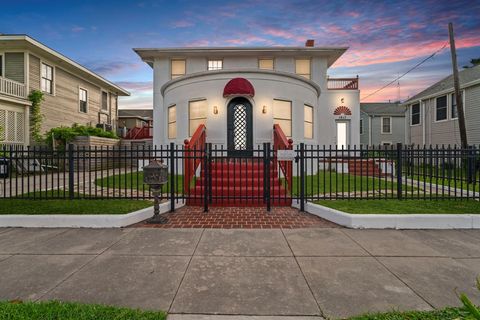
Active
$965,000
7
bds
|
3
ba
|
4,492
sqft
|
built
1965
1919 25th St, Galveston, TX 77550
$-3,305
Cash flow
-17.9%
Cash-on-Cash Return
1.6%
Cap rate
0.3%
Rent to Value Ratio
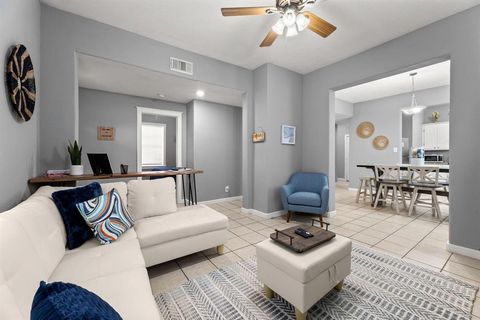
Active
$349,000
5
bds
|
2
ba
|
1,759
sqft
|
built
1957
2727 Avenue K, Galveston, TX 77550
$-1,065
Cash flow
-15.9%
Cash-on-Cash Return
2.0%
Cap rate
0.4%
Rent to Value Ratio
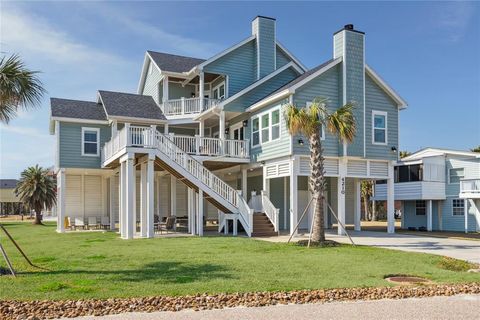
Active
$1,024,880
4
bds
|
3
ba
|
2,498
sqft
|
built
2017
4210 Surf Dr, Galveston, TX 77554
$-1,450
Cash flow
-7.4%
Cash-on-Cash Return
4.0%
Cap rate
0.6%
Rent to Value Ratio
Active
$1,100,000
4
bds
|
5
ba
|
4,051
sqft
|
built
1979
131 Isles End Rd, Tiki Island, TX 77554
$-3,129
Cash flow
-14.8%
Cash-on-Cash Return
2.3%
Cap rate
0.6%
Rent to Value Ratio
Active
$275,000
2
bds
|
1
ba
|
1,688
sqft
|
built
1974
2226 51st St, Galveston, TX 77551
$-357
Cash flow
-6.8%
Cash-on-Cash Return
4.1%
Cap rate
0.7%
Rent to Value Ratio
Active
$319,900
4
bds
|
3
ba
|
2,260
sqft
|
built
2023
14122 Freeboard Dr, Texas City, TX 77510
$-739
Cash flow
-12.1%
Cash-on-Cash Return
2.9%
Cap rate
0.8%
Rent to Value Ratio
Active
$1,640,000
3
bds
|
3
ba
|
2,342
sqft
|
built
2008
801 E Beach Dr, Galveston, TX 77550
$-7,582
Cash flow
-24.1%
Cash-on-Cash Return
0.1%
Cap rate
0.5%
Rent to Value Ratio
Active
$415,000
3
bds
|
3
ba
|
1,775
sqft
|
built
1930
3520 Avenue R, Galveston, TX 77550
$-592
Cash flow
-7.4%
Cash-on-Cash Return
4.0%
Cap rate
0.7%
Rent to Value Ratio
Active
$339,000
2
bds
|
3
ba
|
1,175
sqft
|
built
2011
9520 Seawall Blvd, Galveston, TX 77554
$-1,969
Cash flow
-30.3%
Cash-on-Cash Return
-1.3%
Cap rate
0.7%
Rent to Value Ratio

Active
$435,000
3
bds
|
2
ba
|
1,260
sqft
|
built
1871
1409 21st St, Galveston, TX 77550
$-1,051
Cash flow
-12.6%
Cash-on-Cash Return
2.8%
Cap rate
0.5%
Rent to Value Ratio
Active
$550,000
4
bds
|
4
ba
|
3,437
sqft
|
built
2008
1038 Gladstone Dr, League City, TX 77573
$-1,077
Cash flow
-10.2%
Cash-on-Cash Return
3.3%
Cap rate
0.6%
Rent to Value Ratio
Active
$247,000
3
bds
|
3
ba
|
1,702
sqft
|
built
2005
242 Drake Run Ln, Dickinson, TX 77539
$-213
Cash flow
-4.5%
Cash-on-Cash Return
4.6%
Cap rate
0.9%
Rent to Value Ratio
Active
$189,900
1
bds
|
1
ba
|
521
sqft
|
built
2011
9520 Seawall Blvd, Galveston, TX 77554
$-903
Cash flow
-24.8%
Cash-on-Cash Return
0.0%
Cap rate
0.8%
Rent to Value Ratio
Active
$224,900
2
bds
|
2
ba
|
766
sqft
|
built
1985
9520 Seawall Blvd, Galveston, TX 77554
$-1,527
Cash flow
-35.4%
Cash-on-Cash Return
-2.5%
Cap rate
0.8%
Rent to Value Ratio
Active
$284,000
1
bds
|
1
ba
|
825
sqft
|
built
1996
7000 Seawall Blvd, Galveston, TX 77551
$-1,067
Cash flow
-19.6%
Cash-on-Cash Return
1.2%
Cap rate
0.6%
Rent to Value Ratio

Active
$205,000
1
bds
|
1
ba
|
521
sqft
|
built
2011
9520 Seawall Blvd, Galveston, TX 77554
$-965
Cash flow
-24.6%
Cash-on-Cash Return
0.0%
Cap rate
0.7%
Rent to Value Ratio
Active
$388,000
2
bds
|
2
ba
|
1,095
sqft
|
built
2005
4131 Pointe West Dr, Galveston, TX 77554
$-1,130
Cash flow
-15.2%
Cash-on-Cash Return
2.2%
Cap rate
0.7%
Rent to Value Ratio
Active
$771,000
3
bds
|
3
ba
|
2,027
sqft
|
built
2020
2502 Sunset Psge, Galveston, TX 77550
$-2,778
Cash flow
-18.8%
Cash-on-Cash Return
1.4%
Cap rate
0.6%
Rent to Value Ratio