Harris County Investment Properties for Sale
Browse homes for sale and investment properties in Harris County. Refine your search by price, property type, or more.
Best cash flowing properties in Harris County
Active
$180,000
4
bds
|
2
ba
|
1,947
sqft
|
built
1971
12806 Bauman Rd, Houston, TX 77037
$666
Cash flow
19.3%
Cash-on-Cash Return
10.1%
Cap rate
1.2%
Rent to Value Ratio
Active
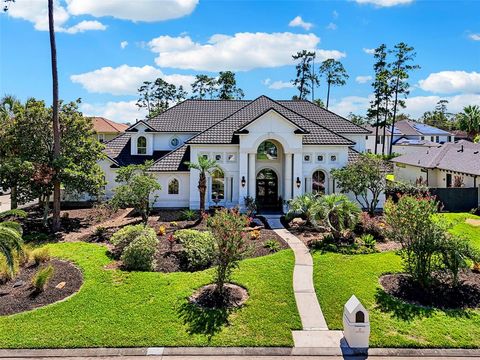
$980,000
5
bds
|
6
ba
|
5,182
sqft
|
built
2005
37 Kings Lake Estates Blvd, Humble, TX 77346
$533
Cash flow
2.8%
Cash-on-Cash Return
6.3%
Cap rate
1.1%
Rent to Value Ratio
8,381 out of 8,921 properties for sale in Harris County
Limited Results Shown
Create a free account, or log in to reveal all property listings and enjoy the complete experience.
Active
$219,000
3
bds
|
2
ba
|
1,448
sqft
|
built
1981
3739 Moonlite Dr, Pasadena, TX 77505
$-6
Cash flow
-0.1%
Cash-on-Cash Return
5.6%
Cap rate
0.9%
Rent to Value Ratio
Active
$175,000
3
bds
|
2
ba
|
956
sqft
|
built
1942
6810 Eastwood St, Houston, TX 77021
$-96
Cash flow
-2.9%
Cash-on-Cash Return
5.0%
Cap rate
0.8%
Rent to Value Ratio
Active
$264,999
4
bds
|
2
ba
|
2,320
sqft
|
built
2019
21454 Bluebonnet Cove Ct, Katy, TX 77449
$-197
Cash flow
-3.9%
Cash-on-Cash Return
4.8%
Cap rate
0.9%
Rent to Value Ratio
Active
$205,000
3
bds
|
3
ba
|
1,694
sqft
|
built
2006
9018 Elm Drake Ln, Humble, TX 77338
$-34
Cash flow
-0.9%
Cash-on-Cash Return
5.5%
Cap rate
0.9%
Rent to Value Ratio
Active
$119,990
3
bds
|
1
ba
|
1,232
sqft
|
built
1953
3210 Mc Crarey Dr, Houston, TX 77088
$260
Cash flow
11.3%
Cash-on-Cash Return
8.3%
Cap rate
1.3%
Rent to Value Ratio
Active
$164,999
3
bds
|
2
ba
|
1,354
sqft
|
built
1984
10727 Kentington Oak Dr, Humble, TX 77396
$74
Cash flow
2.3%
Cash-on-Cash Return
6.2%
Cap rate
1.1%
Rent to Value Ratio
Active
$499,900
5
bds
|
4
ba
|
3,197
sqft
|
built
2021
15651 Baronial Castle Dr, Humble, TX 77346
$-158
Cash flow
-1.6%
Cash-on-Cash Return
5.3%
Cap rate
0.6%
Rent to Value Ratio
Active
$155,000
2
bds
|
3
ba
|
1,664
sqft
|
built
1963
3300 Yorktown St, Houston, TX 77056
$-1,068
Cash flow
-35.9%
Cash-on-Cash Return
-2.6%
Cap rate
1.3%
Rent to Value Ratio
Active
$181,500
2
bds
|
3
ba
|
1,728
sqft
|
built
1973
10631 Sandpiper Dr, Houston, TX 77096
$230
Cash flow
6.6%
Cash-on-Cash Return
7.2%
Cap rate
1.1%
Rent to Value Ratio
Active
$184,999
3
bds
|
2
ba
|
1,075
sqft
|
built
1983
22918 Cabanna Rd, Spring, TX 77389
$-102
Cash flow
-2.9%
Cash-on-Cash Return
5.0%
Cap rate
0.9%
Rent to Value Ratio
Active
$490,000
4
bds
|
3
ba
|
3,111
sqft
|
built
2021
21138 Yellow Bay Dr, Cypress, TX 77433
$-28
Cash flow
-0.3%
Cash-on-Cash Return
5.6%
Cap rate
0.7%
Rent to Value Ratio
Active
$265,000
3
bds
|
3
ba
|
1,924
sqft
|
built
2022
23319 Greenway Creek Ln, Spring, TX 77373
$-412
Cash flow
-8.1%
Cash-on-Cash Return
3.8%
Cap rate
0.8%
Rent to Value Ratio
Active
$155,000
2
bds
|
2
ba
|
1,282
sqft
|
built
1982
14911 Wunderlich Dr, Houston, TX 77069
$-262
Cash flow
-8.8%
Cash-on-Cash Return
3.7%
Cap rate
1.0%
Rent to Value Ratio
Active
$289,990
4
bds
|
3
ba
|
2,320
sqft
|
built
2021
23431 Wrexham St, Spring, TX 77373
$380
Cash flow
6.8%
Cash-on-Cash Return
7.2%
Cap rate
0.9%
Rent to Value Ratio
Active
$344,000
3
bds
|
3
ba
|
1,876
sqft
|
built
2022
9408 Caddo Ridge Ln, Cypress, TX 77433
$-656
Cash flow
-9.9%
Cash-on-Cash Return
3.4%
Cap rate
0.8%
Rent to Value Ratio
Active
$155,000
2
bds
|
1
ba
|
1,012
sqft
|
built
1938
7815 Dayton St, Houston, TX 77012
$157
Cash flow
5.3%
Cash-on-Cash Return
6.9%
Cap rate
1.0%
Rent to Value Ratio
Active
$539,000
4
bds
|
4
ba
|
3,556
sqft
|
built
2005
20803 Twisted Leaf Dr, Cypress, TX 77433
$-1,097
Cash flow
-10.6%
Cash-on-Cash Return
3.2%
Cap rate
0.7%
Rent to Value Ratio
Active
$300,000
4
bds
|
3
ba
|
2,644
sqft
|
built
1994
3603 Havenmoor Pl, Katy, TX 77449
$-308
Cash flow
-5.4%
Cash-on-Cash Return
4.4%
Cap rate
0.8%
Rent to Value Ratio
Active
$2,895,000
4
bds
|
4
ba
|
3,306
sqft
|
built
1974
435 Flint Point Dr, Houston, TX 77024
$-12,493
Cash flow
-22.5%
Cash-on-Cash Return
0.5%
Cap rate
0.2%
Rent to Value Ratio
Active
$239,900
3
bds
|
2
ba
|
2,165
sqft
|
built
1982
3014 Royal Glen Dr, Humble, TX 77339
$-333
Cash flow
-7.2%
Cash-on-Cash Return
4.0%
Cap rate
0.8%
Rent to Value Ratio
Active
$399,500
3
bds
|
2
ba
|
2,370
sqft
|
built
1978
15605 Elwood Dr, Jersey Village, TX 77040
$-572
Cash flow
-7.5%
Cash-on-Cash Return
4.0%
Cap rate
0.8%
Rent to Value Ratio
Active
$335,000
4
bds
|
3
ba
|
2,076
sqft
|
built
1975
10007 Sagedowne Ln, Houston, TX 77089
$-681
Cash flow
-10.6%
Cash-on-Cash Return
3.2%
Cap rate
0.6%
Rent to Value Ratio
Active
$525,000
4
bds
|
3
ba
|
2,630
sqft
|
built
1955
1510 E Archer Rd, Baytown, TX 77521
$-622
Cash flow
-6.2%
Cash-on-Cash Return
4.3%
Cap rate
0.7%
Rent to Value Ratio
Active
$316,000
4
bds
|
3
ba
|
3,213
sqft
|
built
2010
9514 Barr Spring Dr, Humble, TX 77396
$-544
Cash flow
-9.0%
Cash-on-Cash Return
3.6%
Cap rate
0.8%
Rent to Value Ratio
Active
$2,900,000
4
bds
|
4
ba
|
4,947
sqft
|
built
2000
2409 Maconda Ln, Houston, TX 77027
$-11,491
Cash flow
-20.7%
Cash-on-Cash Return
0.9%
Cap rate
0.3%
Rent to Value Ratio
Active
$295,000
3
bds
|
2
ba
|
2,027
sqft
|
built
1976
3210 Lakehaven Dr, Humble, TX 77339
$-496
Cash flow
-8.8%
Cash-on-Cash Return
3.7%
Cap rate
0.7%
Rent to Value Ratio
Active
$1,250,000
4
bds
|
4
ba
|
4,664
sqft
|
built
1940
2127 Milford St, Houston, TX 77098
$-5,678
Cash flow
-23.7%
Cash-on-Cash Return
0.2%
Cap rate
0.3%
Rent to Value Ratio
Active
$319,999
2
bds
|
1
ba
|
720
sqft
|
built
1930
3417 Bremond St, Houston, TX 77004
$-1,197
Cash flow
-19.5%
Cash-on-Cash Return
1.2%
Cap rate
0.3%
Rent to Value Ratio
Active
$390,000
4
bds
|
4
ba
|
3,097
sqft
|
built
1993
6923 Queensclub Dr, Houston, TX 77069
$-707
Cash flow
-9.5%
Cash-on-Cash Return
3.5%
Cap rate
0.7%
Rent to Value Ratio
Active
$185,000
3
bds
|
2
ba
|
1,307
sqft
|
built
1978
2445 Briarwest Blvd, Houston, TX 77077
$-307
Cash flow
-8.7%
Cash-on-Cash Return
3.7%
Cap rate
0.9%
Rent to Value Ratio
Active
$420,000
3
bds
|
2
ba
|
1,600
sqft
|
built
1955
3709 Gager St, Houston, TX 77093
$-1,151
Cash flow
-14.3%
Cash-on-Cash Return
2.4%
Cap rate
0.4%
Rent to Value Ratio
Active
$297,900
4
bds
|
2
ba
|
2,573
sqft
|
built
1968
202 Black Forest Dr, Spring, TX 77388
$-6
Cash flow
-0.1%
Cash-on-Cash Return
5.7%
Cap rate
0.9%
Rent to Value Ratio

Active
$199,900
3
bds
|
1
ba
|
1,604
sqft
|
built
1950
405 W Jack St, Baytown, TX 77520
$-97
Cash flow
-2.5%
Cash-on-Cash Return
5.1%
Cap rate
0.8%
Rent to Value Ratio
Active
$380,000
4
bds
|
3
ba
|
2,390
sqft
|
built
1976
16201 Singapore Ln, Jersey Village, TX 77040
$-641
Cash flow
-8.8%
Cash-on-Cash Return
3.7%
Cap rate
0.7%
Rent to Value Ratio
Active
$249,500
3
bds
|
2
ba
|
1,539
sqft
|
built
1979
12531 La Rochelle Dr, Houston, TX 77015
$-403
Cash flow
-8.4%
Cash-on-Cash Return
3.7%
Cap rate
0.7%
Rent to Value Ratio
Active
$409,900
4
bds
|
3
ba
|
2,740
sqft
|
built
2004
11303 S Country Club Green Dr, Tomball, TX 77375
$-440
Cash flow
-5.6%
Cash-on-Cash Return
4.4%
Cap rate
0.7%
Rent to Value Ratio
Active
$305,000
4
bds
|
3
ba
|
2,161
sqft
|
built
2022
5462 Creekstone Rise Ln, Spring, TX 77373
$-614
Cash flow
-10.5%
Cash-on-Cash Return
3.3%
Cap rate
0.8%
Rent to Value Ratio
Active
$289,990
4
bds
|
2
ba
|
1,854
sqft
|
built
2023
9522 Twilight Briar Ln, Baytown, TX 77521
$-545
Cash flow
-9.8%
Cash-on-Cash Return
3.4%
Cap rate
0.8%
Rent to Value Ratio