Harris County Investment Properties for Sale
Browse homes for sale and investment properties in Harris County. Refine your search by price, property type, or more.
Best cash flowing properties in Harris County
Active
$485,000
3
bds
|
2
ba
|
0
sqft
|
built
1970
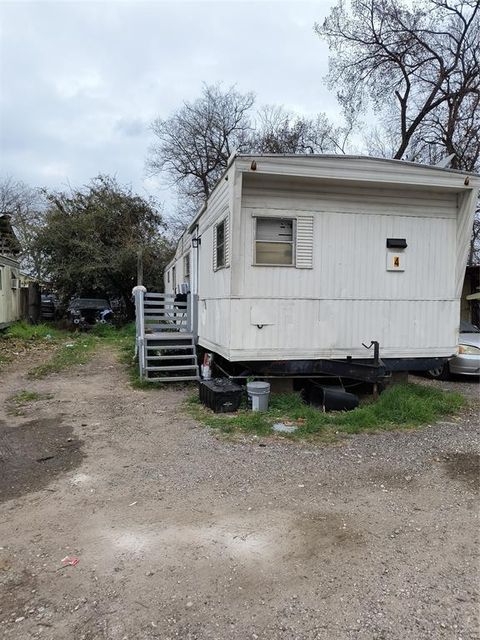
113 Busch St, Houston, TX 77060
$0
Cash flow
n/a
Cash-on-Cash Return
n/a
Cap rate
n/a
Rent to Value Ratio

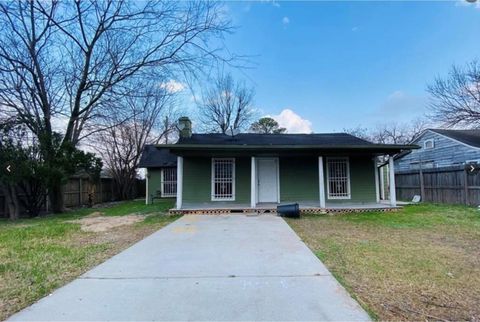
Active
$185,000
4
bds
|
2
ba
|
1,280
sqft
|
built
1955
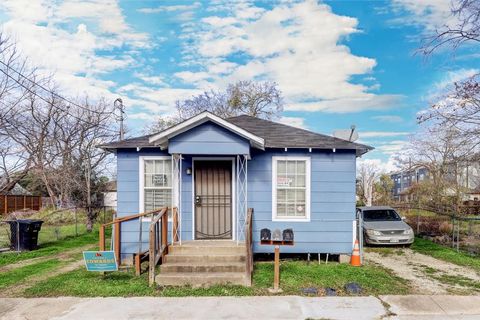
14619 Caradine St, Houston, TX 77085
$-316
Cash flow
-8.9%
Cash-on-Cash Return
3.6%
Cap rate
0.6%
Rent to Value Ratio
214 out of 409 properties for sale in Harris County
Limited Results Shown
Create a free account, or log in to reveal all property listings and enjoy the complete experience.
Active
$319,999
2
bds
|
1
ba
|
720
sqft
|
built
1930
3417 Bremond St, Houston, TX 77004
$-1,197
Cash flow
-19.5%
Cash-on-Cash Return
1.2%
Cap rate
0.3%
Rent to Value Ratio
Active
$420,000
3
bds
|
2
ba
|
1,600
sqft
|
built
1955
3709 Gager St, Houston, TX 77093
$-1,151
Cash flow
-14.3%
Cash-on-Cash Return
2.4%
Cap rate
0.4%
Rent to Value Ratio
Active
$510,000
3
bds
|
2
ba
|
1,431
sqft
|
built
2022
7422 Mount St, Houston, TX 77088
$-1,220
Cash flow
-12.5%
Cash-on-Cash Return
2.8%
Cap rate
0.4%
Rent to Value Ratio
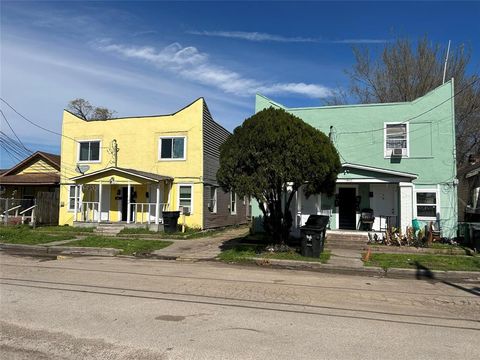
Active
$525,000
9
bds
|
0
ba
|
2,992
sqft
|
built
1948
4718 Gunter St, Houston, TX 77020
$-1,490
Cash flow
-14.8%
Cash-on-Cash Return
2.3%
Cap rate
0.5%
Rent to Value Ratio
Active
$415,000
3
bds
|
3
ba
|
2,360
sqft
|
built
2023
11610 Danford Ln, Houston, TX 77016
$-1,579
Cash flow
-19.9%
Cash-on-Cash Return
1.1%
Cap rate
0.4%
Rent to Value Ratio
Active
$2,100,000
4
bds
|
2
ba
|
46,575
sqft
|
built
1920
2502 Berry St, Houston, TX 77004
$-8,834
Cash flow
-21.9%
Cash-on-Cash Return
0.6%
Cap rate
0.1%
Rent to Value Ratio
Active
$1,275,000
2
bds
|
1
ba
|
6,728
sqft
|
built
1967
4820 Oak Ave, Pasadena, TX 77503
$-5,699
Cash flow
-23.3%
Cash-on-Cash Return
0.3%
Cap rate
0.1%
Rent to Value Ratio
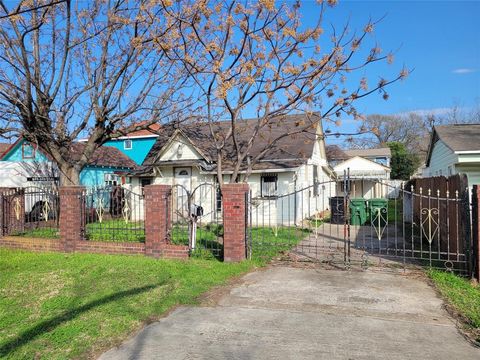
Active
$315,000
4
bds
|
4
ba
|
1,550
sqft
|
built
1938
3229 Holman St, Houston, TX 77004
$-1,461
Cash flow
-24.2%
Cash-on-Cash Return
0.1%
Cap rate
0.2%
Rent to Value Ratio
Active
$399,900
3
bds
|
2
ba
|
2,300
sqft
|
built
2020
5911 Westover St, Houston, TX 77033
$-1,206
Cash flow
-15.7%
Cash-on-Cash Return
2.1%
Cap rate
0.5%
Rent to Value Ratio
Active
$1,125,000
5
bds
|
3
ba
|
3,748
sqft
|
built
1950
1902 Elmen St, Houston, TX 77019
$-5,532
Cash flow
-25.7%
Cash-on-Cash Return
-0.2%
Cap rate
0.2%
Rent to Value Ratio
Active
$285,000
2
bds
|
1
ba
|
1,500
sqft
|
built
1945
305 Johnson St, Pasadena, TX 77506
$-712
Cash flow
-13.0%
Cash-on-Cash Return
2.7%
Cap rate
0.5%
Rent to Value Ratio
Active
$270,000
2
bds
|
1
ba
|
1,520
sqft
|
built
1950
5910 Sycamore Ave, Pasadena, TX 77503
$-526
Cash flow
-10.2%
Cash-on-Cash Return
3.3%
Cap rate
0.6%
Rent to Value Ratio
Active
$315,000
bds
|
2
ba
|
1,885
sqft
|
built
1935
304 S Lockwood Dr, Houston, TX 77011
$-571
Cash flow
-9.5%
Cash-on-Cash Return
3.5%
Cap rate
0.8%
Rent to Value Ratio
Active
$550,000
5
bds
|
3
ba
|
3,880
sqft
|
built
1940
3810 Hurley St, Houston, TX 77093
$-2,164
Cash flow
-20.5%
Cash-on-Cash Return
1.0%
Cap rate
0.2%
Rent to Value Ratio
Active
$1,695,000
bds
|
0
ba
|
6,120
sqft
|
built
1935
2021 Kane St, Houston, TX 77007
$-8,817
Cash flow
-27.1%
Cash-on-Cash Return
-0.6%
Cap rate
0.1%
Rent to Value Ratio
Active
$799,999
3
bds
|
1
ba
|
3,400
sqft
|
built
1935
1819 Branard St, Houston, TX 77098
$-3,473
Cash flow
-22.7%
Cash-on-Cash Return
0.5%
Cap rate
0.3%
Rent to Value Ratio
Active
$1,800,000
3
bds
|
0
ba
|
5,800
sqft
|
built
1960
511 Gulf Bank Rd, Houston, TX 77037
$-6,846
Cash flow
-19.8%
Cash-on-Cash Return
1.1%
Cap rate
0.2%
Rent to Value Ratio

Active
$427,000
2
bds
|
1
ba
|
2,396
sqft
|
built
1961
11202 Waxwing St, Houston, TX 77035
$-1,437
Cash flow
-17.6%
Cash-on-Cash Return
1.6%
Cap rate
0.4%
Rent to Value Ratio
Active
$620,000
2
bds
|
2
ba
|
1,956
sqft
|
built
1940
606 Enid St, Houston, TX 77009
$-2,799
Cash flow
-23.6%
Cash-on-Cash Return
0.3%
Cap rate
0.2%
Rent to Value Ratio
Active
$1,600,000
4
bds
|
2
ba
|
3,298
sqft
|
built
1945
1909 Ruth St, Houston, TX 77004
$-6,982
Cash flow
-22.8%
Cash-on-Cash Return
0.4%
Cap rate
0.2%
Rent to Value Ratio
Active
$315,000
6
bds
|
2
ba
|
1,612
sqft
|
built
2018
8002 Cargill St, Houston, TX 77029
$-918
Cash flow
-15.2%
Cash-on-Cash Return
2.2%
Cap rate
0.4%
Rent to Value Ratio
Active
$800,000
3
bds
|
2
ba
|
2,154
sqft
|
built
1920
1622 W Alabama St, Houston, TX 77006
$-3,021
Cash flow
-19.7%
Cash-on-Cash Return
1.1%
Cap rate
0.4%
Rent to Value Ratio
Active
$270,000
2
bds
|
1
ba
|
1,108
sqft
|
built
1950
5906 Sycamore Ave, Pasadena, TX 77503
$-618
Cash flow
-11.9%
Cash-on-Cash Return
2.9%
Cap rate
0.5%
Rent to Value Ratio
Active
$725,000
2
bds
|
2
ba
|
2,332
sqft
|
built
1939
1637 Castle Ct, Houston, TX 77006
$-2,665
Cash flow
-19.2%
Cash-on-Cash Return
1.3%
Cap rate
0.3%
Rent to Value Ratio

Active
$349,990
3
bds
|
2
ba
|
2,402
sqft
|
built
2022
336 De Haven St, Houston, TX 77029
$-1,031
Cash flow
-15.4%
Cash-on-Cash Return
2.1%
Cap rate
0.5%
Rent to Value Ratio
Active
$395,000
6
bds
|
4
ba
|
2,058
sqft
|
built
2021
6809 Glass St, Houston, TX 77016
$-1,436
Cash flow
-19.0%
Cash-on-Cash Return
1.3%
Cap rate
0.4%
Rent to Value Ratio
Active
$220,000
4
bds
|
2
ba
|
1,664
sqft
|
built
1945
301 Connecticut St, Houston, TX 77029
$-483
Cash flow
-11.5%
Cash-on-Cash Return
3.0%
Cap rate
0.5%
Rent to Value Ratio
Active
$255,000
2
bds
|
2
ba
|
1,272
sqft
|
built
1954
1016 Apache St, Houston, TX 77022
$-524
Cash flow
-10.7%
Cash-on-Cash Return
3.2%
Cap rate
0.5%
Rent to Value Ratio
Active
$510,000
bds
|
0
ba
|
1,280
sqft
|
built
1940
1413 Egypt St, Houston, TX 77009
$-2,387
Cash flow
-24.4%
Cash-on-Cash Return
0.1%
Cap rate
0.2%
Rent to Value Ratio
Active
$299,000
3
bds
|
1
ba
|
2,387
sqft
|
built
1945
605 Post St, Houston, TX 77022
$-451
Cash flow
-7.9%
Cash-on-Cash Return
3.9%
Cap rate
0.6%
Rent to Value Ratio
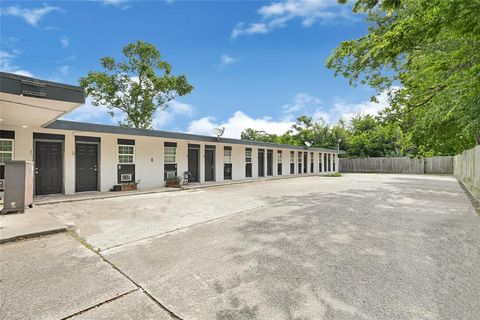
Active
$700,000
10
bds
|
10
ba
|
2,700
sqft
|
built
1930
7109 Avenue E, Houston, TX 77011
$-2,972
Cash flow
-22.2%
Cash-on-Cash Return
0.6%
Cap rate
0.2%
Rent to Value Ratio
Active
$235,000
3
bds
|
3
ba
|
1,648
sqft
|
built
1940
4512 Siegel St, Houston, TX 77009
$-997
Cash flow
-22.1%
Cash-on-Cash Return
0.6%
Cap rate
0.4%
Rent to Value Ratio
Active
$900,000
1
bds
|
1
ba
|
2,638
sqft
|
built
1966
3714 Dabney St, Houston, TX 77026
$-4,388
Cash flow
-25.4%
Cash-on-Cash Return
-0.2%
Cap rate
0.1%
Rent to Value Ratio
Active
$275,000
5
bds
|
3
ba
|
1,757
sqft
|
built
1940
1716 Maryland St, Baytown, TX 77520
$-750
Cash flow
-14.2%
Cash-on-Cash Return
2.4%
Cap rate
0.5%
Rent to Value Ratio
Active
$799,000
6
bds
|
0
ba
|
2,460
sqft
|
built
1919
203 S Lockwood Dr, Houston, TX 77011
$-2,539
Cash flow
-16.6%
Cash-on-Cash Return
1.9%
Cap rate
0.2%
Rent to Value Ratio
Active
$400,000
4
bds
|
3
ba
|
1,410
sqft
|
built
1910
1905 Chapman St, Houston, TX 77009
$-1,565
Cash flow
-20.4%
Cash-on-Cash Return
1.0%
Cap rate
0.3%
Rent to Value Ratio
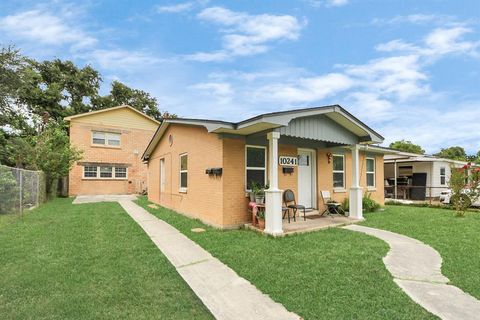
Active
$310,000
4
bds
|
3
ba
|
2,160
sqft
|
built
1965
10241 Norvic St, Houston, TX 77029
$-477
Cash flow
-8.0%
Cash-on-Cash Return
3.8%
Cap rate
0.7%
Rent to Value Ratio
Active
$270,000
2
bds
|
1
ba
|
1,500
sqft
|
built
1950
5902 Sycamore Ave, Pasadena, TX 77503
$-522
Cash flow
-10.1%
Cash-on-Cash Return
3.4%
Cap rate
0.6%
Rent to Value Ratio