Harris County Investment Properties for Sale
Browse homes for sale and investment properties in Harris County. Refine your search by price, property type, or more.
Best cash flowing properties in Harris County
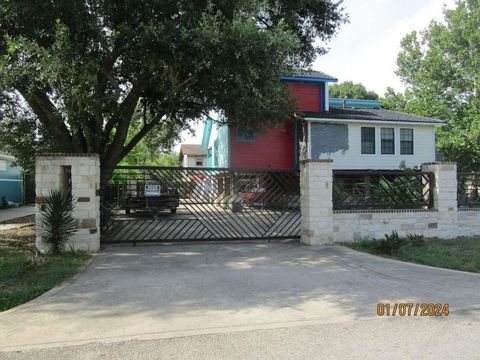
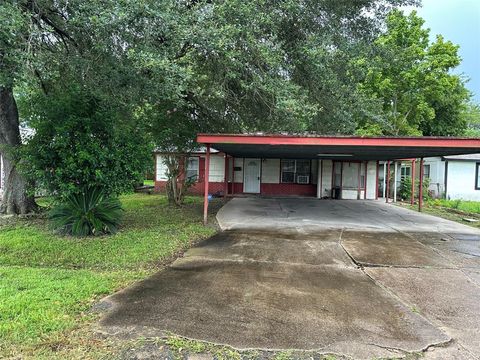
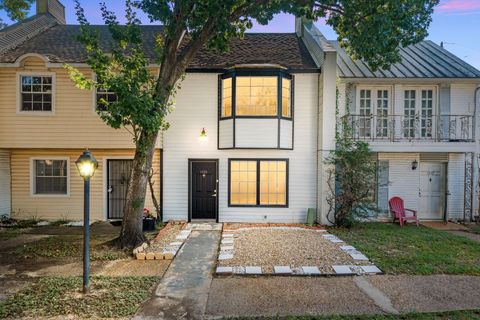
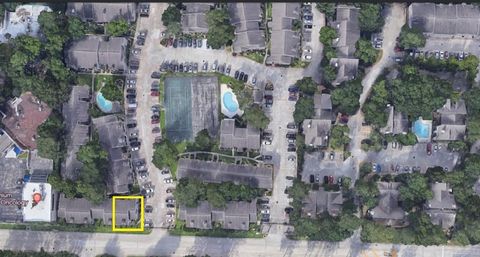
Active
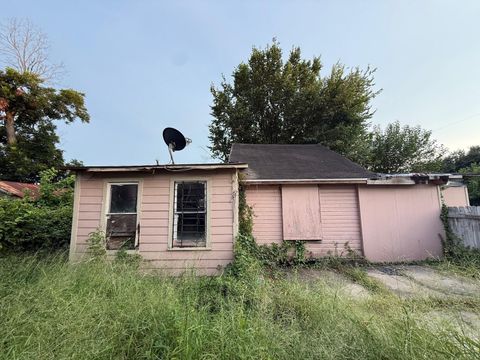
$85,000
2
bds
|
1
ba
|
870
sqft
|
built
1980
10501 South Dr, Houston, TX 77099
$357
Cash flow
21.9%
Cash-on-Cash Return
10.7%
Cap rate
1.3%
Rent to Value Ratio

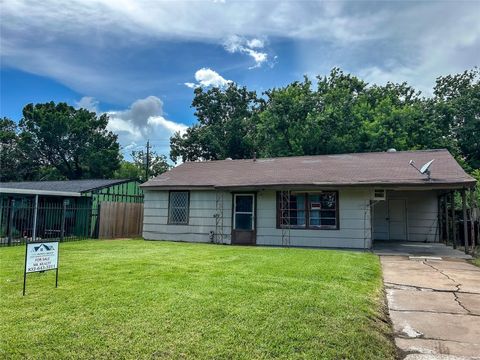
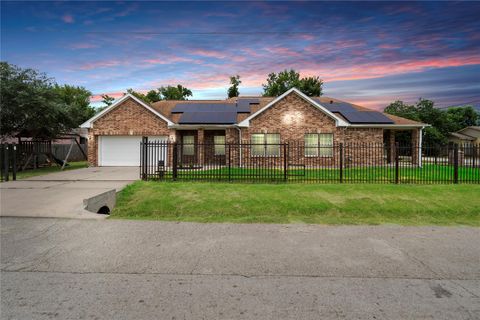
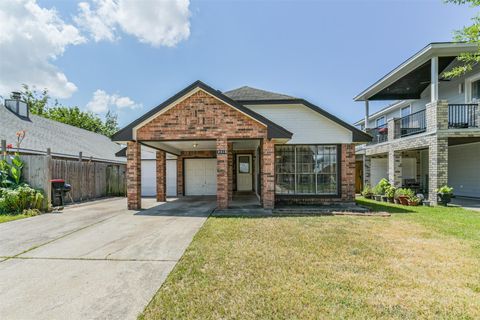
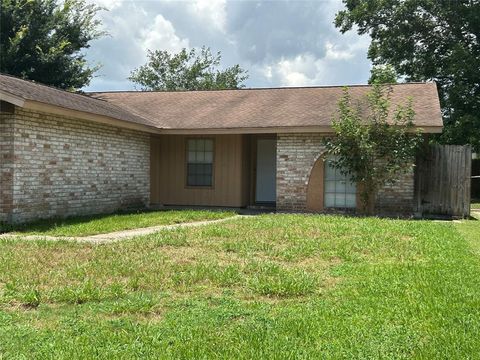
Active
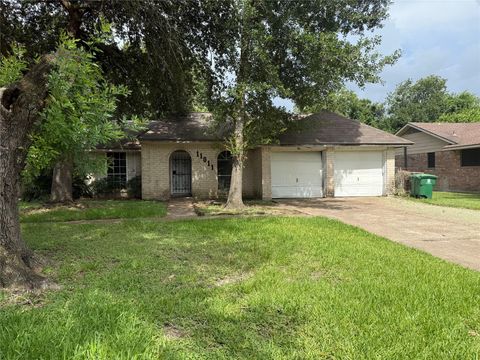
$132,500
3
bds
|
1
ba
|
894
sqft
|
built
1956
11103 Rubin St, Houston, TX 77047
$339
Cash flow
13.3%
Cash-on-Cash Return
8.7%
Cap rate
1.1%
Rent to Value Ratio
7,899 out of 8,412 properties for sale in Harris County
Limited Results Shown
Create a free account, or log in to reveal all property listings and enjoy the complete experience.
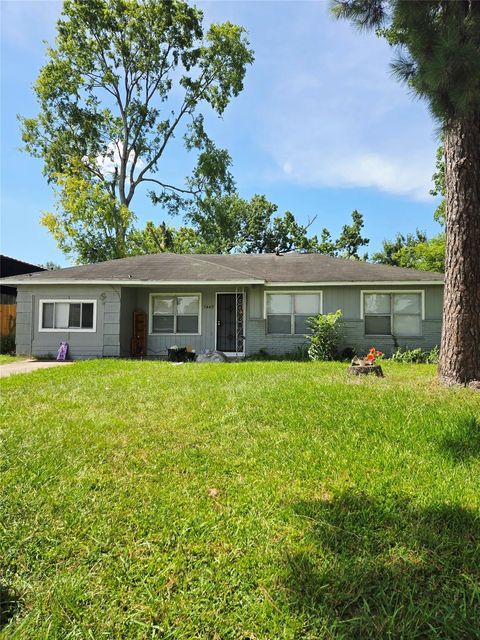
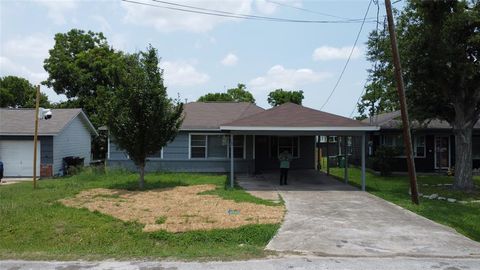
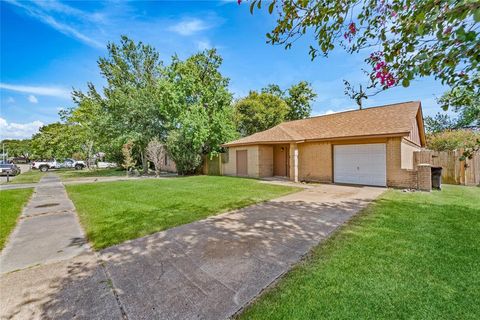
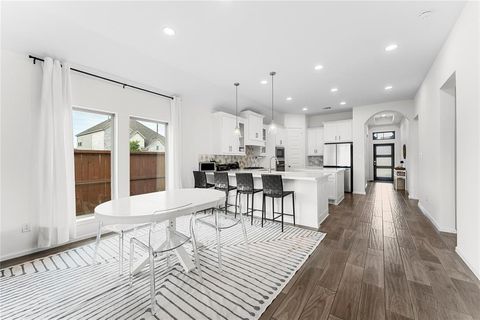
Active
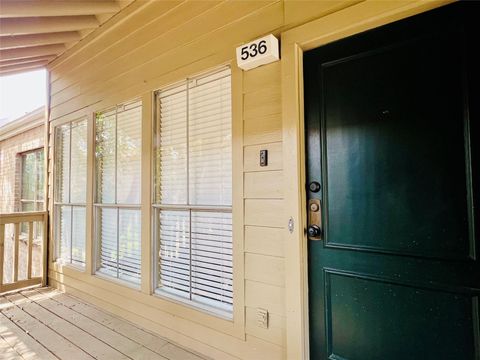
$139,000
2
bds
|
1
ba
|
1,028
sqft
|
built
1967
7900 Westheimer Rd, Houston, TX 77063
$-150
Cash flow
-5.6%
Cash-on-Cash Return
4.4%
Cap rate
1.2%
Rent to Value Ratio

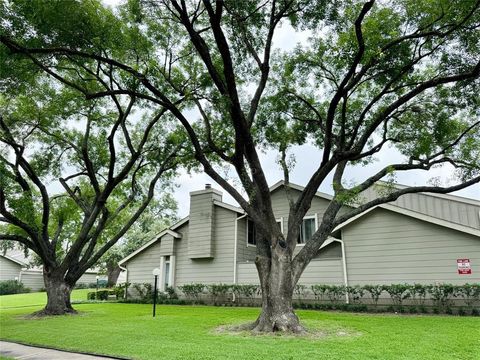
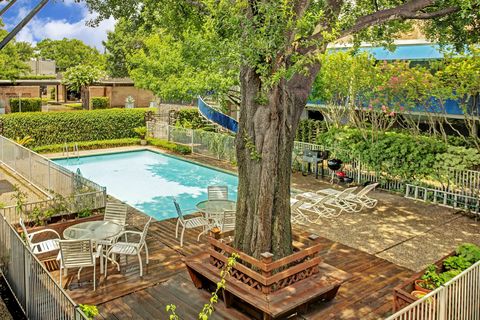
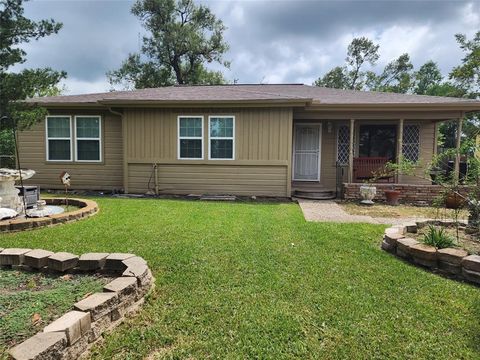
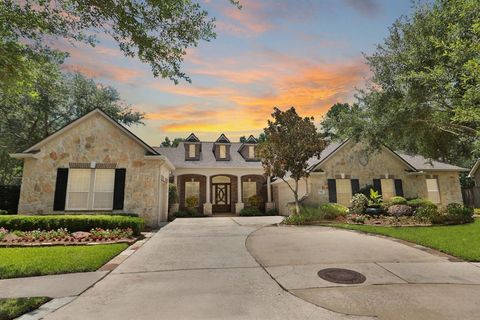
Active
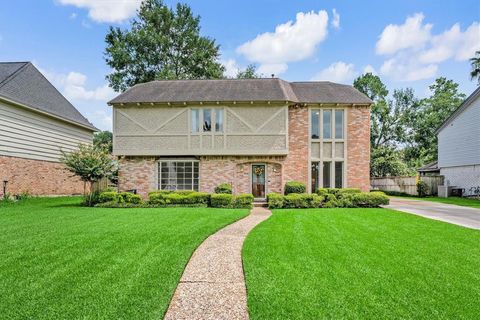
$248,000
4
bds
|
3
ba
|
1,890
sqft
|
built
2005
806 Sycamore Ridge Ln, Houston, TX 77073
$-255
Cash flow
-5.4%
Cash-on-Cash Return
4.4%
Cap rate
0.8%
Rent to Value Ratio
Active
$275,000
2
bds
|
2
ba
|
2,209
sqft
|
built
1935
7525 Canal St, Houston, TX 77012
$-297
Cash flow
-5.6%
Cash-on-Cash Return
4.4%
Cap rate
0.8%
Rent to Value Ratio
Active
$105,000
2
bds
|
2
ba
|
924
sqft
|
built
1977
9009 Richmond Ave, Houston, TX 77063
$-180
Cash flow
-8.9%
Cash-on-Cash Return
3.6%
Cap rate
1.2%
Rent to Value Ratio
Active
$227,499
4
bds
|
3
ba
|
1,840
sqft
|
built
1980
8939 Intervale St, Houston, TX 77075
$-363
Cash flow
-8.3%
Cash-on-Cash Return
3.8%
Cap rate
0.8%
Rent to Value Ratio
Active
$160,000
2
bds
|
1
ba
|
825
sqft
|
built
1955
7810 Darnay Dr, Houston, TX 77033
$72
Cash flow
2.3%
Cash-on-Cash Return
6.2%
Cap rate
0.9%
Rent to Value Ratio
Active
$140,000
4
bds
|
2
ba
|
1,252
sqft
|
built
1950
7445 Cabot St, Houston, TX 77016
$164
Cash flow
6.1%
Cash-on-Cash Return
7.1%
Cap rate
1.1%
Rent to Value Ratio
Active
$163,900
2
bds
|
2
ba
|
1,251
sqft
|
built
1979
12991 Wirevine Ln, Houston, TX 77072
$-326
Cash flow
-10.4%
Cash-on-Cash Return
3.3%
Cap rate
0.9%
Rent to Value Ratio

Active
$178,999
3
bds
|
2
ba
|
880
sqft
|
built
1945
2318 Cresline St, Houston, TX 77093
$139
Cash flow
4.1%
Cash-on-Cash Return
6.6%
Cap rate
1.0%
Rent to Value Ratio
Active
$149,900
3
bds
|
1
ba
|
1,224
sqft
|
built
1952
4730 Angleton St, Houston, TX 77033
$240
Cash flow
8.4%
Cash-on-Cash Return
7.6%
Cap rate
1.1%
Rent to Value Ratio
Active
$289,900
4
bds
|
2
ba
|
1,515
sqft
|
built
2015
3001 Wayne St, Houston, TX 77026
$-296
Cash flow
-5.3%
Cash-on-Cash Return
4.5%
Cap rate
0.8%
Rent to Value Ratio

Active
$129,900
1
bds
|
2
ba
|
810
sqft
|
built
1980
8801 Hammerly Blvd, Houston, TX 77080
$-186
Cash flow
-7.5%
Cash-on-Cash Return
4.0%
Cap rate
1.1%
Rent to Value Ratio

Active
$205,000
3
bds
|
1
ba
|
1,288
sqft
|
built
1955
11518 Munn St, Houston, TX 77029
$-190
Cash flow
-4.8%
Cash-on-Cash Return
4.6%
Cap rate
0.7%
Rent to Value Ratio
Active
$255,000
4
bds
|
2
ba
|
1,344
sqft
|
built
1955
4215 East Ln, Houston, TX 77026
$-265
Cash flow
-5.4%
Cash-on-Cash Return
4.4%
Cap rate
0.6%
Rent to Value Ratio
Active
$189,000
2
bds
|
1
ba
|
990
sqft
|
built
1965
3271 Sul Ross St, Houston, TX 77098
$-248
Cash flow
-6.8%
Cash-on-Cash Return
4.1%
Cap rate
0.7%
Rent to Value Ratio
Active
$175,000
3
bds
|
3
ba
|
1,560
sqft
|
built
1966
1257 Witte Rd, Houston, TX 77055
$-354
Cash flow
-10.6%
Cash-on-Cash Return
3.3%
Cap rate
1.0%
Rent to Value Ratio

Active
$174,900
3
bds
|
1
ba
|
1,189
sqft
|
built
1949
8172 Milredge St, Houston, TX 77017
$56
Cash flow
1.7%
Cash-on-Cash Return
6.1%
Cap rate
0.9%
Rent to Value Ratio
Active
$219,900
3
bds
|
2
ba
|
1,527
sqft
|
built
1984
2315 Tomlinson Trail Dr, Houston, TX 77067
$-241
Cash flow
-5.7%
Cash-on-Cash Return
4.4%
Cap rate
0.8%
Rent to Value Ratio
Active
$162,000
2
bds
|
1
ba
|
1,028
sqft
|
built
1981
9811 Mill Shadow Dr, Houston, TX 77070
$-28
Cash flow
-0.9%
Cash-on-Cash Return
5.5%
Cap rate
1.0%
Rent to Value Ratio
Active
$189,993
3
bds
|
2
ba
|
1,585
sqft
|
built
1956
11008 Penelope Dr, Houston, TX 77013
$-68
Cash flow
-1.9%
Cash-on-Cash Return
5.2%
Cap rate
0.8%
Rent to Value Ratio

Active
$285,000
2
bds
|
1
ba
|
720
sqft
|
built
1945
5604 Gano St, Houston, TX 77009
$-107
Cash flow
-2.0%
Cash-on-Cash Return
5.2%
Cap rate
0.6%
Rent to Value Ratio
Active
$239,950
4
bds
|
2
ba
|
1,426
sqft
|
built
1985
7772 Park Falls Dr, Houston, TX 77095
$-268
Cash flow
-5.8%
Cash-on-Cash Return
4.3%
Cap rate
0.8%
Rent to Value Ratio
Active
$239,750
4
bds
|
3
ba
|
1,677
sqft
|
built
1982
4735 Brownfields Dr, Houston, TX 77066
$-362
Cash flow
-7.9%
Cash-on-Cash Return
3.9%
Cap rate
0.8%
Rent to Value Ratio
Active
$93,000
1
bds
|
1
ba
|
836
sqft
|
built
1978
9707 Richmond Ave, Houston, TX 77042
$-96
Cash flow
-5.4%
Cash-on-Cash Return
4.4%
Cap rate
1.2%
Rent to Value Ratio
Active
$289,000
4
bds
|
3
ba
|
2,815
sqft
|
built
1972
17618 Tall Cypress Dr, Spring, TX 77388
$-152
Cash flow
-2.7%
Cash-on-Cash Return
5.0%
Cap rate
0.9%
Rent to Value Ratio
Active
$199,000
4
bds
|
2
ba
|
1,117
sqft
|
built
1950
3406 Gano St, Houston, TX 77009
$201
Cash flow
5.3%
Cash-on-Cash Return
6.9%
Cap rate
1.1%
Rent to Value Ratio

Active
$260,000
3
bds
|
2
ba
|
1,720
sqft
|
built
1980
19702 Franz Rd, Houston, TX 77084
$-350
Cash flow
-7.0%
Cash-on-Cash Return
4.1%
Cap rate
0.8%
Rent to Value Ratio
Active
$150,000
3
bds
|
2
ba
|
1,092
sqft
|
built
1974
11011 Burningbush Ln, Houston, TX 77016
$104
Cash flow
3.6%
Cash-on-Cash Return
6.5%
Cap rate
1.1%
Rent to Value Ratio
Active
$113,490
1
bds
|
1
ba
|
848
sqft
|
built
1969
2100 Tanglewilde St, Houston, TX 77063
$-212
Cash flow
-9.7%
Cash-on-Cash Return
3.4%
Cap rate
1.2%
Rent to Value Ratio
Active
$275,000
4
bds
|
3
ba
|
2,680
sqft
|
built
1971
1607 Castlerock Dr, Houston, TX 77090
$-195
Cash flow
-3.7%
Cash-on-Cash Return
4.8%
Cap rate
0.8%
Rent to Value Ratio

Active
$253,000
3
bds
|
3
ba
|
2,080
sqft
|
built
2014
16547 Mandate Dr, Houston, TX 77049
$-184
Cash flow
-3.8%
Cash-on-Cash Return
4.8%
Cap rate
0.9%
Rent to Value Ratio

Active
$179,000
4
bds
|
1
ba
|
1,387
sqft
|
built
1955
203 Spell St, Houston, TX 77022
$-106
Cash flow
-3.1%
Cash-on-Cash Return
5.0%
Cap rate
0.9%
Rent to Value Ratio
Active
$78,000
2
bds
|
2
ba
|
1,075
sqft
|
built
1978
17331 Red Oak Dr, Houston, TX 77090
$81
Cash flow
5.4%
Cash-on-Cash Return
6.9%
Cap rate
1.7%
Rent to Value Ratio

Active
$92,000
1
bds
|
1
ba
|
744
sqft
|
built
1960
2601 Bellefontaine St, Houston, TX 77025
$-202
Cash flow
-11.5%
Cash-on-Cash Return
3.0%
Cap rate
1.3%
Rent to Value Ratio

Active
$230,000
4
bds
|
2
ba
|
1,405
sqft
|
built
1965
6102 Mc Kinstry Blvd, Houston, TX 77085
$64
Cash flow
1.5%
Cash-on-Cash Return
6.0%
Cap rate
1.0%
Rent to Value Ratio
Active
$199,000
3
bds
|
2
ba
|
1,415
sqft
|
built
1973
727 Doncrest St, Channelview, TX 77530
$-231
Cash flow
-6.1%
Cash-on-Cash Return
4.3%
Cap rate
0.8%
Rent to Value Ratio
Active
$399,999
3
bds
|
2
ba
|
2,068
sqft
|
built
2021
7202 Cordgrass Prairie Ln, Katy, TX 77493
$-1,053
Cash flow
-13.7%
Cash-on-Cash Return
2.5%
Cap rate
0.7%
Rent to Value Ratio
Active
$925,000
5
bds
|
5
ba
|
5,484
sqft
|
built
2006
7826 Camden Hollow Ln, Humble, TX 77396
$-3,030
Cash flow
-17.1%
Cash-on-Cash Return
1.7%
Cap rate
0.5%
Rent to Value Ratio