Harris County Investment Properties for Sale
Browse homes for sale and investment properties in Harris County. Refine your search by price, property type, or more.
Best cash flowing properties in Harris County
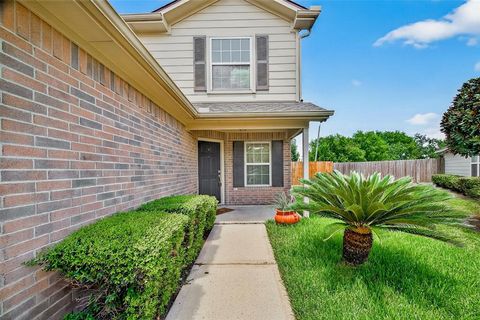
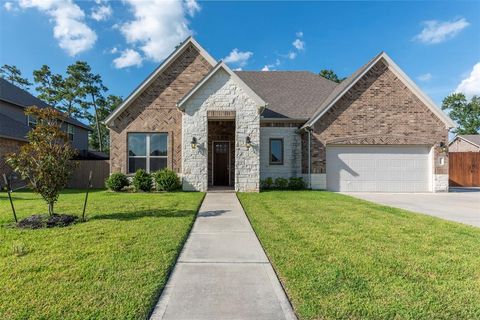
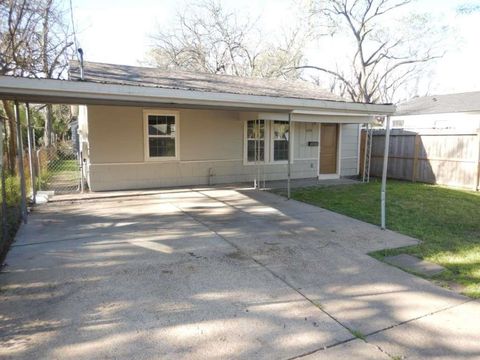
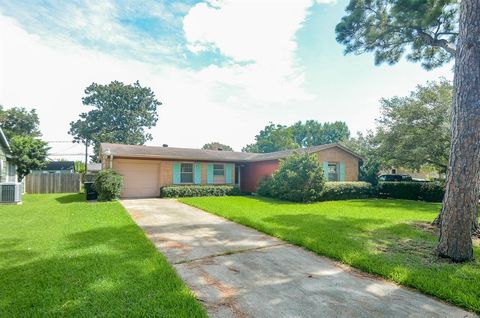
Active
$255,000
4
bds
|
3
ba
|
1,778
sqft
|
built
2005
827 Heatherton Hill Ln, Houston, TX 77047
$-386
Cash flow
-7.9%
Cash-on-Cash Return
3.9%
Cap rate
0.8%
Rent to Value Ratio
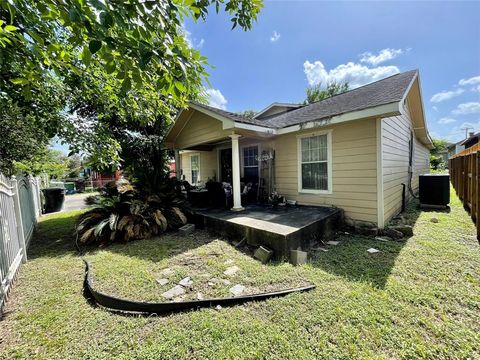
Active
$259,000
3
bds
|
2
ba
|
1,704
sqft
|
built
1930
1107 Wooding St, Houston, TX 77011
$-389
Cash flow
-7.8%
Cash-on-Cash Return
3.9%
Cap rate
0.7%
Rent to Value Ratio
7,390 out of 7,971 properties for sale in Harris County
Limited Results Shown
Create a free account, or log in to reveal all property listings and enjoy the complete experience.

Active
$359,900
4
bds
|
2
ba
|
2,303
sqft
|
built
1996
3143 W Hampton Dr, Houston, TX 77082
$-569
Cash flow
-8.2%
Cash-on-Cash Return
3.8%
Cap rate
0.7%
Rent to Value Ratio
Active
$389,900
4
bds
|
3
ba
|
2,578
sqft
|
built
1988
14519 Hillside Hickory Ct, Houston, TX 77062
$-663
Cash flow
-8.9%
Cash-on-Cash Return
3.6%
Cap rate
0.7%
Rent to Value Ratio
Active
$259,992
2
bds
|
2
ba
|
1,175
sqft
|
built
2014
242 Lenox St, Houston, TX 77011
$-589
Cash flow
-11.8%
Cash-on-Cash Return
3.0%
Cap rate
0.7%
Rent to Value Ratio
Active
$549,000
4
bds
|
4
ba
|
3,027
sqft
|
built
2021
18006 Ponte Vecchio Way, Houston, TX 77044
$-1,505
Cash flow
-14.3%
Cash-on-Cash Return
2.4%
Cap rate
0.6%
Rent to Value Ratio

Active
$3,400,000
6
bds
|
9
ba
|
10,321
sqft
|
built
1980
11305 Green Vale Dr, Houston, TX 77024
$-17,249
Cash flow
-26.5%
Cash-on-Cash Return
-0.4%
Cap rate
0.1%
Rent to Value Ratio

Active
$269,900
3
bds
|
2
ba
|
1,882
sqft
|
built
1978
6211 Linnhaven Dr, Houston, TX 77072
$-430
Cash flow
-8.3%
Cash-on-Cash Return
3.8%
Cap rate
0.7%
Rent to Value Ratio

Active
$580,000
5
bds
|
5
ba
|
3,312
sqft
|
built
1970
11021 Hayslip Ln, Houston, TX 77041
$-2,011
Cash flow
-18.1%
Cash-on-Cash Return
1.5%
Cap rate
0.3%
Rent to Value Ratio
Active
$305,000
3
bds
|
3
ba
|
1,831
sqft
|
built
2007
5311 Avenue J, Houston, TX 77011
$-534
Cash flow
-9.1%
Cash-on-Cash Return
3.6%
Cap rate
0.8%
Rent to Value Ratio
Active
$305,000
4
bds
|
3
ba
|
2,106
sqft
|
built
2004
7907 Beech Park Ln, Houston, TX 77083
$-560
Cash flow
-9.6%
Cash-on-Cash Return
3.5%
Cap rate
0.8%
Rent to Value Ratio
Active
$589,900
3
bds
|
2
ba
|
1,818
sqft
|
built
1962
1822 Tattenhall Dr, Houston, TX 77008
$-1,433
Cash flow
-12.7%
Cash-on-Cash Return
2.8%
Cap rate
0.5%
Rent to Value Ratio

Active
$290,000
3
bds
|
3
ba
|
2,012
sqft
|
built
2007
53 Versante Ct, Houston, TX 77070
$-788
Cash flow
-14.2%
Cash-on-Cash Return
2.4%
Cap rate
0.8%
Rent to Value Ratio
Active
$229,499
2
bds
|
1
ba
|
720
sqft
|
built
1938
4218 Buck St, Houston, TX 77020
$-412
Cash flow
-9.4%
Cash-on-Cash Return
3.5%
Cap rate
0.6%
Rent to Value Ratio

Active
$370,000
2
bds
|
2
ba
|
1,814
sqft
|
built
1998
1410 Tuam St, Houston, TX 77004
$-753
Cash flow
-10.6%
Cash-on-Cash Return
3.2%
Cap rate
0.7%
Rent to Value Ratio

Active
$2,550,000
5
bds
|
8
ba
|
6,438
sqft
|
built
1995
8614 Pasture View Ln, Houston, TX 77024
$-11,951
Cash flow
-24.5%
Cash-on-Cash Return
0.1%
Cap rate
0.3%
Rent to Value Ratio

Active
$254,500
3
bds
|
2
ba
|
1,856
sqft
|
built
1991
7955 Fawn Terrace Dr, Houston, TX 77071
$-446
Cash flow
-9.1%
Cash-on-Cash Return
3.6%
Cap rate
0.7%
Rent to Value Ratio

Active
$420,000
3
bds
|
4
ba
|
2,088
sqft
|
built
2012
1205 Summer St, Houston, TX 77007
$-410
Cash flow
-5.1%
Cash-on-Cash Return
4.5%
Cap rate
0.8%
Rent to Value Ratio

Active
$525,000
6
bds
|
2
ba
|
2,753
sqft
|
built
1950
7311 Roswell St, Houston, TX 77022
$-1,706
Cash flow
-17.0%
Cash-on-Cash Return
1.8%
Cap rate
0.4%
Rent to Value Ratio
Active
$524,964
3
bds
|
4
ba
|
2,134
sqft
|
built
2020
954 Fisher St, Houston, TX 77018
$-1,079
Cash flow
-10.7%
Cash-on-Cash Return
3.2%
Cap rate
0.6%
Rent to Value Ratio
Active
$435,000
5
bds
|
3
ba
|
3,600
sqft
|
built
1971
10606 Bucknell Rd, Houston, TX 77016
$-1,417
Cash flow
-17.0%
Cash-on-Cash Return
1.8%
Cap rate
0.4%
Rent to Value Ratio
Active
$299,900
3
bds
|
2
ba
|
1,672
sqft
|
built
1960
515 Maple Way, Houston, TX 77015
$-710
Cash flow
-12.4%
Cash-on-Cash Return
2.8%
Cap rate
0.6%
Rent to Value Ratio

Active
$729,000
3
bds
|
4
ba
|
2,800
sqft
|
built
2015
803 Willard St, Houston, TX 77006
$-892
Cash flow
-6.4%
Cash-on-Cash Return
4.2%
Cap rate
0.8%
Rent to Value Ratio

Active
$364,900
3
bds
|
3
ba
|
2,197
sqft
|
built
1979
10018 Sageorchard Ln, Houston, TX 77089
$-692
Cash flow
-9.9%
Cash-on-Cash Return
3.4%
Cap rate
0.6%
Rent to Value Ratio
Active
$289,000
4
bds
|
2
ba
|
1,824
sqft
|
built
1957
8515 Glenbrae St, Houston, TX 77061
$-397
Cash flow
-7.2%
Cash-on-Cash Return
4.0%
Cap rate
0.7%
Rent to Value Ratio

Active
$599,999
3
bds
|
3
ba
|
2,865
sqft
|
built
1955
9309 Saddle Ln, Houston, TX 77080
$-1,326
Cash flow
-11.5%
Cash-on-Cash Return
3.0%
Cap rate
0.5%
Rent to Value Ratio
Active
$340,000
3
bds
|
1
ba
|
1,372
sqft
|
built
1930
5221 Mulford St, Houston, TX 77023
$-672
Cash flow
-10.3%
Cash-on-Cash Return
3.3%
Cap rate
0.6%
Rent to Value Ratio

Active
$1,500,000
3
bds
|
3
ba
|
3,318
sqft
|
built
2005
945 Waverly St, Houston, TX 77008
$-5,296
Cash flow
-18.4%
Cash-on-Cash Return
1.4%
Cap rate
0.4%
Rent to Value Ratio

Active
$295,000
3
bds
|
3
ba
|
2,302
sqft
|
built
2005
7219 Hazel Creek Cir, Houston, TX 77095
$-479
Cash flow
-8.5%
Cash-on-Cash Return
3.7%
Cap rate
0.8%
Rent to Value Ratio

Active
$750,000
4
bds
|
4
ba
|
3,287
sqft
|
built
1998
911 Chisel Point Dr, Houston, TX 77094
$-2,128
Cash flow
-14.8%
Cash-on-Cash Return
2.3%
Cap rate
0.5%
Rent to Value Ratio
Active
$290,000
4
bds
|
3
ba
|
2,226
sqft
|
built
2014
13831 Roman Ridge Ln, Houston, TX 77047
$-519
Cash flow
-9.3%
Cash-on-Cash Return
3.5%
Cap rate
0.7%
Rent to Value Ratio

Active
$415,000
5
bds
|
4
ba
|
2,873
sqft
|
built
1980
11826 Oakcroft Dr, Houston, TX 77070
$-817
Cash flow
-10.3%
Cash-on-Cash Return
3.3%
Cap rate
0.6%
Rent to Value Ratio
Active
$399,000
3
bds
|
2
ba
|
2,177
sqft
|
built
1963
5507 Valkeith Dr, Houston, TX 77096
$-753
Cash flow
-9.8%
Cash-on-Cash Return
3.4%
Cap rate
0.7%
Rent to Value Ratio

Active
$169,500
2
bds
|
2
ba
|
1,090
sqft
|
built
1983
2333 Bering Dr, Houston, TX 77057
$-448
Cash flow
-13.8%
Cash-on-Cash Return
2.5%
Cap rate
0.9%
Rent to Value Ratio

Active
$355,000
4
bds
|
3
ba
|
3,040
sqft
|
built
2004
9942 Lynette Falls Dr, Houston, TX 77095
$-555
Cash flow
-8.2%
Cash-on-Cash Return
3.8%
Cap rate
0.7%
Rent to Value Ratio

Active
$325,000
4
bds
|
2
ba
|
1,537
sqft
|
built
1965
9418 Beverlyhill St, Houston, TX 77063
$-458
Cash flow
-7.4%
Cash-on-Cash Return
4.0%
Cap rate
0.7%
Rent to Value Ratio

Active
$420,000
5
bds
|
4
ba
|
2,690
sqft
|
built
2014
8119 Oat Meadow Trl, Houston, TX 77049
$-1,138
Cash flow
-14.1%
Cash-on-Cash Return
2.4%
Cap rate
0.6%
Rent to Value Ratio
Active
$2,250,000
4
bds
|
2
ba
|
2,962
sqft
|
built
1955
750 E Creekside Dr, Houston, TX 77024
$-9,221
Cash flow
-21.4%
Cash-on-Cash Return
0.8%
Cap rate
0.2%
Rent to Value Ratio

Active
$280,000
3
bds
|
2
ba
|
1,958
sqft
|
built
1975
9806 Sagebark Dr, Houston, TX 77089
$-470
Cash flow
-8.8%
Cash-on-Cash Return
3.7%
Cap rate
0.7%
Rent to Value Ratio

Active
$489,000
3
bds
|
4
ba
|
2,297
sqft
|
built
2015
911 W 19th St, Houston, TX 77008
$-916
Cash flow
-9.8%
Cash-on-Cash Return
3.4%
Cap rate
0.7%
Rent to Value Ratio