Harris County Investment Properties for Sale
Browse homes for sale and investment properties in Harris County. Refine your search by price, property type, or more.
Best cash flowing properties in Harris County

Active
$249,900
3
bds
|
2
ba
|
1,715
sqft
|
built
1981
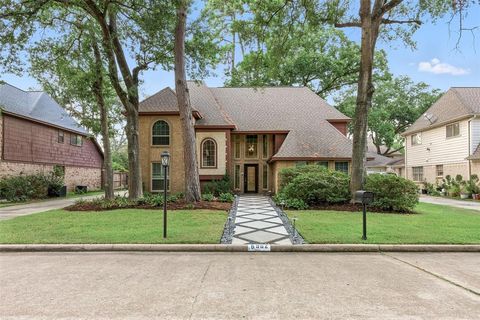
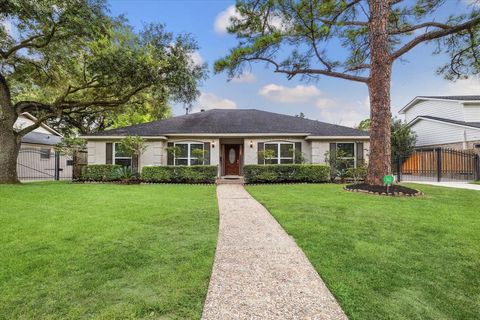
3843 Vineyard Dr, Houston, TX 77082
$-378
Cash flow
-7.9%
Cash-on-Cash Return
3.9%
Cap rate
0.7%
Rent to Value Ratio

Active
$315,000
4
bds
|
3
ba
|
2,256
sqft
|
built
1970
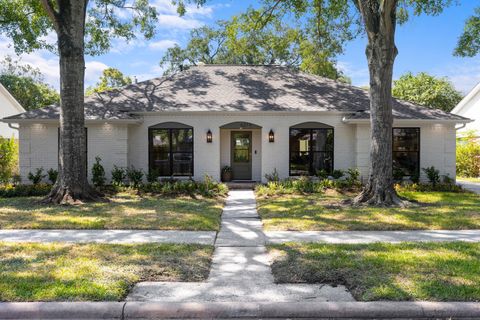
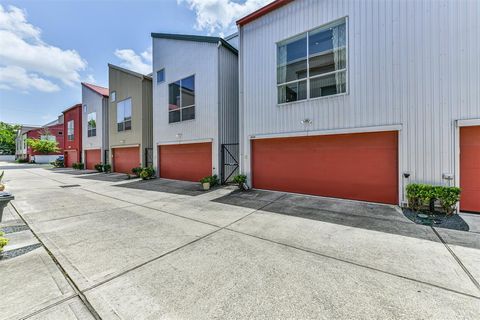
6307 Francis Marion Dr, Houston, TX 77091
$-396
Cash flow
-6.6%
Cash-on-Cash Return
4.2%
Cap rate
0.8%
Rent to Value Ratio
8,592 out of 9,139 properties for sale in Harris County
Limited Results Shown
Create a free account, or log in to reveal all property listings and enjoy the complete experience.

Active
$242,900
2
bds
|
2
ba
|
1,497
sqft
|
built
1983
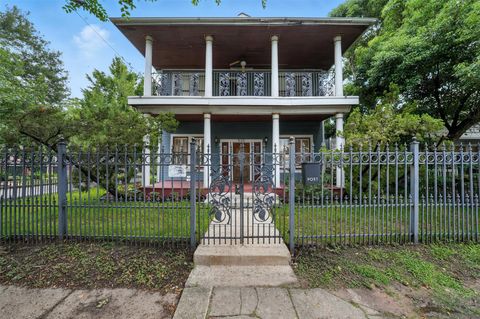
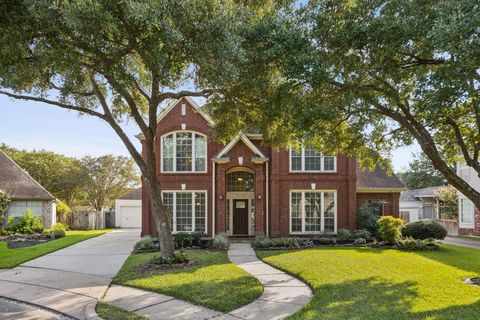
14655 Champion Forest Dr, Houston, TX 77069
$-1,307
Cash flow
-28.1%
Cash-on-Cash Return
-0.8%
Cap rate
0.7%
Rent to Value Ratio

Active
$310,000
3
bds
|
3
ba
|
2,209
sqft
|
built
2018
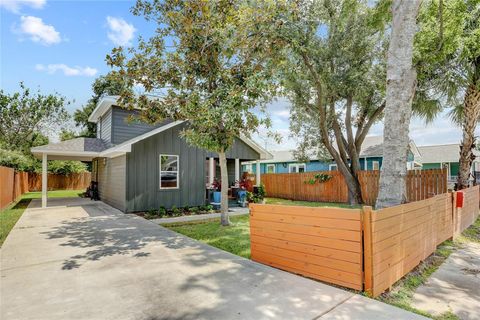
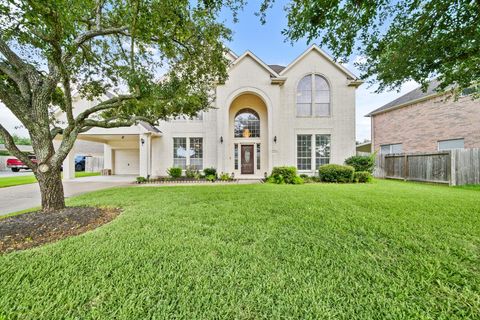
13067 Mills Creek Meadow Dr, Houston, TX 77070
$-504
Cash flow
-8.5%
Cash-on-Cash Return
3.7%
Cap rate
0.7%
Rent to Value Ratio
Active
$300,000
3
bds
|
2
ba
|
1,584
sqft
|
built
1973
11406 Montverde Ln, Houston, TX 77099
$-624
Cash flow
-10.9%
Cash-on-Cash Return
3.2%
Cap rate
0.6%
Rent to Value Ratio
Active
$655,000
4
bds
|
3
ba
|
2,244
sqft
|
built
1970
2418 Lexford Ln, Houston, TX 77080
$-1,952
Cash flow
-15.5%
Cash-on-Cash Return
2.1%
Cap rate
0.4%
Rent to Value Ratio

Active
$629,000
4
bds
|
4
ba
|
2,655
sqft
|
built
2017
1513 Isabella St, Houston, TX 77004
$-942
Cash flow
-7.8%
Cash-on-Cash Return
3.9%
Cap rate
0.7%
Rent to Value Ratio
Active
$565,000
4
bds
|
4
ba
|
3,377
sqft
|
built
1950
418 Eleanor St, Houston, TX 77009
$-2,034
Cash flow
-18.8%
Cash-on-Cash Return
1.4%
Cap rate
0.4%
Rent to Value Ratio
Active
$525,000
4
bds
|
3
ba
|
2,512
sqft
|
built
1977
3002 Durban Dr, Houston, TX 77043
$-1,062
Cash flow
-10.6%
Cash-on-Cash Return
3.3%
Cap rate
0.7%
Rent to Value Ratio

Active
$168,000
1
bds
|
1
ba
|
910
sqft
|
built
1967
5050 Ambassador Way, Houston, TX 77056
$-799
Cash flow
-24.8%
Cash-on-Cash Return
0.0%
Cap rate
1.0%
Rent to Value Ratio

Active
$205,000
2
bds
|
2
ba
|
1,259
sqft
|
built
1970
361 N Post Oak Ln, Houston, TX 77024
$-546
Cash flow
-13.9%
Cash-on-Cash Return
2.5%
Cap rate
1.1%
Rent to Value Ratio
Active
$380,000
4
bds
|
4
ba
|
3,235
sqft
|
built
1983
6902 Mossridge Dr, Houston, TX 77069
$-492
Cash flow
-6.8%
Cash-on-Cash Return
4.1%
Cap rate
0.7%
Rent to Value Ratio

Active
$195,000
2
bds
|
2
ba
|
1,399
sqft
|
built
1983
2255 Braeswood Park Dr, Houston, TX 77030
$-747
Cash flow
-20.0%
Cash-on-Cash Return
1.1%
Cap rate
0.8%
Rent to Value Ratio
Active
$655,000
4
bds
|
2
ba
|
2,499
sqft
|
built
1965
6219 Bayou Bridge Dr, Houston, TX 77096
$-1,987
Cash flow
-15.8%
Cash-on-Cash Return
2.0%
Cap rate
0.4%
Rent to Value Ratio

Active
$430,000
4
bds
|
2
ba
|
2,519
sqft
|
built
2015
1119 Twin Falls Rd, Houston, TX 77088
$-882
Cash flow
-10.7%
Cash-on-Cash Return
3.2%
Cap rate
0.6%
Rent to Value Ratio
Active
$850,000
5
bds
|
4
ba
|
2,712
sqft
|
built
1926
525 Teetshorn St, Houston, TX 77009
$-2,354
Cash flow
-14.4%
Cash-on-Cash Return
2.4%
Cap rate
0.6%
Rent to Value Ratio

Active
$589,000
2
bds
|
1
ba
|
4,378
sqft
|
built
1920
1308 Hughes St, Houston, TX 77023
$-2,242
Cash flow
-19.9%
Cash-on-Cash Return
1.1%
Cap rate
0.2%
Rent to Value Ratio

Active
$383,000
4
bds
|
3
ba
|
2,837
sqft
|
built
2015
13409 Clayton Lake Ln, Houston, TX 77044
$-1,026
Cash flow
-14.0%
Cash-on-Cash Return
2.5%
Cap rate
0.7%
Rent to Value Ratio
Active
$589,000
4
bds
|
3
ba
|
1,434
sqft
|
built
1920
1006 Archer St, Houston, TX 77009
$-2,223
Cash flow
-19.7%
Cash-on-Cash Return
1.1%
Cap rate
0.4%
Rent to Value Ratio

Active
$1,499,000
4
bds
|
5
ba
|
4,780
sqft
|
built
2018
6114 Rolling Water Dr, Houston, TX 77069
$-2,213
Cash flow
-7.7%
Cash-on-Cash Return
3.9%
Cap rate
0.5%
Rent to Value Ratio
Active
$795,000
4
bds
|
3
ba
|
2,303
sqft
|
built
1973
10211 Olympia Dr, Houston, TX 77042
$-458
Cash flow
-3.0%
Cash-on-Cash Return
5.0%
Cap rate
0.8%
Rent to Value Ratio

Active
$385,000
3
bds
|
2
ba
|
1,424
sqft
|
built
1952
3028 Winslow St, Houston, TX 77025
$-745
Cash flow
-10.1%
Cash-on-Cash Return
3.4%
Cap rate
0.6%
Rent to Value Ratio

Active
$499,995
5
bds
|
4
ba
|
2,546
sqft
|
built
2018
11012 Avenu Malkenu Ave, Houston, TX 77043
$-689
Cash flow
-7.2%
Cash-on-Cash Return
4.0%
Cap rate
0.8%
Rent to Value Ratio

Active
$323,009
3
bds
|
2
ba
|
1,725
sqft
|
built
2002
10106 Hollyvine Ln, Houston, TX 77089
$-658
Cash flow
-10.6%
Cash-on-Cash Return
3.2%
Cap rate
0.6%
Rent to Value Ratio
Active
$365,000
2
bds
|
2
ba
|
2,020
sqft
|
built
2012
3028 Commerce St, Houston, TX 77003
$-704
Cash flow
-10.1%
Cash-on-Cash Return
3.4%
Cap rate
0.7%
Rent to Value Ratio

Active
$350,000
4
bds
|
3
ba
|
3,068
sqft
|
built
2016
15614 S Early Dusk Cir, Houston, TX 77044
$-837
Cash flow
-12.5%
Cash-on-Cash Return
2.8%
Cap rate
0.7%
Rent to Value Ratio
Active
$400,000
4
bds
|
4
ba
|
3,327
sqft
|
built
1992
13910 Inland Spring Ct, Houston, TX 77059
$-618
Cash flow
-8.1%
Cash-on-Cash Return
3.8%
Cap rate
0.8%
Rent to Value Ratio

Active
$585,000
3
bds
|
4
ba
|
2,417
sqft
|
built
2022
10971 Swang Link Dr, Houston, TX 77043
$-1,698
Cash flow
-15.1%
Cash-on-Cash Return
2.2%
Cap rate
0.5%
Rent to Value Ratio

Active
$280,000
3
bds
|
3
ba
|
1,714
sqft
|
built
2015
3710 Main Aspen Dr, Houston, TX 77025
$-596
Cash flow
-11.1%
Cash-on-Cash Return
3.1%
Cap rate
0.8%
Rent to Value Ratio

Active
$3,499,000
4
bds
|
6
ba
|
6,409
sqft
|
built
2001
26 Hedwig Cir, Houston, TX 77024
$-15,748
Cash flow
-23.5%
Cash-on-Cash Return
0.3%
Cap rate
0.2%
Rent to Value Ratio

Active
$415,000
2
bds
|
2
ba
|
1,635
sqft
|
built
2005
1320 Studer St, Houston, TX 77007
$-885
Cash flow
-11.1%
Cash-on-Cash Return
3.1%
Cap rate
0.7%
Rent to Value Ratio

Active
$490,000
3
bds
|
4
ba
|
1,966
sqft
|
built
2021
2714 Nagle St, Houston, TX 77004
$-1,107
Cash flow
-11.8%
Cash-on-Cash Return
3.0%
Cap rate
0.6%
Rent to Value Ratio
Active
$515,000
4
bds
|
4
ba
|
4,313
sqft
|
built
2002
10111 Elizabeth Rose Dr, Houston, TX 77089
$-1,166
Cash flow
-11.8%
Cash-on-Cash Return
3.0%
Cap rate
0.6%
Rent to Value Ratio
Active
$365,000
4
bds
|
3
ba
|
2,368
sqft
|
built
1987
10410 Dude Rd, Houston, TX 77064
$-710
Cash flow
-10.1%
Cash-on-Cash Return
3.3%
Cap rate
0.6%
Rent to Value Ratio
Active
$158,000
2
bds
|
2
ba
|
1,155
sqft
|
built
1983
2277 S Kirkwood Rd, Houston, TX 77077
$-420
Cash flow
-13.9%
Cash-on-Cash Return
2.5%
Cap rate
0.9%
Rent to Value Ratio
Active
$310,000
3
bds
|
3
ba
|
2,259
sqft
|
built
2006
1122 Glenwood Canyon Ln, Houston, TX 77077
$-766
Cash flow
-12.9%
Cash-on-Cash Return
2.7%
Cap rate
0.8%
Rent to Value Ratio

Active
$359,900
2
bds
|
2
ba
|
1,254
sqft
|
built
1960
5242 Memorial Dr, Houston, TX 77007
$-1,224
Cash flow
-17.7%
Cash-on-Cash Return
1.6%
Cap rate
0.7%
Rent to Value Ratio
Active
$285,000
4
bds
|
3
ba
|
2,763
sqft
|
built
2001
21039 Vista Trail Ct, Houston, TX 77073
$-405
Cash flow
-7.4%
Cash-on-Cash Return
4.0%
Cap rate
0.8%
Rent to Value Ratio

Active
$479,500
4
bds
|
3
ba
|
2,533
sqft
|
built
2013
31923 Cary Douglas Dr, Hockley, TX 77447
$-1,355
Cash flow
-14.7%
Cash-on-Cash Return
2.3%
Cap rate
0.6%
Rent to Value Ratio
Active
$1,780,000
3
bds
|
4
ba
|
2,904
sqft
|
built
2018
4521 San Felipe St, Houston, TX 77027
$-5,092
Cash flow
-14.9%
Cash-on-Cash Return
2.2%
Cap rate
0.6%
Rent to Value Ratio