Harris County Investment Properties for Sale
Browse homes for sale and investment properties in Harris County. Refine your search by price, property type, or more.
Best cash flowing properties in Harris County
Active
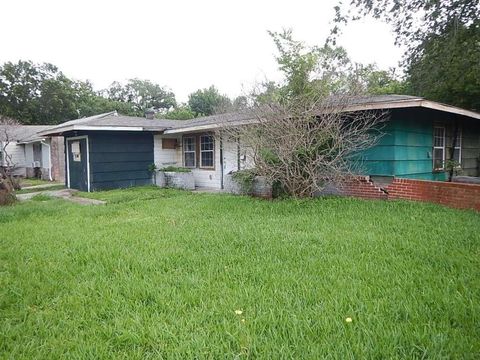
$189,999
3
bds
|
1
ba
|
1,625
sqft
|
built
1951
5251 Perry St, Houston, TX 77021
$90
Cash flow
2.5%
Cash-on-Cash Return
6.2%
Cap rate
0.9%
Rent to Value Ratio

Active
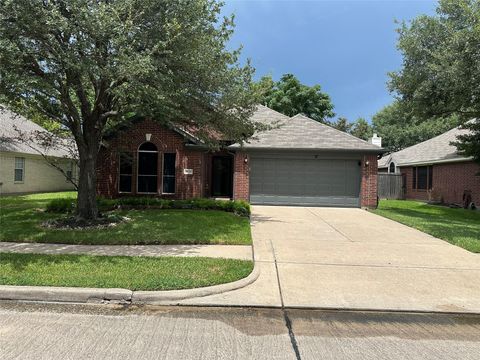
$219,900
3
bds
|
3
ba
|
1,683
sqft
|
built
2004
14319 Mirkwood Ln, Houston, TX 77014
$-369
Cash flow
-8.8%
Cash-on-Cash Return
3.7%
Cap rate
0.8%
Rent to Value Ratio
7,390 out of 7,971 properties for sale in Harris County
Limited Results Shown
Create a free account, or log in to reveal all property listings and enjoy the complete experience.
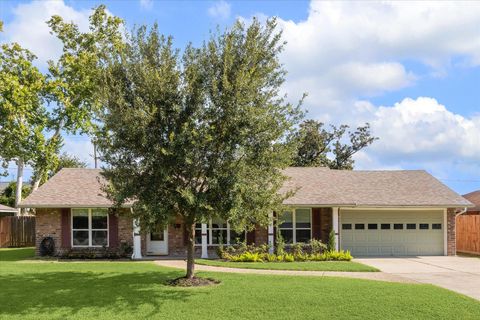
Active
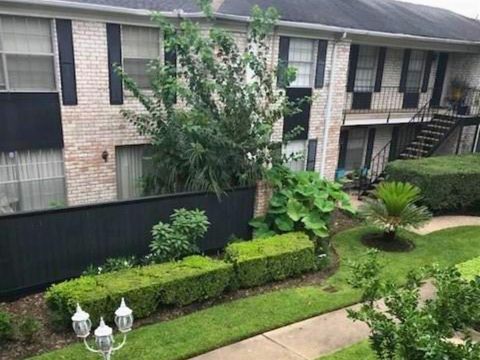
$329,000
3
bds
|
2
ba
|
1,846
sqft
|
built
1997
9126 Bearcove Cir, Houston, TX 77064
$-648
Cash flow
-10.3%
Cash-on-Cash Return
3.3%
Cap rate
0.6%
Rent to Value Ratio
Active
$145,000
2
bds
|
2
ba
|
1,002
sqft
|
built
1967
7900 Westheimer Rd, Houston, TX 77063
$-418
Cash flow
-15.0%
Cash-on-Cash Return
2.2%
Cap rate
1.0%
Rent to Value Ratio

Active
$275,000
2
bds
|
3
ba
|
1,088
sqft
|
built
1977
2323 Augusta Dr, Houston, TX 77057
$-573
Cash flow
-10.9%
Cash-on-Cash Return
3.2%
Cap rate
0.7%
Rent to Value Ratio
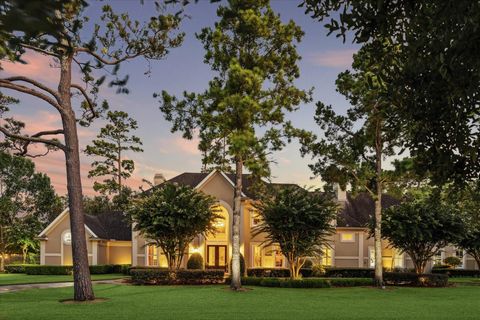
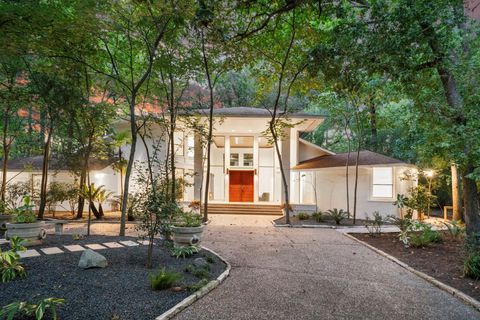
Active
$4,195,000
5
bds
|
7
ba
|
7,114
sqft
|
built
1993
8 Jeffers Ct, Houston, TX 77024
$-19,822
Cash flow
-24.7%
Cash-on-Cash Return
0.0%
Cap rate
0.1%
Rent to Value Ratio

Active
$589,000
2
bds
|
3
ba
|
1,514
sqft
|
built
2003
3333 Allen Pkwy, Houston, TX 77019
$-2,549
Cash flow
-22.6%
Cash-on-Cash Return
0.5%
Cap rate
0.6%
Rent to Value Ratio
Active
$349,000
3
bds
|
2
ba
|
1,553
sqft
|
built
1957
8911 Blankenship Dr, Houston, TX 77080
$-772
Cash flow
-11.5%
Cash-on-Cash Return
3.0%
Cap rate
0.7%
Rent to Value Ratio

Active
$229,000
1
bds
|
1
ba
|
816
sqft
|
built
1993
3231 Allen Pkwy, Houston, TX 77019
$-641
Cash flow
-14.6%
Cash-on-Cash Return
2.3%
Cap rate
0.8%
Rent to Value Ratio

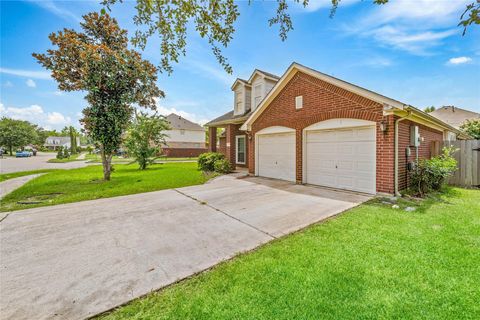
Active
$375,000
3
bds
|
3
ba
|
2,211
sqft
|
built
1997
18507 Mill Path Ct, Houston, TX 77084
$-821
Cash flow
-11.4%
Cash-on-Cash Return
3.1%
Cap rate
0.7%
Rent to Value Ratio
Active
$1,475,000
4
bds
|
5
ba
|
4,349
sqft
|
built
1987
102 Lakeside Oaks Dr, Houston, TX 77042
$-5,450
Cash flow
-19.3%
Cash-on-Cash Return
1.2%
Cap rate
0.3%
Rent to Value Ratio
Active
$320,000
3
bds
|
2
ba
|
1,916
sqft
|
built
2002
10018 San Ignacio, Houston, TX 77075
$-756
Cash flow
-12.3%
Cash-on-Cash Return
2.8%
Cap rate
0.6%
Rent to Value Ratio
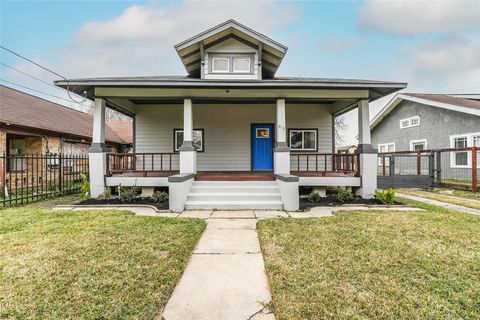
Active
$329,000
2
bds
|
2
ba
|
1,326
sqft
|
built
1935
212 Clifton St, Houston, TX 77011
$-562
Cash flow
-8.9%
Cash-on-Cash Return
3.6%
Cap rate
0.7%
Rent to Value Ratio
Active
$169,000
2
bds
|
2
ba
|
1,014
sqft
|
built
1984
2121 El Paseo St, Houston, TX 77054
$-433
Cash flow
-13.4%
Cash-on-Cash Return
2.6%
Cap rate
0.9%
Rent to Value Ratio
Active
$399,000
4
bds
|
2
ba
|
1,933
sqft
|
built
1955
8713 Timberside Dr, Houston, TX 77025
$-620
Cash flow
-8.1%
Cash-on-Cash Return
3.8%
Cap rate
0.7%
Rent to Value Ratio
Active
$279,000
3
bds
|
3
ba
|
2,313
sqft
|
built
1964
7323 Carew St, Houston, TX 77074
$-422
Cash flow
-7.9%
Cash-on-Cash Return
3.9%
Cap rate
0.7%
Rent to Value Ratio
Active
$229,000
3
bds
|
2
ba
|
1,404
sqft
|
built
1930
7706 Canal St, Houston, TX 77012
$-451
Cash flow
-10.3%
Cash-on-Cash Return
3.3%
Cap rate
0.6%
Rent to Value Ratio
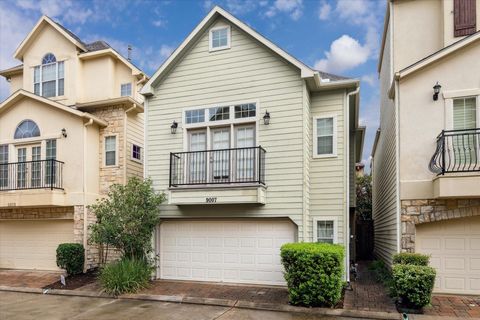
Active
$299,000
2
bds
|
2
ba
|
1,360
sqft
|
built
2005
9007 Harbor Hills Dr, Houston, TX 77054
$-624
Cash flow
-10.9%
Cash-on-Cash Return
3.2%
Cap rate
0.7%
Rent to Value Ratio
Active
$340,000
4
bds
|
3
ba
|
2,336
sqft
|
built
1984
8306 Hot Springs Dr, Houston, TX 77095
$-533
Cash flow
-8.2%
Cash-on-Cash Return
3.8%
Cap rate
0.7%
Rent to Value Ratio
Active
$269,000
3
bds
|
3
ba
|
1,810
sqft
|
built
2017
20710 Hallow Cane Dr, Hockley, TX 77447
$-493
Cash flow
-9.6%
Cash-on-Cash Return
3.5%
Cap rate
0.7%
Rent to Value Ratio
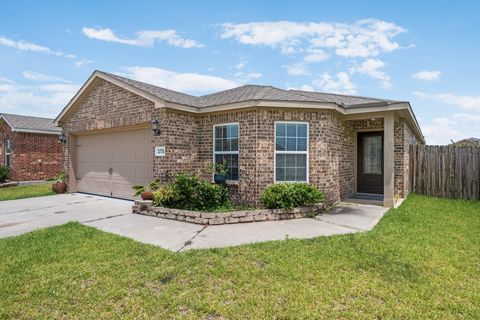
Active
$225,000
3
bds
|
3
ba
|
1,812
sqft
|
built
2006
8002 Montague Manor Ln, Houston, TX 77072
$-449
Cash flow
-10.4%
Cash-on-Cash Return
3.3%
Cap rate
0.8%
Rent to Value Ratio

Active
$139,000
1
bds
|
1
ba
|
995
sqft
|
built
1978
1818 Augusta Dr, Houston, TX 77057
$-505
Cash flow
-19.0%
Cash-on-Cash Return
1.3%
Cap rate
1.0%
Rent to Value Ratio
Active
$205,000
2
bds
|
2
ba
|
1,125
sqft
|
built
1984
1414 Gemini St, Houston, TX 77058
$-510
Cash flow
-13.0%
Cash-on-Cash Return
2.7%
Cap rate
0.8%
Rent to Value Ratio
Active
$2,695,000
4
bds
|
6
ba
|
5,792
sqft
|
built
2017
5228 Chesapeake Way, Houston, TX 77056
$-9,106
Cash flow
-17.6%
Cash-on-Cash Return
1.6%
Cap rate
0.4%
Rent to Value Ratio
Active
$279,900
3
bds
|
2
ba
|
2,046
sqft
|
built
2004
502 Danbury Park Ln, Houston, TX 77073
$-601
Cash flow
-11.2%
Cash-on-Cash Return
3.1%
Cap rate
0.6%
Rent to Value Ratio
Active
$419,488
4
bds
|
3
ba
|
2,575
sqft
|
built
2000
8422 Tavenor Ln, Houston, TX 77075
$-820
Cash flow
-10.2%
Cash-on-Cash Return
3.3%
Cap rate
0.6%
Rent to Value Ratio

Active
$450,000
2
bds
|
1
ba
|
952
sqft
|
built
1936
2616 Beauchamp St, Houston, TX 77009
$-1,143
Cash flow
-13.3%
Cash-on-Cash Return
2.6%
Cap rate
0.6%
Rent to Value Ratio
Active
$550,000
4
bds
|
1
ba
|
1,607
sqft
|
built
1936
1321 De Soto St, Houston, TX 77091
$-1,867
Cash flow
-17.7%
Cash-on-Cash Return
1.6%
Cap rate
0.4%
Rent to Value Ratio
Active
$288,000
3
bds
|
2
ba
|
1,789
sqft
|
built
1998
8747 Cypressbrook Dr, Houston, TX 77095
$-388
Cash flow
-7.0%
Cash-on-Cash Return
4.1%
Cap rate
0.8%
Rent to Value Ratio
Active
$425,000
6
bds
|
5
ba
|
3,324
sqft
|
built
1977
15815 Baytree Dr, Houston, TX 77070
$-827
Cash flow
-10.2%
Cash-on-Cash Return
3.3%
Cap rate
0.6%
Rent to Value Ratio

Active
$1,699,000
4
bds
|
4
ba
|
3,397
sqft
|
built
2018
810 Allston St, Houston, TX 77007
$-5,529
Cash flow
-17.0%
Cash-on-Cash Return
1.8%
Cap rate
0.4%
Rent to Value Ratio
Active
$675,000
5
bds
|
5
ba
|
2,726
sqft
|
built
1976
15123 Lindstrom Rd, Crosby, TX 77532
$-1,759
Cash flow
-13.6%
Cash-on-Cash Return
2.6%
Cap rate
0.4%
Rent to Value Ratio
Active
$625,000
4
bds
|
5
ba
|
4,240
sqft
|
built
2000
14015 Halprin Creek Dr, Cypress, TX 77429
$-1,631
Cash flow
-13.6%
Cash-on-Cash Return
2.5%
Cap rate
0.6%
Rent to Value Ratio
Active
$350,000
3
bds
|
2
ba
|
2,119
sqft
|
built
2016
7423 Cypress Pin Oak Dr, Cypress, TX 77433
$-453
Cash flow
-6.8%
Cash-on-Cash Return
4.1%
Cap rate
0.7%
Rent to Value Ratio
Active
$899,900
5
bds
|
5
ba
|
4,354
sqft
|
built
2017
19003 Kimber Creek Ln, Cypress, TX 77429
$-2,887
Cash flow
-16.7%
Cash-on-Cash Return
1.8%
Cap rate
0.5%
Rent to Value Ratio
Active
$998,000
5
bds
|
6
ba
|
4,274
sqft
|
built
1955
8818 Brae Acres Rd, Houston, TX 77074
$-3,165
Cash flow
-16.5%
Cash-on-Cash Return
1.9%
Cap rate
0.4%
Rent to Value Ratio
Active
$489,900
5
bds
|
5
ba
|
3,157
sqft
|
built
2021
3310 Bellwick Chase Ln, Porter, TX 77365
$-1,104
Cash flow
-11.8%
Cash-on-Cash Return
3.0%
Cap rate
0.7%
Rent to Value Ratio
Active
$559,000
3
bds
|
3
ba
|
2,621
sqft
|
built
1995
13826 Aspen Cove Dr, Houston, TX 77077
$-1,497
Cash flow
-14.0%
Cash-on-Cash Return
2.5%
Cap rate
0.6%
Rent to Value Ratio
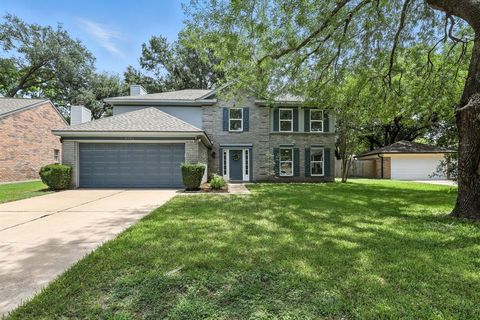
Active
$499,900
4
bds
|
3
ba
|
3,464
sqft
|
built
1991
2119 Country Club Dr, Pearland, TX 77581
$-752
Cash flow
-7.8%
Cash-on-Cash Return
3.9%
Cap rate
0.8%
Rent to Value Ratio
Active
$430,000
3
bds
|
4
ba
|
2,244
sqft
|
built
2008
2106 Holman St, Houston, TX 77004
$-830
Cash flow
-10.1%
Cash-on-Cash Return
3.4%
Cap rate
0.7%
Rent to Value Ratio