Harris County Investment Properties for Sale
Browse homes for sale and investment properties in Harris County. Refine your search by price, property type, or more.
Best cash flowing properties in Harris County
Active
$189,000
3
bds
|
1
ba
|
1,314
sqft
|
built
1950
2926 Wimberly St, Houston, TX 77093
$116
Cash flow
3.2%
Cash-on-Cash Return
6.4%
Cap rate
0.9%
Rent to Value Ratio
Active
$289,000
3
bds
|
3
ba
|
2,056
sqft
|
built
1994
19214 Carpet Bagger Dr, Katy, TX 77449
$42
Cash flow
0.8%
Cash-on-Cash Return
5.9%
Cap rate
0.7%
Rent to Value Ratio
10,000 out of 11,844 properties for sale in Harris County
Limited Results Shown
Create a free account, or log in to reveal all property listings and enjoy the complete experience.

Active
$320,000
4
bds
|
2
ba
|
2,374
sqft
|
built
2004
18018 Secret Branch Ln, Cypress, TX 77433
$-440
Cash flow
-7.2%
Cash-on-Cash Return
4.0%
Cap rate
0.8%
Rent to Value Ratio
Active
$369,000
4
bds
|
3
ba
|
2,580
sqft
|
built
1989
215 Wood Circle Ln, Houston, TX 77015
$-598
Cash flow
-8.5%
Cash-on-Cash Return
3.7%
Cap rate
0.7%
Rent to Value Ratio
Active
$329,900
4
bds
|
3
ba
|
2,595
sqft
|
built
1977
17522 Sorrel Ridge Dr, Spring, TX 77388
$-363
Cash flow
-5.7%
Cash-on-Cash Return
4.4%
Cap rate
0.8%
Rent to Value Ratio
Active
$249,000
4
bds
|
2
ba
|
2,340
sqft
|
built
1980
3710 Fern View Dr, Kingwood, TX 77345
$-324
Cash flow
-6.8%
Cash-on-Cash Return
4.1%
Cap rate
0.8%
Rent to Value Ratio
Active
$369,500
3
bds
|
3
ba
|
2,759
sqft
|
built
1975
12692 Briar Patch Rd, Houston, TX 77077
$-675
Cash flow
-9.5%
Cash-on-Cash Return
3.5%
Cap rate
0.8%
Rent to Value Ratio

Active
$459,000
5
bds
|
3
ba
|
3,063
sqft
|
built
2024
3046 Daw Boardwalk Dr, La Porte, TX 77571
$-1,151
Cash flow
-13.1%
Cash-on-Cash Return
2.7%
Cap rate
0.4%
Rent to Value Ratio
Active
$220,000
3
bds
|
2
ba
|
1,719
sqft
|
built
1982
16414 N Cross Dr, Houston, TX 77073
$-188
Cash flow
-4.5%
Cash-on-Cash Return
4.7%
Cap rate
0.9%
Rent to Value Ratio
Active
$255,000
3
bds
|
2
ba
|
1,268
sqft
|
built
1960
4314 Woodmont Dr, Houston, TX 77045
$-204
Cash flow
-4.2%
Cash-on-Cash Return
4.7%
Cap rate
0.7%
Rent to Value Ratio
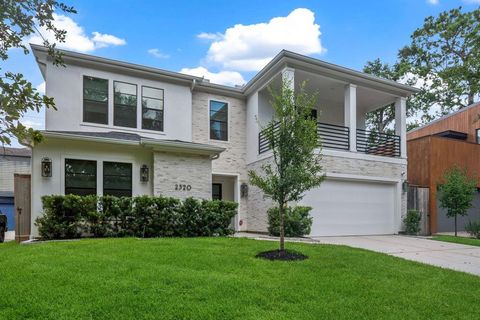
Active
$1,950,000
5
bds
|
5
ba
|
4,617
sqft
|
built
2020
2320 Bartlett St, Houston, TX 77098
$-5,609
Cash flow
-15.0%
Cash-on-Cash Return
2.2%
Cap rate
0.5%
Rent to Value Ratio
Active
$319,000
3
bds
|
2
ba
|
1,123
sqft
|
built
2000
1525 Francis St, Houston, TX 77004
$-562
Cash flow
-9.2%
Cash-on-Cash Return
3.6%
Cap rate
0.7%
Rent to Value Ratio
Active
$499,000
3
bds
|
2
ba
|
1,890
sqft
|
built
1952
3506 Gannett St, Houston, TX 77025
$-1,364
Cash flow
-14.3%
Cash-on-Cash Return
2.4%
Cap rate
0.6%
Rent to Value Ratio
Active
$250,000
3
bds
|
3
ba
|
1,968
sqft
|
built
1995
10323 Emerald Pine Dr, Houston, TX 77070
$-382
Cash flow
-8.0%
Cash-on-Cash Return
3.8%
Cap rate
0.8%
Rent to Value Ratio

Active
$665,000
5
bds
|
3
ba
|
3,200
sqft
|
built
1958
10202 Raritan Dr, Houston, TX 77043
$-2,102
Cash flow
-16.5%
Cash-on-Cash Return
1.9%
Cap rate
0.5%
Rent to Value Ratio
Active
$289,000
4
bds
|
3
ba
|
2,954
sqft
|
built
1978
13623 Sunswept Way, Houston, TX 77082
$-236
Cash flow
-4.3%
Cash-on-Cash Return
4.7%
Cap rate
0.8%
Rent to Value Ratio

Active
$749,000
4
bds
|
4
ba
|
4,069
sqft
|
built
1996
15415 Parkwood Way, Houston, TX 77059
$-1,756
Cash flow
-12.2%
Cash-on-Cash Return
2.9%
Cap rate
0.6%
Rent to Value Ratio
Active
$194,995
3
bds
|
2
ba
|
1,504
sqft
|
built
1973
7822 Pacific Pearl St, Houston, TX 77072
$-219
Cash flow
-5.9%
Cash-on-Cash Return
4.3%
Cap rate
0.9%
Rent to Value Ratio
Active
$789,900
2
bds
|
1
ba
|
1,200
sqft
|
built
1923
1621 California St, Houston, TX 77006
$-3,547
Cash flow
-23.4%
Cash-on-Cash Return
0.3%
Cap rate
0.2%
Rent to Value Ratio
Active
$535,000
4
bds
|
3
ba
|
2,368
sqft
|
built
2020
1813 Arbor St, Houston, TX 77004
$-1,045
Cash flow
-10.2%
Cash-on-Cash Return
3.3%
Cap rate
0.7%
Rent to Value Ratio
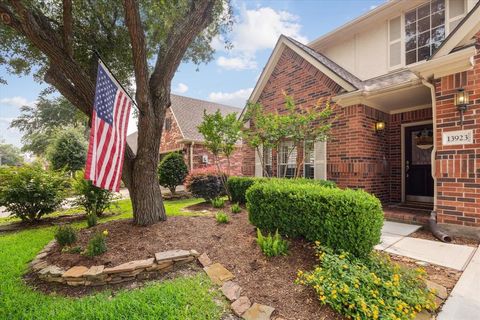
Active
$499,000
4
bds
|
3
ba
|
2,873
sqft
|
built
1995
13923 Roxton Dr, Houston, TX 77077
$-1,110
Cash flow
-11.6%
Cash-on-Cash Return
3.0%
Cap rate
0.6%
Rent to Value Ratio
Active
$299,000
4
bds
|
3
ba
|
3,003
sqft
|
built
1965
3411 Woodcrest Dr, Baytown, TX 77521
$-87
Cash flow
-1.5%
Cash-on-Cash Return
5.3%
Cap rate
0.8%
Rent to Value Ratio
Active
$599,999
3
bds
|
2
ba
|
2,169
sqft
|
built
1973
1238 Del Norte St, Houston, TX 77018
$-1,864
Cash flow
-16.2%
Cash-on-Cash Return
2.0%
Cap rate
0.5%
Rent to Value Ratio
Active
$580,000
4
bds
|
4
ba
|
3,504
sqft
|
built
2000
13423 Oak Alley Ln, Cypress, TX 77429
$-1,524
Cash flow
-13.7%
Cash-on-Cash Return
2.5%
Cap rate
0.6%
Rent to Value Ratio
Active
$385,000
4
bds
|
3
ba
|
2,484
sqft
|
built
1969
6415 Darby Way, Spring, TX 77389
$-912
Cash flow
-12.4%
Cash-on-Cash Return
2.8%
Cap rate
0.7%
Rent to Value Ratio
Active
$450,000
4
bds
|
2
ba
|
1,960
sqft
|
built
1960
5234 Saxon Dr, Houston, TX 77092
$-767
Cash flow
-8.9%
Cash-on-Cash Return
3.6%
Cap rate
0.7%
Rent to Value Ratio
Active
$345,900
3
bds
|
3
ba
|
2,065
sqft
|
built
2013
14550 San Pietro Dr, Houston, TX 77070
$-953
Cash flow
-14.4%
Cash-on-Cash Return
2.4%
Cap rate
0.7%
Rent to Value Ratio
Active
$230,000
4
bds
|
2
ba
|
1,545
sqft
|
built
1984
16307 Thistleglen Dr, Houston, TX 77095
$-376
Cash flow
-8.5%
Cash-on-Cash Return
3.7%
Cap rate
0.8%
Rent to Value Ratio

Active
$469,000
4
bds
|
3
ba
|
2,654
sqft
|
built
2007
1003 Commons Waterway Dr, Huffman, TX 77336
$-937
Cash flow
-10.4%
Cash-on-Cash Return
3.3%
Cap rate
0.6%
Rent to Value Ratio
Active
$313,000
3
bds
|
2
ba
|
1,773
sqft
|
built
1965
18210 Point Lookout Dr, Houston, TX 77058
$-435
Cash flow
-7.3%
Cash-on-Cash Return
4.0%
Cap rate
0.7%
Rent to Value Ratio
Active
$1,099,999
3
bds
|
4
ba
|
3,162
sqft
|
built
1985
3126 Mid Ln, Houston, TX 77027
$-2,678
Cash flow
-12.7%
Cash-on-Cash Return
2.8%
Cap rate
0.5%
Rent to Value Ratio
Active
$629,600
3
bds
|
2
ba
|
2,046
sqft
|
built
1950
1733 Ebony Ln, Houston, TX 77018
$-564
Cash flow
-4.7%
Cash-on-Cash Return
4.6%
Cap rate
0.6%
Rent to Value Ratio
Active
$549,000
4
bds
|
4
ba
|
3,150
sqft
|
built
1996
3206 Shadywind Dr, Houston, TX 77082
$-918
Cash flow
-8.7%
Cash-on-Cash Return
3.7%
Cap rate
0.7%
Rent to Value Ratio
Active
$685,000
4
bds
|
4
ba
|
3,606
sqft
|
built
1979
17507 Deer Creek Dr, Spring, TX 77379
$-728
Cash flow
-5.5%
Cash-on-Cash Return
4.4%
Cap rate
0.7%
Rent to Value Ratio
Active
$428,000
3
bds
|
2
ba
|
1,032
sqft
|
built
1940
5239 Kiam St, Houston, TX 77007
$-965
Cash flow
-11.8%
Cash-on-Cash Return
3.0%
Cap rate
0.6%
Rent to Value Ratio

Active
$948,900
4
bds
|
4
ba
|
3,961
sqft
|
built
2007
4042 Bellefontaine St, Houston, TX 77025
$-2,626
Cash flow
-14.4%
Cash-on-Cash Return
2.4%
Cap rate
0.5%
Rent to Value Ratio
Active
$275,000
3
bds
|
2
ba
|
2,118
sqft
|
built
1976
12626 Scouts Ln, Cypress, TX 77429
$-423
Cash flow
-8.0%
Cash-on-Cash Return
3.8%
Cap rate
0.8%
Rent to Value Ratio
Active
$449,000
3
bds
|
4
ba
|
2,064
sqft
|
built
2011
3610 Chenevert St, Houston, TX 77004
$-124
Cash flow
-1.4%
Cash-on-Cash Return
5.3%
Cap rate
0.6%
Rent to Value Ratio

Active
$526,900
3
bds
|
2
ba
|
1,848
sqft
|
built
2017
212 Greenwood St, Houston, TX 77011
$-1,628
Cash flow
-16.1%
Cash-on-Cash Return
2.0%
Cap rate
0.4%
Rent to Value Ratio
Active
$328,800
4
bds
|
3
ba
|
2,480
sqft
|
built
2013
12818 Regg Dr, Houston, TX 77045
$-423
Cash flow
-6.7%
Cash-on-Cash Return
4.1%
Cap rate
0.8%
Rent to Value Ratio