Hays County Investment Properties for Sale
Browse homes for sale and investment properties in Hays County. Refine your search by price, property type, or more.
Best cash flowing properties in Hays County

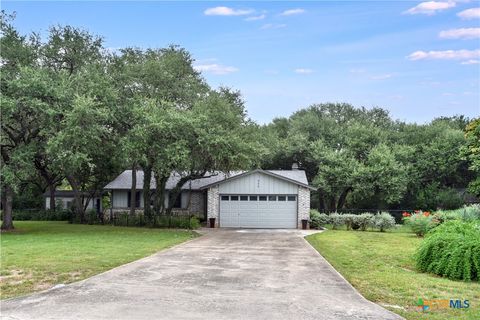
Active
$149,000
3
bds
|
2
ba
|
1,474
sqft
|
built
1975
102 Lockwood St, San Marcos, TX 78666
$125
Cash flow
4.4%
Cash-on-Cash Return
6.7%
Cap rate
1.1%
Rent to Value Ratio
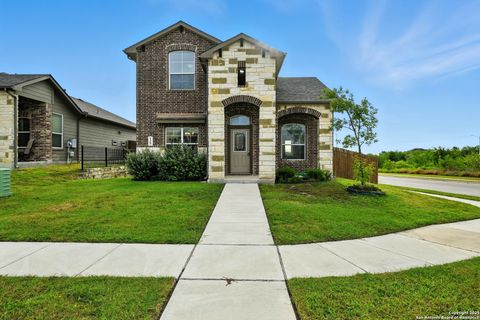
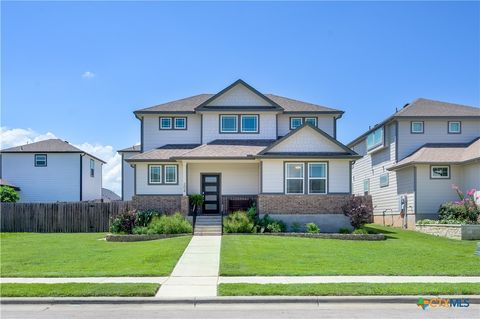
Active
$499,990
4
bds
|
3
ba
|
2,103
sqft
|
built
2025
367 Five Mile Creek Way, Kyle, TX 78640
$0
Cash flow
n/a
Cash-on-Cash Return
n/a
Cap rate
n/a
Rent to Value Ratio
170 out of 738 properties for sale in Hays County
Limited Results Shown
Create a free account, or log in to reveal all property listings and enjoy the complete experience.
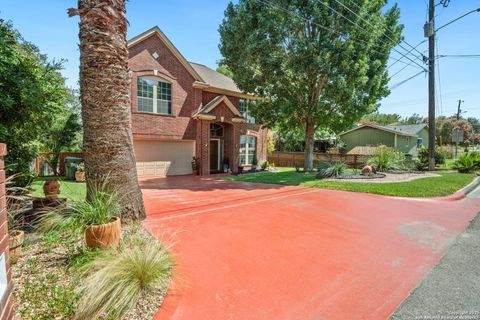
Active
$519,000
2
bds
|
2
ba
|
1,859
sqft
|
built
2022
433 Skipping Cedar St, San Marcos, TX 78666
$-1,392
Cash flow
-14.0%
Cash-on-Cash Return
2.5%
Cap rate
0.5%
Rent to Value Ratio
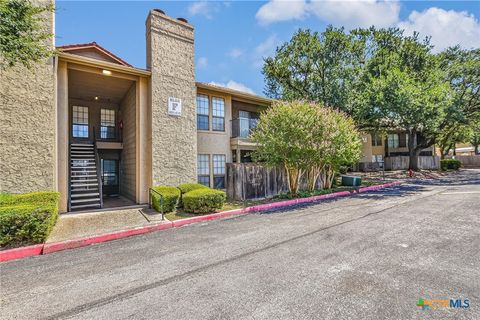
Active
$1,150,000
3
bds
|
3
ba
|
2,613
sqft
|
built
1981
830 Palomino Ln, San Marcos, TX 78666
$-3,693
Cash flow
-16.8%
Cash-on-Cash Return
1.8%
Cap rate
0.4%
Rent to Value Ratio
Active
$469,900
4
bds
|
3
ba
|
2,253
sqft
|
built
2021
244 Heartleaf Rd, San Marcos, TX 78666
$-1,076
Cash flow
-11.9%
Cash-on-Cash Return
2.9%
Cap rate
0.7%
Rent to Value Ratio
Active
$375,000
3
bds
|
2
ba
|
2,204
sqft
|
built
2021
229 Blue Oak Blvd, San Marcos, TX 78666
$-1,008
Cash flow
-14.0%
Cash-on-Cash Return
2.5%
Cap rate
0.6%
Rent to Value Ratio
Active
$589,000
3
bds
|
2
ba
|
1,829
sqft
|
built
1996
124 Turkey Trail Dr, San Marcos, TX 78666
$-1,414
Cash flow
-12.5%
Cash-on-Cash Return
2.8%
Cap rate
0.5%
Rent to Value Ratio
Active
$295,000
3
bds
|
3
ba
|
1,680
sqft
|
built
2006
210 Rush Hvn, San Marcos, TX 78666
$-612
Cash flow
-10.8%
Cash-on-Cash Return
3.2%
Cap rate
0.6%
Rent to Value Ratio
Active
$320,000
3
bds
|
2
ba
|
1,880
sqft
|
built
2006
880 Bottle Brush Dr, Kyle, TX 78640
$-763
Cash flow
-12.4%
Cash-on-Cash Return
2.8%
Cap rate
0.6%
Rent to Value Ratio
Active
$339,000
4
bds
|
2
ba
|
1,938
sqft
|
built
2018
132 Sage Meadows Dr, San Marcos, TX 78666
$-853
Cash flow
-13.1%
Cash-on-Cash Return
2.7%
Cap rate
0.6%
Rent to Value Ratio
Active
$479,000
3
bds
|
2
ba
|
1,855
sqft
|
built
1994
415 Lazy Ln, San Marcos, TX 78666
$-1,117
Cash flow
-12.2%
Cash-on-Cash Return
2.9%
Cap rate
0.5%
Rent to Value Ratio
Active
$255,000
3
bds
|
2
ba
|
1,490
sqft
|
built
2012
115 Encina, San Marcos, TX 78666
$-452
Cash flow
-9.2%
Cash-on-Cash Return
3.6%
Cap rate
0.7%
Rent to Value Ratio
Active
$250,000
3
bds
|
3
ba
|
1,608
sqft
|
built
2009
122 Rush Hvn, San Marcos, TX 78666
$-594
Cash flow
-12.4%
Cash-on-Cash Return
2.8%
Cap rate
0.8%
Rent to Value Ratio
Active
$346,125
3
bds
|
2
ba
|
1,950
sqft
|
built
2013
1019 Powell St, Kyle, TX 78640
$-874
Cash flow
-13.2%
Cash-on-Cash Return
2.6%
Cap rate
0.6%
Rent to Value Ratio
Active
$2,400,000
4
bds
|
4
ba
|
3,569
sqft
|
built
2002
1651 Old Red Ranch Rd, Dripping Springs, TX 78620
$-9,055
Cash flow
-19.7%
Cash-on-Cash Return
1.2%
Cap rate
0.2%
Rent to Value Ratio
Active
$789,000
4
bds
|
3
ba
|
2,780
sqft
|
built
1999
410 Arrowhead Pass, Wimberley, TX 78676
$-2,187
Cash flow
-14.5%
Cash-on-Cash Return
2.4%
Cap rate
0.5%
Rent to Value Ratio
Active
$749,000
3
bds
|
2
ba
|
2,207
sqft
|
built
2009
300 Round Rock Rd, Wimberley, TX 78676
$-1,791
Cash flow
-12.5%
Cash-on-Cash Return
2.8%
Cap rate
0.5%
Rent to Value Ratio
Active
$325,000
4
bds
|
3
ba
|
2,267
sqft
|
built
2020
1021 Adler Way, San Marcos, TX 78666
$-429
Cash flow
-6.9%
Cash-on-Cash Return
4.1%
Cap rate
0.8%
Rent to Value Ratio
Active
$1,599,000
3
bds
|
3
ba
|
2,593
sqft
|
built
1998
2900 Stagecoach Ranch Loop, Dripping Springs, TX 78620
$-6,033
Cash flow
-19.7%
Cash-on-Cash Return
1.2%
Cap rate
0.2%
Rent to Value Ratio
Active
$385,000
3
bds
|
2
ba
|
1,924
sqft
|
built
2015
706 Cavallo Springs Cv, San Marcos, TX 78666
$-1,128
Cash flow
-15.3%
Cash-on-Cash Return
2.2%
Cap rate
0.5%
Rent to Value Ratio
Active
$875,000
4
bds
|
4
ba
|
3,347
sqft
|
built
2018
307 Hazy Hills Loop, Dripping Springs, TX 78620
$-2,840
Cash flow
-16.9%
Cash-on-Cash Return
1.8%
Cap rate
0.5%
Rent to Value Ratio
Active
$474,936
4
bds
|
2
ba
|
1,999
sqft
|
built
1995
127 Maple Dr, Mountain City, TX 78610
$-1,049
Cash flow
-11.5%
Cash-on-Cash Return
3.0%
Cap rate
0.6%
Rent to Value Ratio
Active
$268,000
3
bds
|
3
ba
|
1,486
sqft
|
built
2017
125 Windfield Path, San Marcos, TX 78666
$-573
Cash flow
-11.2%
Cash-on-Cash Return
3.1%
Cap rate
0.6%
Rent to Value Ratio
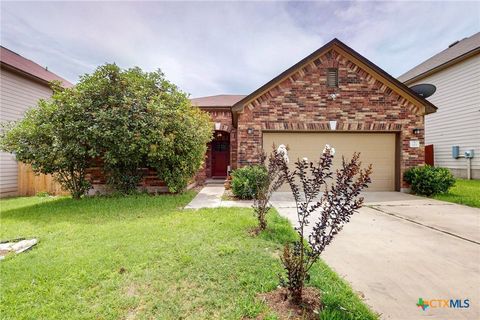
Active
$289,500
4
bds
|
3
ba
|
2,658
sqft
|
built
2001
481 Whispering Hollow Dr, Kyle, TX 78640
$-540
Cash flow
-9.7%
Cash-on-Cash Return
3.4%
Cap rate
0.8%
Rent to Value Ratio
Active
$280,000
3
bds
|
2
ba
|
1,700
sqft
|
built
2013
140 Matthews, Kyle, TX 78640
$-553
Cash flow
-10.3%
Cash-on-Cash Return
3.3%
Cap rate
0.7%
Rent to Value Ratio
Active
$399,500
3
bds
|
2
ba
|
1,531
sqft
|
built
1980
306 Deerwood Dr, San Marcos, TX 78666
$-856
Cash flow
-11.2%
Cash-on-Cash Return
3.1%
Cap rate
0.6%
Rent to Value Ratio
Active
$375,000
3
bds
|
3
ba
|
1,718
sqft
|
built
1995
102 Elm Hill Ct, San Marcos, TX 78666
$-728
Cash flow
-10.1%
Cash-on-Cash Return
3.4%
Cap rate
0.5%
Rent to Value Ratio
Active
$469,000
4
bds
|
3
ba
|
2,538
sqft
|
built
2022
208 Garner Dr, Kyle, TX 78640
$-1,258
Cash flow
-14.0%
Cash-on-Cash Return
2.5%
Cap rate
0.6%
Rent to Value Ratio
Active
$214,900
2
bds
|
2
ba
|
1,036
sqft
|
built
1984
1202 Thorpe Ln, San Marcos, TX 78666
$-769
Cash flow
-18.7%
Cash-on-Cash Return
1.4%
Cap rate
0.7%
Rent to Value Ratio
Active
$600,000
4
bds
|
3
ba
|
2,400
sqft
|
built
2018
450 Peck St, Kyle, TX 78640
$-1,917
Cash flow
-16.7%
Cash-on-Cash Return
1.8%
Cap rate
0.5%
Rent to Value Ratio
Active
$359,900
3
bds
|
2
ba
|
1,753
sqft
|
built
2020
116 Gray Wolf Dr, San Marcos, TX 78666
$-774
Cash flow
-11.2%
Cash-on-Cash Return
3.1%
Cap rate
0.6%
Rent to Value Ratio
Active
$340,000
3
bds
|
2
ba
|
1,516
sqft
|
built
2018
178 James Adkins Dr, Kyle, TX 78640
$-835
Cash flow
-12.8%
Cash-on-Cash Return
2.7%
Cap rate
0.6%
Rent to Value Ratio
Active
$2,390,000
3
bds
|
2
ba
|
4,504
sqft
|
built
1978
3403 Fm 2325, Wimberley, TX 78676
$-9,516
Cash flow
-20.8%
Cash-on-Cash Return
0.9%
Cap rate
0.2%
Rent to Value Ratio
Active
$389,000
4
bds
|
3
ba
|
2,673
sqft
|
built
2014
319 Hunter Ridge Rd, San Marcos, TX 78666
$-881
Cash flow
-11.8%
Cash-on-Cash Return
3.0%
Cap rate
0.6%
Rent to Value Ratio
Active
$268,000
3
bds
|
3
ba
|
1,336
sqft
|
built
2021
314 Spiny Lizard Ln, San Marcos, TX 78666
$-546
Cash flow
-10.6%
Cash-on-Cash Return
3.2%
Cap rate
0.7%
Rent to Value Ratio
Active
$313,600
3
bds
|
2
ba
|
1,494
sqft
|
built
2017
184 Palm Dr, Buda, TX 78610
$-883
Cash flow
-14.7%
Cash-on-Cash Return
2.3%
Cap rate
0.6%
Rent to Value Ratio
Active
$400,000
5
bds
|
3
ba
|
2,812
sqft
|
built
2008
1661 Twin Cv, Kyle, TX 78640
$-883
Cash flow
-11.5%
Cash-on-Cash Return
3.0%
Cap rate
0.6%
Rent to Value Ratio
Active
$695,000
4
bds
|
3
ba
|
2,340
sqft
|
built
1985
305 Canyon Wren Dr, Buda, TX 78610
$-2,037
Cash flow
-15.3%
Cash-on-Cash Return
2.2%
Cap rate
0.5%
Rent to Value Ratio
Active
$629,000
2
bds
|
3
ba
|
2,330
sqft
|
built
2018
112 Learning Elm Dr, San Marcos, TX 78666
$-2,110
Cash flow
-17.5%
Cash-on-Cash Return
1.7%
Cap rate
0.5%
Rent to Value Ratio
Active
$300,000
3
bds
|
2
ba
|
1,344
sqft
|
built
2023
1312 Plymouth Rd, San Marcos, TX 78666
$-571
Cash flow
-9.9%
Cash-on-Cash Return
3.4%
Cap rate
0.6%
Rent to Value Ratio