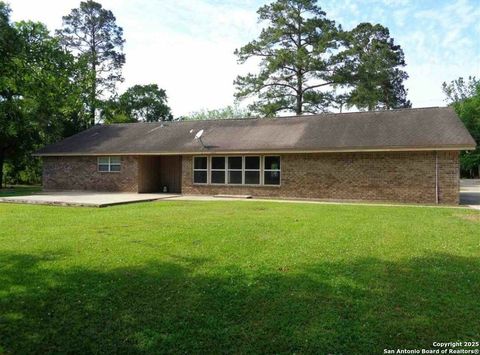
Orange County Investment Properties for Sale
Browse homes for sale and investment properties in Orange County. Refine your search by price, property type, or more.
Best cash flowing properties in Orange County
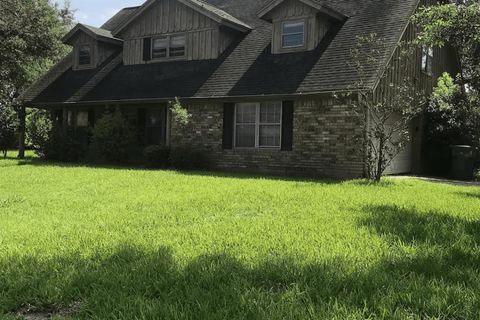
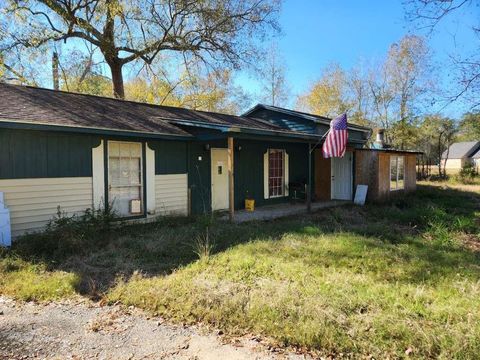
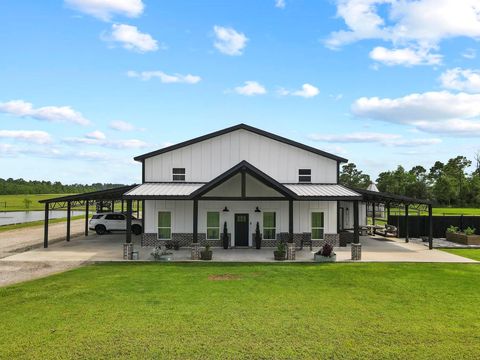
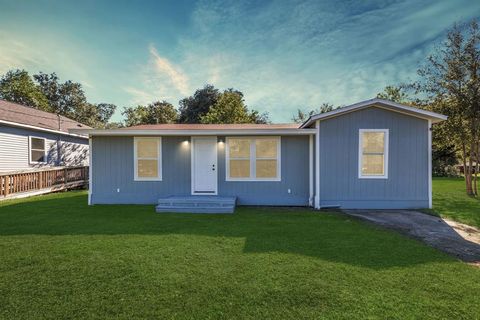
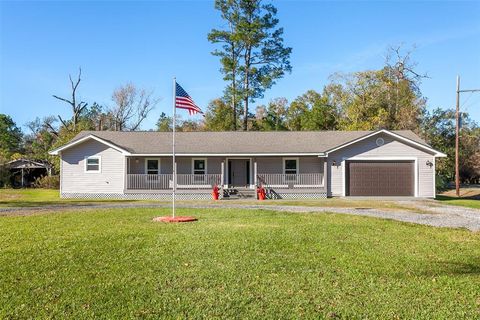
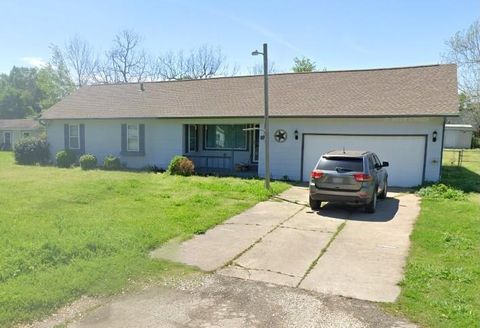
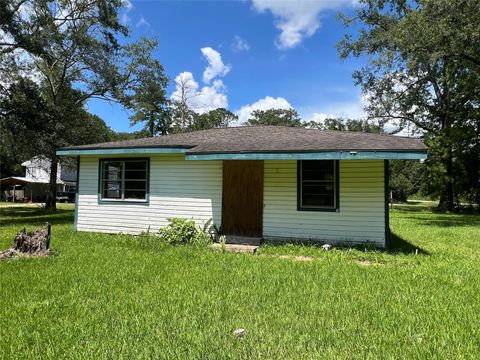
Active
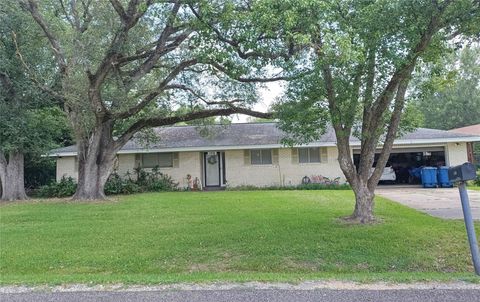
$275,000
6
bds
|
3
ba
|
3,194
sqft
|
built
1976
2800 Country Club Dr, Orange, TX 77630
$2,494
Cash flow
47.3%
Cash-on-Cash Return
16.6%
Cap rate
2.0%
Rent to Value Ratio
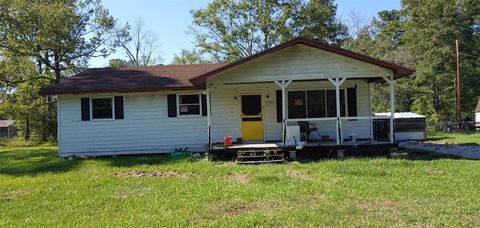
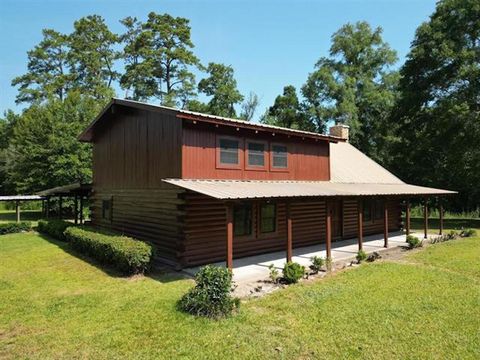
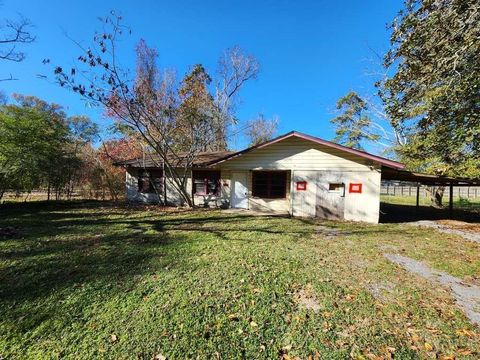
Active
$174,000
3
bds
|
2
ba
|
1,320
sqft
|
built
1991
9743 Westbend, Orange, TX 77632
$1,453
Cash flow
43.6%
Cash-on-Cash Return
15.7%
Cap rate
2.1%
Rent to Value Ratio
67 out of 87 properties for sale in Orange County
Limited Results Shown
Create a free account, or log in to reveal all property listings and enjoy the complete experience.

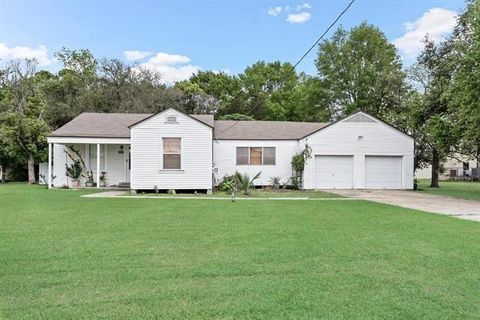
Active
$225,500
4
bds
|
2
ba
|
1,979
sqft
|
built
1965
2890 Evangeline Dr, Vidor, TX 77662
$175
Cash flow
4.0%
Cash-on-Cash Return
6.6%
Cap rate
0.8%
Rent to Value Ratio

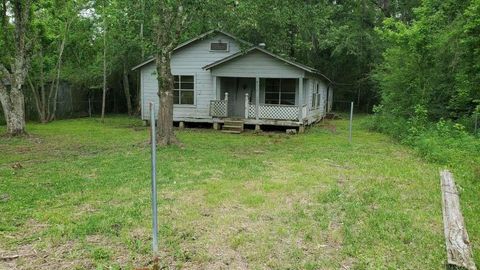
Active
$112,200
3
bds
|
1
ba
|
1,410
sqft
|
built
1954
13 Byron Rd, Orange, TX 77630
$128
Cash flow
6.0%
Cash-on-Cash Return
7.0%
Cap rate
1.1%
Rent to Value Ratio
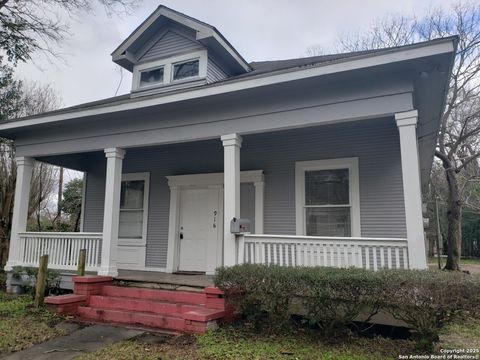
Active
$93,500
2
bds
|
1
ba
|
1,050
sqft
|
built
1930
916 5th St, Orange, TX 77630
$338
Cash flow
18.9%
Cash-on-Cash Return
10.0%
Cap rate
1.4%
Rent to Value Ratio

Active
$159,500
4
bds
|
2
ba
|
1,660
sqft
|
built
1940
906 W Scott St, Orange, TX 77630
$-679
Cash flow
-22.2%
Cash-on-Cash Return
0.6%
Cap rate
1.0%
Rent to Value Ratio
Active
$374,000
5
bds
|
3
ba
|
2,520
sqft
|
built
1980
785 Alamo St, Vidor, TX 77662
$-407
Cash flow
-5.7%
Cash-on-Cash Return
4.4%
Cap rate
0.7%
Rent to Value Ratio

Active
$75,999
1
bds
|
1
ba
|
536
sqft
|
built
1969
1205 Rein Ave, Orange, TX 77630
$246
Cash flow
16.9%
Cash-on-Cash Return
9.6%
Cap rate
1.3%
Rent to Value Ratio
Active
$151,499
2
bds
|
2
ba
|
2,181
sqft
|
built
1980
422 Texla Rd, Vidor, TX 77662
$297
Cash flow
10.2%
Cash-on-Cash Return
8.0%
Cap rate
1.1%
Rent to Value Ratio
Active
$469,900
5
bds
|
4
ba
|
3,057
sqft
|
built
2000
250 Oakland Dr, Vidor, TX 77662
$-1,135
Cash flow
-12.6%
Cash-on-Cash Return
2.8%
Cap rate
0.6%
Rent to Value Ratio
Active
$349,900
4
bds
|
3
ba
|
1,657
sqft
|
built
1967
2053 Duhon St, Orange, TX 77632
$-768
Cash flow
-11.5%
Cash-on-Cash Return
3.0%
Cap rate
0.5%
Rent to Value Ratio
Active
$269,900
3
bds
|
3
ba
|
2,242
sqft
|
built
1960
2140 Live Oak Rd, Orange, TX 77630
$-383
Cash flow
-7.4%
Cash-on-Cash Return
4.0%
Cap rate
0.7%
Rent to Value Ratio
Active
$750,000
4
bds
|
2
ba
|
3,828
sqft
|
built
2022
10885 Fm 1130, Orange, TX 77632
$-1,962
Cash flow
-13.6%
Cash-on-Cash Return
2.5%
Cap rate
0.3%
Rent to Value Ratio

Active
$175,000
3
bds
|
2
ba
|
1,210
sqft
|
built
1979
245 E Clover St, Bridge City, TX 77611
$150
Cash flow
4.5%
Cash-on-Cash Return
6.7%
Cap rate
1.0%
Rent to Value Ratio
Active
$165,000
3
bds
|
2
ba
|
1,691
sqft
|
built
1977
2017 5th St, Orange, TX 77630
$-9
Cash flow
-0.3%
Cash-on-Cash Return
5.6%
Cap rate
1.0%
Rent to Value Ratio
Active
$239,500
3
bds
|
2
ba
|
2,018
sqft
|
built
1976
2024 International Ave, Orange, TX 77632
$109
Cash flow
2.4%
Cash-on-Cash Return
6.2%
Cap rate
0.8%
Rent to Value Ratio

Active
$699,900
5
bds
|
5
ba
|
4,087
sqft
|
built
1995
302 Waterwood Dr, Orange, TX 77630
$-2,716
Cash flow
-20.2%
Cash-on-Cash Return
1.0%
Cap rate
0.3%
Rent to Value Ratio
Active
$259,000
3
bds
|
2
ba
|
1,819
sqft
|
built
2018
4403 Persimmon Cir, Orange, TX 77630
$-336
Cash flow
-6.8%
Cash-on-Cash Return
4.1%
Cap rate
0.8%
Rent to Value Ratio
Active
$150,000
3
bds
|
1
ba
|
1,038
sqft
|
built
1949
1112 8th St, Orange, TX 77630
$260
Cash flow
9.0%
Cash-on-Cash Return
7.8%
Cap rate
1.1%
Rent to Value Ratio
Active
$379,000
3
bds
|
3
ba
|
2,648
sqft
|
built
1988
1205 Douglas St, Vidor, TX 77662
$138
Cash flow
1.9%
Cash-on-Cash Return
6.1%
Cap rate
0.7%
Rent to Value Ratio
Active
$150,000
3
bds
|
1
ba
|
1,364
sqft
|
built
1950
150 Canal St, Bridge City, TX 77611
$62
Cash flow
2.2%
Cash-on-Cash Return
6.2%
Cap rate
0.9%
Rent to Value Ratio
Active
$59,499
3
bds
|
2
ba
|
1,655
sqft
|
built
1960
7128 Panther Run, Orange, TX 77632
$806
Cash flow
15.8%
Cash-on-Cash Return
16.3%
Cap rate
2.0%
Rent to Value Ratio
Active
$289,000
4
bds
|
3
ba
|
1,967
sqft
|
built
1976
559 Doty Rd, Vidor, TX 77662
$-267
Cash flow
-4.8%
Cash-on-Cash Return
4.6%
Cap rate
0.6%
Rent to Value Ratio
Active
$25,000
2
bds
|
1
ba
|
1,074
sqft
|
built
1925
906 6th St, Orange, TX 77630
$621
Cash flow
28.9%
Cash-on-Cash Return
29.8%
Cap rate
3.6%
Rent to Value Ratio
Active
$189,900
4
bds
|
3
ba
|
2,849
sqft
|
built
1971
3335 Old Castle Ln, Orange, TX 77630
$-117
Cash flow
-3.2%
Cash-on-Cash Return
4.9%
Cap rate
0.9%
Rent to Value Ratio
Active
$559,900
4
bds
|
3
ba
|
2,891
sqft
|
built
2014
1830 Langham Forest Blvd, Orange, TX 77630
$-1,531
Cash flow
-14.3%
Cash-on-Cash Return
2.4%
Cap rate
0.5%
Rent to Value Ratio
Active
$220,000
4
bds
|
2
ba
|
1,861
sqft
|
built
1940
160 E Darby St, Bridge City, TX 77611
$1,374
Cash flow
32.6%
Cash-on-Cash Return
13.2%
Cap rate
1.6%
Rent to Value Ratio
Active
$179,900
3
bds
|
2
ba
|
1,405
sqft
|
built
2009
664 W Tram Rd, Vidor, TX 77662
$27
Cash flow
0.8%
Cash-on-Cash Return
5.9%
Cap rate
0.9%
Rent to Value Ratio
Active
$130,249
3
bds
|
2
ba
|
1,412
sqft
|
built
1968
270 Triangle Dr, Vidor, TX 77662
$215
Cash flow
8.6%
Cash-on-Cash Return
7.7%
Cap rate
1.1%
Rent to Value Ratio
Active
$339,900
3
bds
|
3
ba
|
2,552
sqft
|
built
2002
3455 Michelle Ave, Vidor, TX 77662
$-290
Cash flow
-4.5%
Cash-on-Cash Return
4.7%
Cap rate
0.7%
Rent to Value Ratio
Active
$25,000
2
bds
|
1
ba
|
768
sqft
|
built
1960
120 Lawrence Ln, Vidor, TX 77662
$711
Cash flow
33.1%
Cash-on-Cash Return
34.1%
Cap rate
4.4%
Rent to Value Ratio

Active
$265,000
3
bds
|
3
ba
|
2,033
sqft
|
built
1978
164 Shadowdale St, Bridge City, TX 77611
$-42
Cash flow
-0.8%
Cash-on-Cash Return
5.5%
Cap rate
0.9%
Rent to Value Ratio
Active
$29,049
3
bds
|
1
ba
|
1,200
sqft
|
built
1965
950 Millie St, Vidor, TX 77662
$879
Cash flow
35.3%
Cash-on-Cash Return
36.3%
Cap rate
4.5%
Rent to Value Ratio
Active
$245,000
4
bds
|
3
ba
|
4,543
sqft
|
built
1945
8265 Maple St, Orange, TX 77632
$-5
Cash flow
-0.1%
Cash-on-Cash Return
5.7%
Cap rate
0.9%
Rent to Value Ratio
Active
$329,000
4
bds
|
2
ba
|
2,847
sqft
|
built
1977
425 Lawrence Ln, Vidor, TX 77662
$30
Cash flow
0.5%
Cash-on-Cash Return
5.8%
Cap rate
0.7%
Rent to Value Ratio
Active
$165,000
3
bds
|
2
ba
|
1,790
sqft
|
built
1966
158 Ridgewood St, Bridge City, TX 77611
$100
Cash flow
3.2%
Cash-on-Cash Return
6.4%
Cap rate
1.1%
Rent to Value Ratio
Active
$124,900
3
bds
|
2
ba
|
1,368
sqft
|
built
1950
2227 Westway St, Orange, TX 77630
$11
Cash flow
0.5%
Cash-on-Cash Return
5.8%
Cap rate
0.9%
Rent to Value Ratio
Active
$49,000
3
bds
|
2
ba
|
1,457
sqft
|
built
1950
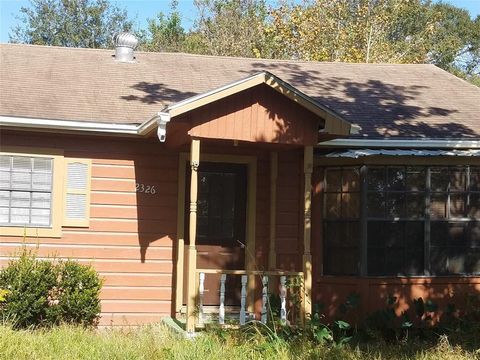
2326 Houston St, West Orange, TX 77630
$682
Cash flow
16.2%
Cash-on-Cash Return
16.7%
Cap rate
2.2%
Rent to Value Ratio
Active
$119,900
2
bds
|
2
ba
|
1,482
sqft
|
built
2018
1802 29th St, Orange, TX 77630
$187
Cash flow
8.1%
Cash-on-Cash Return
7.5%
Cap rate
1.3%
Rent to Value Ratio

Active
$179,900
4
bds
|
3
ba
|
2,420
sqft
|
built
1960
805 Dugas St, Bridge City, TX 77611
$48
Cash flow
1.4%
Cash-on-Cash Return
6.0%
Cap rate
1.1%
Rent to Value Ratio