Illinois Investment Properties for Sale
Browse homes for sale and investment properties in Illinois. Refine your search by price, property type, or more.
Best cash flowing properties in Illinois
Active
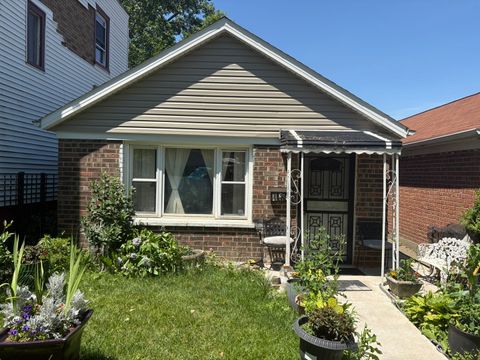
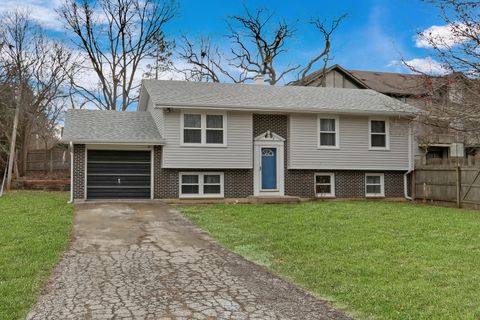
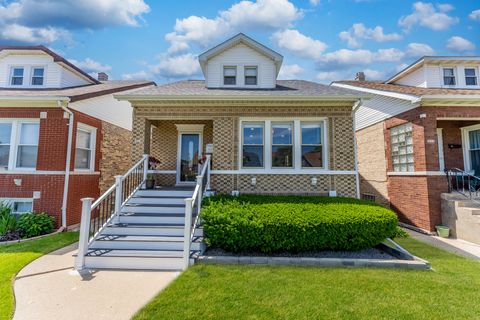
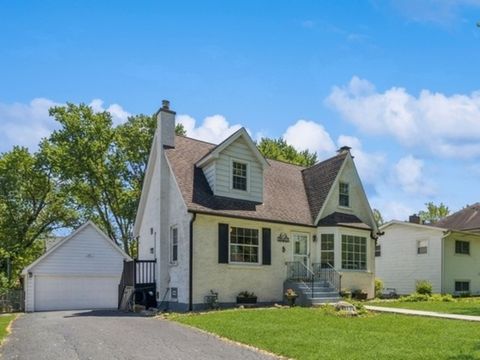
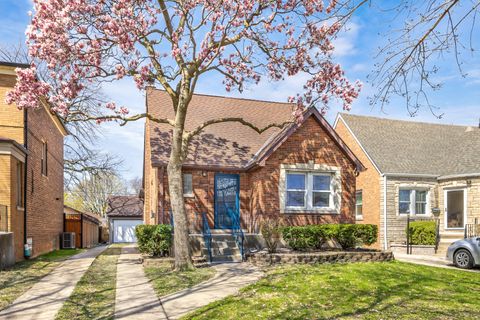
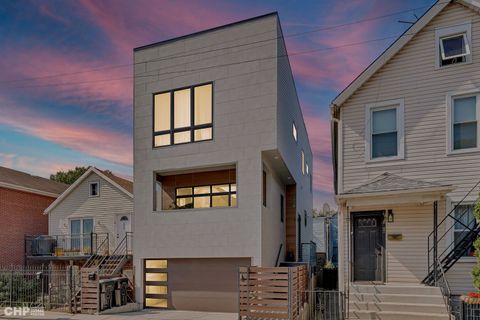
$169,900
4
bds
|
2
ba
|
1,197
sqft
|
built
1972
414 N Avers Ave, Chicago, IL 60624
$561
Cash flow
17.2%
Cash-on-Cash Return
9.6%
Cap rate
1.2%
Rent to Value Ratio
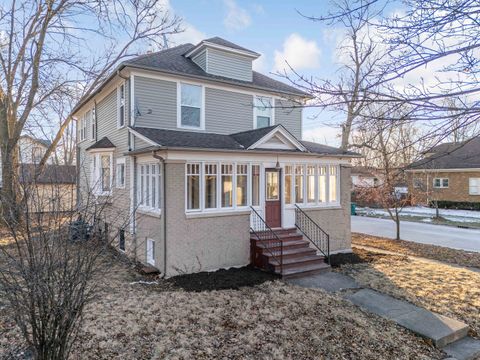
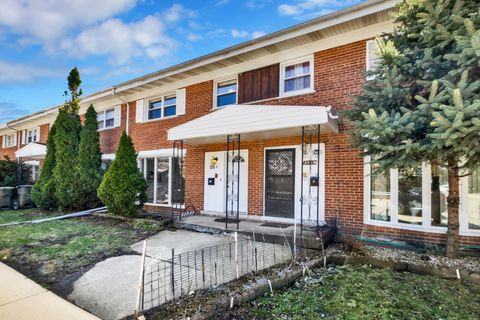
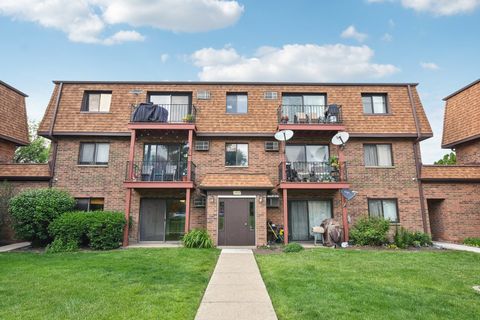
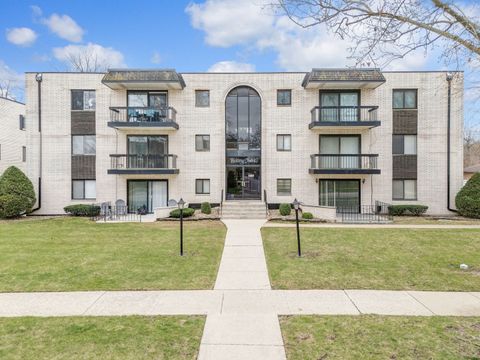
Active
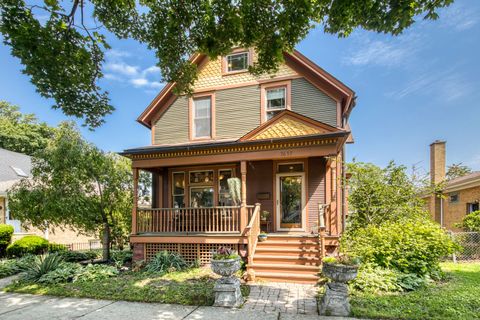
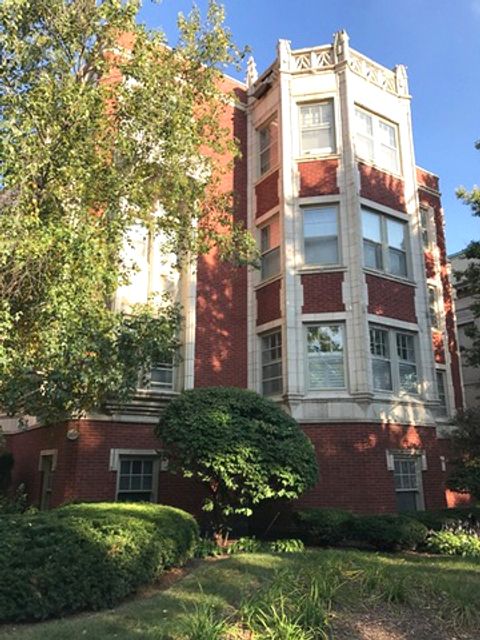
$285,000
3
bds
|
2
ba
|
1,573
sqft
|
built
1910
150 N Raynor Ave, Joliet, IL 60435
$111
Cash flow
2.0%
Cash-on-Cash Return
6.1%
Cap rate
0.9%
Rent to Value Ratio
9,443 out of 17,249 properties for sale in Illinois
Limited Results Shown
Create a free account, or log in to reveal all property listings and enjoy the complete experience.
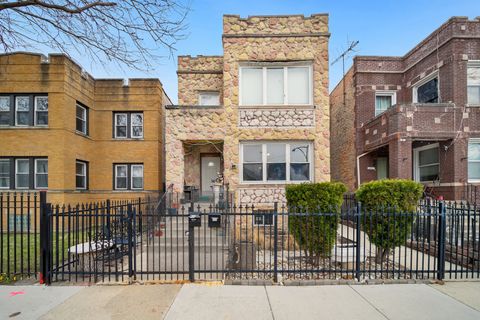
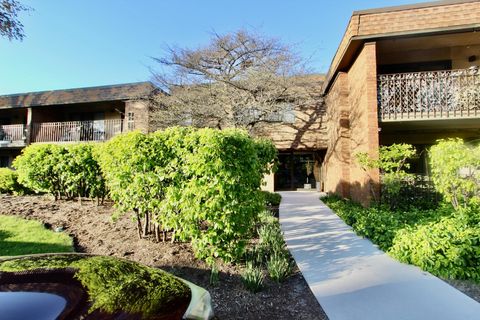
Active
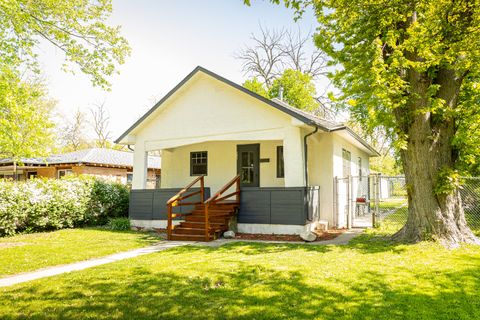
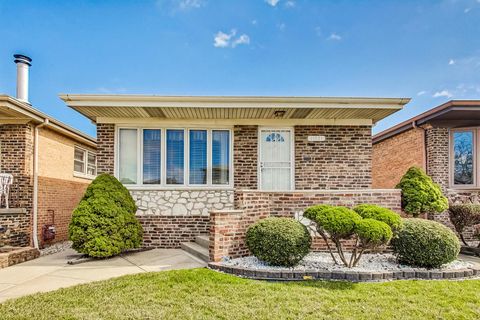
$379,500
8
bds
|
3
ba
|
0
sqft
|
built
1915
6409 S Mozart St, Chicago, IL 60629
$-687
Cash flow
-9.4%
Cash-on-Cash Return
4.1%
Cap rate
0.6%
Rent to Value Ratio
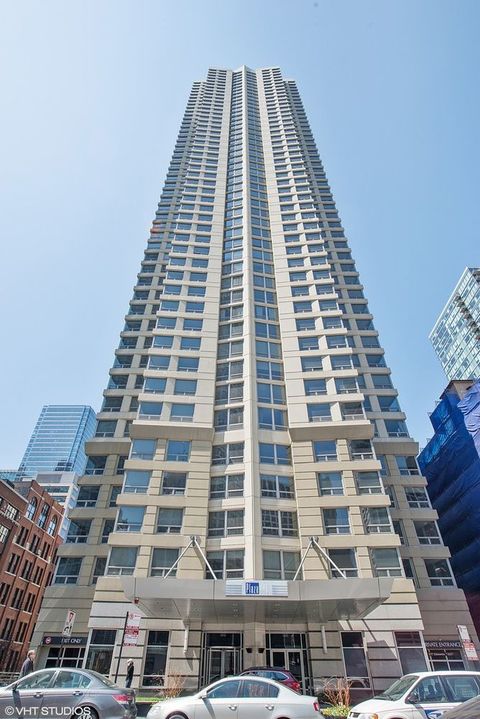
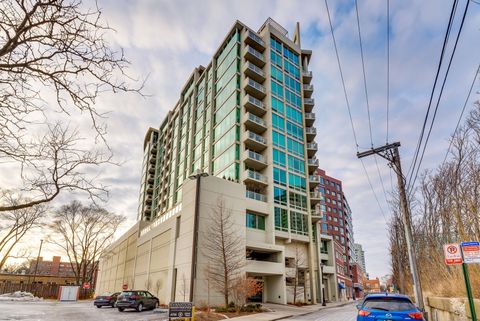
Active
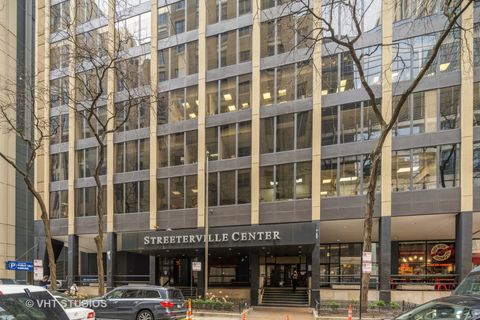
$199,950
bds
|
1
ba
|
0
sqft
|
built
1995
440 N Wabash Ave, Chicago, IL 60611
$-615
Cash flow
-16.0%
Cash-on-Cash Return
2.6%
Cap rate
0.8%
Rent to Value Ratio
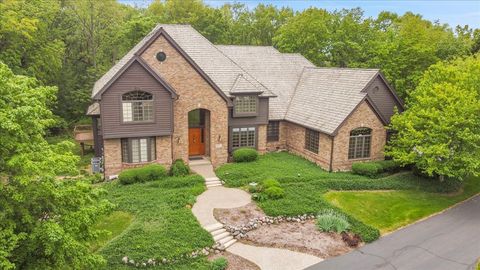
Active
$625,000
4
bds
|
3
ba
|
3,609
sqft
|
built
1994
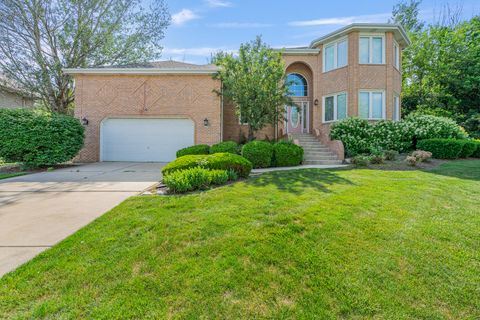
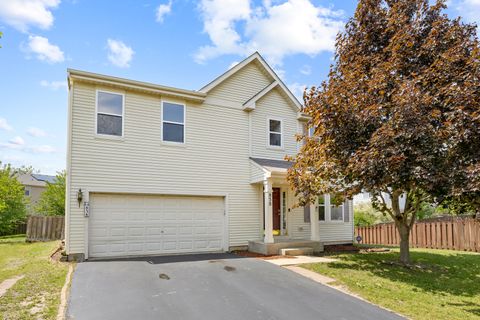
15328 Sharon Dr, Homer Glen, IL 60491
$-2,039
Cash flow
-17.0%
Cash-on-Cash Return
2.4%
Cap rate
0.6%
Rent to Value Ratio
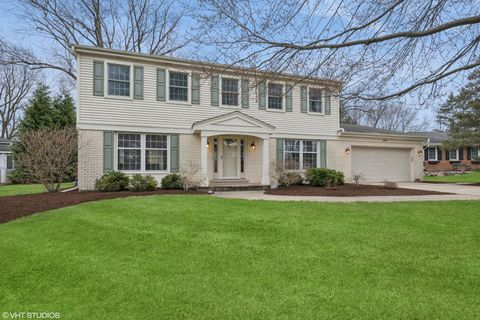
Active
$210,000
4
bds
|
3
ba
|
1,600
sqft
|
built
2001
1372 Fox Hound Trl, Beecher, IL 60401
$91
Cash flow
2.3%
Cash-on-Cash Return
6.8%
Cap rate
1.2%
Rent to Value Ratio
Active
$423,900
3
bds
|
4
ba
|
1,820
sqft
|
built
1985
1835 Golf View Dr, Bartlett, IL 60103
$-1,135
Cash flow
-14.0%
Cash-on-Cash Return
3.1%
Cap rate
0.7%
Rent to Value Ratio
Active
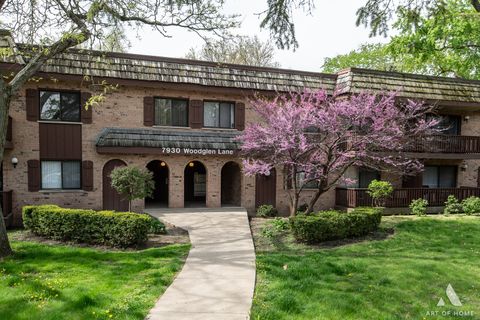
$235,000
2
bds
|
2
ba
|
1,058
sqft
|
built
1969
7930 Woodglen Ln, Downers Grove, IL 60516
$-386
Cash flow
-8.6%
Cash-on-Cash Return
4.3%
Cap rate
0.9%
Rent to Value Ratio
Active
$289,900
4
bds
|
2
ba
|
1,950
sqft
|
built
1968
2625 Shirley Dr, Gurnee, IL 60031
$-609
Cash flow
-11.0%
Cash-on-Cash Return
3.7%
Cap rate
0.9%
Rent to Value Ratio
Active
$330,000
3
bds
|
3
ba
|
1,500
sqft
|
built
1963
8852 Robin Dr, Des Plaines, IL 60016
$-409
Cash flow
-6.5%
Cash-on-Cash Return
4.8%
Cap rate
0.8%
Rent to Value Ratio
Active
$750,000
4
bds
|
3
ba
|
2,600
sqft
|
built
1969
360 S Valley Rd, Barrington, IL 60010
$-2,107
Cash flow
-14.7%
Cash-on-Cash Return
2.9%
Cap rate
0.5%
Rent to Value Ratio
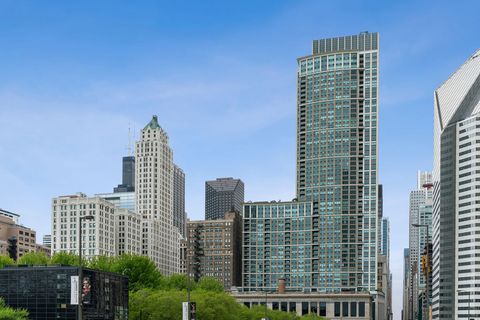
Active
$749,900
2
bds
|
2
ba
|
0
sqft
|
built
2004
130 N Garland Ct, Chicago, IL 60602
$-2,565
Cash flow
-17.8%
Cash-on-Cash Return
1.6%
Cap rate
0.6%
Rent to Value Ratio

Active
$474,000
3
bds
|
3
ba
|
1,614
sqft
|
built
1983
832 Debra Ln, Elk Grove Village, IL 60007
$-900
Cash flow
-9.9%
Cash-on-Cash Return
4.0%
Cap rate
0.7%
Rent to Value Ratio
Active
$499,000
3
bds
|
3
ba
|
2,100
sqft
|
built
1927
2610 N Major Ave, Chicago, IL 60639
$-292
Cash flow
-3.1%
Cash-on-Cash Return
5.0%
Cap rate
0.7%
Rent to Value Ratio
Active
$545,000
3
bds
|
2
ba
|
2,102
sqft
|
built
1895
7637 Wilcox St, Forest Park, IL 60130
$-669
Cash flow
-6.4%
Cash-on-Cash Return
4.2%
Cap rate
0.8%
Rent to Value Ratio
Active
$135,000
2
bds
|
1
ba
|
754
sqft
|
built
684 S Gordon Ave, Kankakee, IL 60901
$-89
Cash flow
-3.4%
Cash-on-Cash Return
5.5%
Cap rate
0.7%
Rent to Value Ratio
Active
$182,000
1
bds
|
1
ba
|
650
sqft
|
built
1972
233 E Erie St, Chicago, IL 60611
$-486
Cash flow
-13.9%
Cash-on-Cash Return
3.1%
Cap rate
1.1%
Rent to Value Ratio
Active
$315,000
3
bds
|
2
ba
|
1,698
sqft
|
built
1957
12101 S Lafayette Ave, Chicago, IL 60628
$-47
Cash flow
-0.8%
Cash-on-Cash Return
5.5%
Cap rate
0.8%
Rent to Value Ratio
Active
$189,900
2
bds
|
2
ba
|
992
sqft
|
built
1983
4003 W 105th St, Oak Lawn, IL 60453
$-198
Cash flow
-5.4%
Cash-on-Cash Return
4.4%
Cap rate
1.1%
Rent to Value Ratio
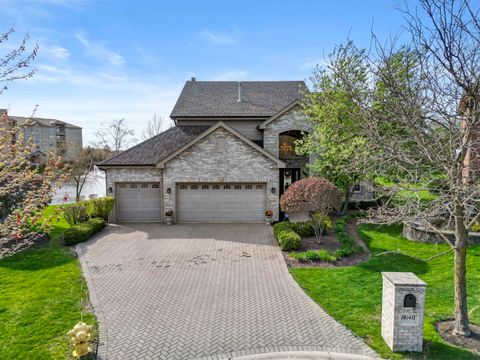
Active
$739,000
4
bds
|
4
ba
|
3,111
sqft
|
built
2010
18140 Buckingham Dr, Orland Park, IL 60467
$-1,953
Cash flow
-13.8%
Cash-on-Cash Return
3.1%
Cap rate
0.6%
Rent to Value Ratio
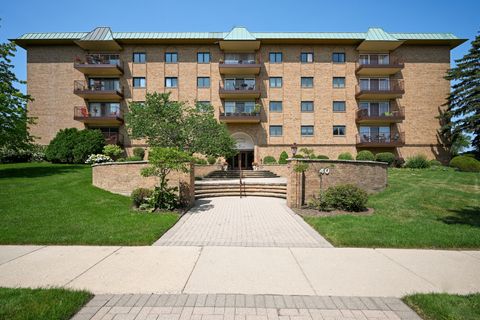
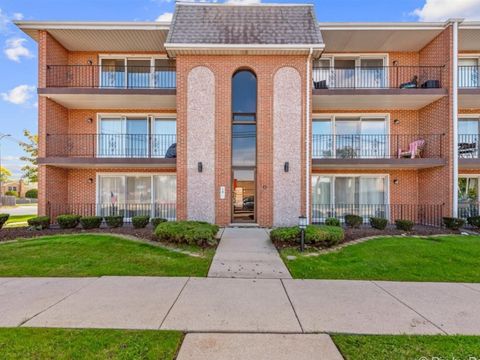
Active
$299,900
3
bds
|
3
ba
|
1,875
sqft
|
built
1973
40 S Main St, Glen Ellyn, IL 60137
$-639
Cash flow
-11.1%
Cash-on-Cash Return
3.1%
Cap rate
0.9%
Rent to Value Ratio
Active
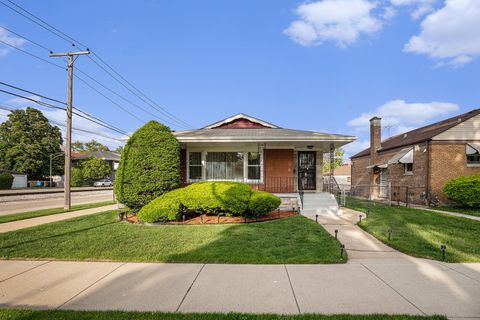
$169,900
4
bds
|
2
ba
|
1,197
sqft
|
built
1972
414 N Avers Ave, Chicago, IL 60624
$561
Cash flow
17.2%
Cash-on-Cash Return
9.6%
Cap rate
1.2%
Rent to Value Ratio
Active
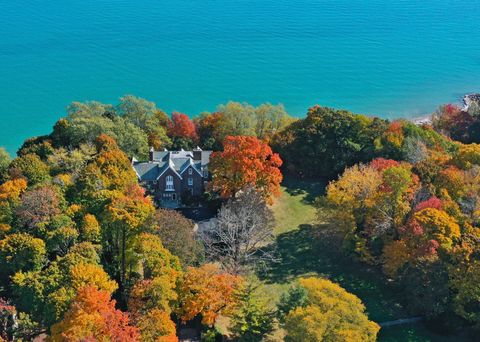
$6,250,000
7
bds
|
7
ba
|
7,149
sqft
|
built
1914
111 N Mayflower Rd, Lake Forest, IL 60045
$-32,686
Cash flow
-27.3%
Cash-on-Cash Return
0.0%
Cap rate
0.1%
Rent to Value Ratio
Active
$135,000
1
bds
|
1
ba
|
0
sqft
|
built
1947
4960 N Marine Dr, Chicago, IL 60640
$-358
Cash flow
-13.8%
Cash-on-Cash Return
3.1%
Cap rate
1.2%
Rent to Value Ratio
Active
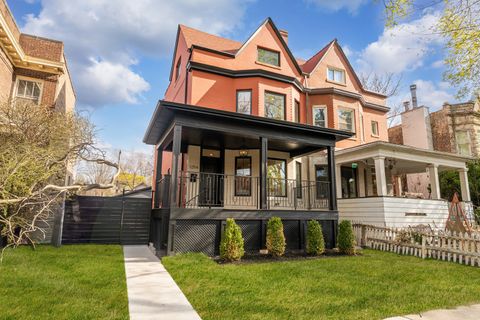
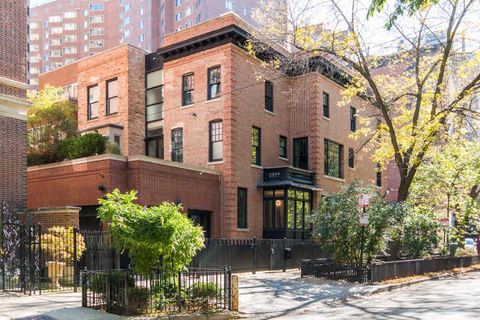
$1,495,000
4
bds
|
5
ba
|
0
sqft
|
built
1892
1254 W Norwood St, Chicago, IL 60660
$-6,705
Cash flow
-23.4%
Cash-on-Cash Return
0.9%
Cap rate
0.2%
Rent to Value Ratio
Active
$285,000
3
bds
|
2
ba
|
1,573
sqft
|
built
1910
150 N Raynor Ave, Joliet, IL 60435
$111
Cash flow
2.0%
Cash-on-Cash Return
6.1%
Cap rate
0.9%
Rent to Value Ratio
Active
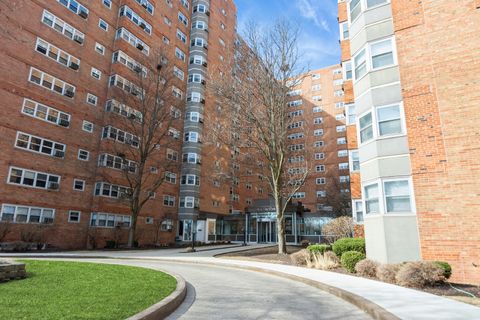
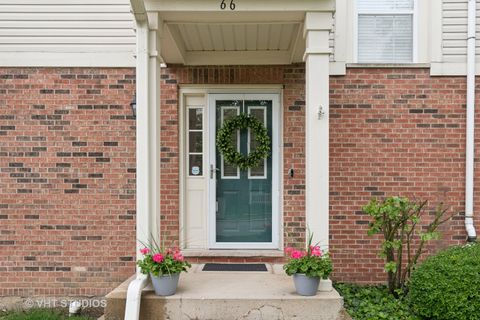
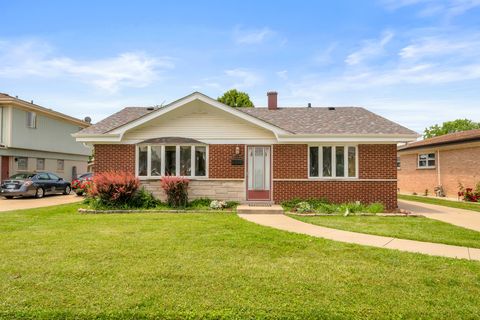
$289,000
2
bds
|
2
ba
|
1,340
sqft
|
built
1997
66 N Palazzo Dr, Addison, IL 60101
$-295
Cash flow
-5.3%
Cash-on-Cash Return
4.5%
Cap rate
0.9%
Rent to Value Ratio
Active
$370,000
4
bds
|
3
ba
|
2,133
sqft
|
built
2005
838 Valley Stream Dr, Pingree Grove, IL 60140
$-714
Cash flow
-10.1%
Cash-on-Cash Return
4.0%
Cap rate
0.8%
Rent to Value Ratio
Active
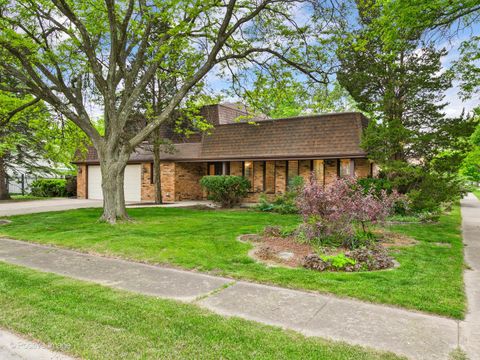
$309,900
3
bds
|
2
ba
|
1,575
sqft
|
built
1960
12236 S Hamlin Ave, Alsip, IL 60803
$-276
Cash flow
-4.6%
Cash-on-Cash Return
4.6%
Cap rate
0.8%
Rent to Value Ratio
Active
$700,000
4
bds
|
3
ba
|
2,552
sqft
|
built
1975
3843 Lizette Ln, Glenview, IL 60026
$-1,356
Cash flow
-10.1%
Cash-on-Cash Return
3.9%
Cap rate
0.6%
Rent to Value Ratio
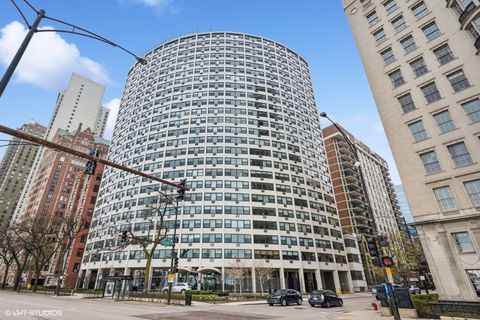
Active
$165,000
bds
|
1
ba
|
650
sqft
|
built
1957
1150 N Lake Shore Dr, Chicago, IL 60611
$-454
Cash flow
-14.4%
Cash-on-Cash Return
3.0%
Cap rate
1.1%
Rent to Value Ratio
Active
$399,900
4
bds
|
2
ba
|
1,269
sqft
|
built
1954
127 S Ashland Ave, Palatine, IL 60074
$-828
Cash flow
-10.8%
Cash-on-Cash Return
3.8%
Cap rate
0.7%
Rent to Value Ratio
Active
$499,999
2
bds
|
2
ba
|
0
sqft
|
built
2009
1570 Elmwood Ave, Evanston, IL 60201
$-1,621
Cash flow
-16.9%
Cash-on-Cash Return
2.4%
Cap rate
0.7%
Rent to Value Ratio
Active
$159,900
1
bds
|
1
ba
|
660
sqft
|
built
1980
493 Mc Henry Rd, Wheeling, IL 60090
$-168
Cash flow
-5.5%
Cash-on-Cash Return
4.4%
Cap rate
1.0%
Rent to Value Ratio
Active
$995,000
5
bds
|
6
ba
|
7,656
sqft
|
built
1996
16001 Burr Oak Dr, Huntley, IL 60142
$-2,574
Cash flow
-13.5%
Cash-on-Cash Return
2.6%
Cap rate
0.5%
Rent to Value Ratio
Active
$470,000
3
bds
|
3
ba
|
2,100
sqft
|
built
1941
5632 S Natoma Ave, Chicago, IL 60638
$-1,038
Cash flow
-11.5%
Cash-on-Cash Return
3.0%
Cap rate
0.5%
Rent to Value Ratio
Active
$249,900
2
bds
|
1
ba
|
1,000
sqft
|
built
1924
208 N Oak Park Ave, Oak Park, IL 60302
$-751
Cash flow
-15.7%
Cash-on-Cash Return
2.1%
Cap rate
0.9%
Rent to Value Ratio
Active
$305,000
3
bds
|
2
ba
|
2,556
sqft
|
built
1976
11531 S Avenue J, Chicago, IL 60617
$-132
Cash flow
-2.3%
Cash-on-Cash Return
5.2%
Cap rate
0.8%
Rent to Value Ratio
Active
$3,399,500
4
bds
|
6
ba
|
5,500
sqft
|
built
1898
1401 N Astor St, Chicago, IL 60610
$-13,504
Cash flow
-20.7%
Cash-on-Cash Return
0.9%
Cap rate
0.3%
Rent to Value Ratio
Active
$999,500
4
bds
|
4
ba
|
3,000
sqft
|
built
2020
1920 S Shelby Ct, Chicago, IL 60608
$-2,354
Cash flow
-12.3%
Cash-on-Cash Return
2.9%
Cap rate
0.5%
Rent to Value Ratio
Active
$169,900
2
bds
|
2
ba
|
950
sqft
|
built
1977
5715 129th St, Crestwood, IL 60418
$-138
Cash flow
-4.2%
Cash-on-Cash Return
5.3%
Cap rate
1.1%
Rent to Value Ratio
Active
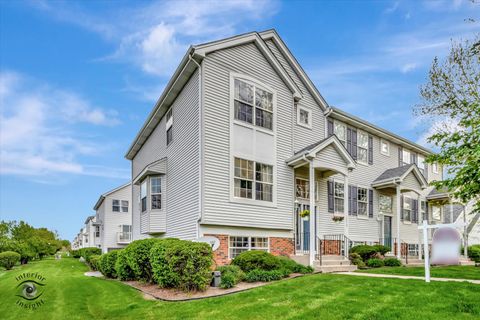
$265,000
2
bds
|
2
ba
|
1,500
sqft
|
built
1977
10 Old Oak Dr, Buffalo Grove, IL 60089
$-460
Cash flow
-9.1%
Cash-on-Cash Return
3.6%
Cap rate
0.8%
Rent to Value Ratio