Salt Lake County Investment Properties for Sale
Browse homes for sale and investment properties in Salt Lake County. Refine your search by price, property type, or more.
Best cash flowing properties in Salt Lake County
Active
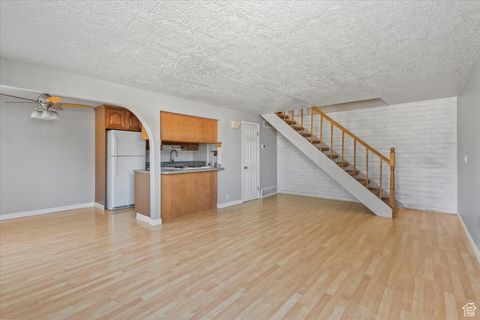
$269,000
2
bds
|
1
ba
|
894
sqft
|
built
1973
1192 W 4365 S, Taylorsville, UT 84123
$-761
Cash flow
-14.8%
Cash-on-Cash Return
2.3%
Cap rate
0.5%
Rent to Value Ratio
Active
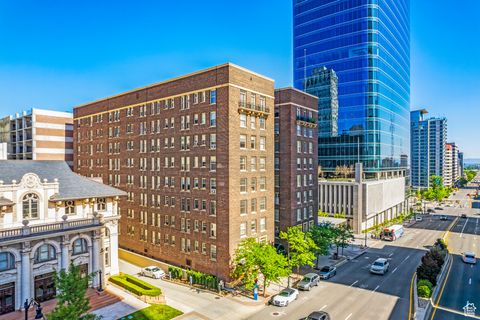
$355,000
1
bds
|
1
ba
|
552
sqft
|
built
1919
29 S State St, Salt Lake City, UT 84111
$-844
Cash flow
-12.4%
Cash-on-Cash Return
2.8%
Cap rate
0.5%
Rent to Value Ratio
1,634 out of 2,619 properties for sale in Salt Lake County
Limited Results Shown
Create a free account, or log in to reveal all property listings and enjoy the complete experience.
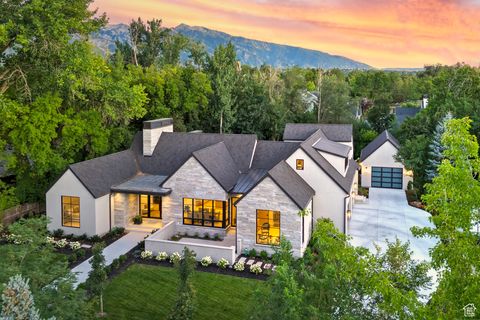
Active
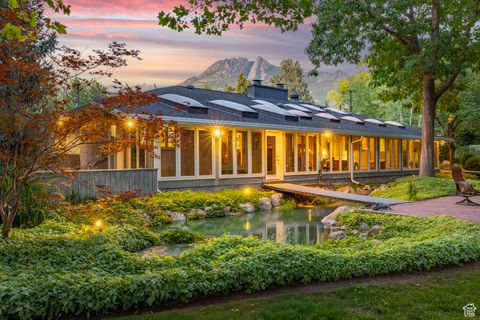
$2,550,000
2
bds
|
3
ba
|
7,489
sqft
|
built
1963
2185 E Applewood Ave, Holladay, UT 84121
$-9,911
Cash flow
-20.3%
Cash-on-Cash Return
1.0%
Cap rate
0.2%
Rent to Value Ratio
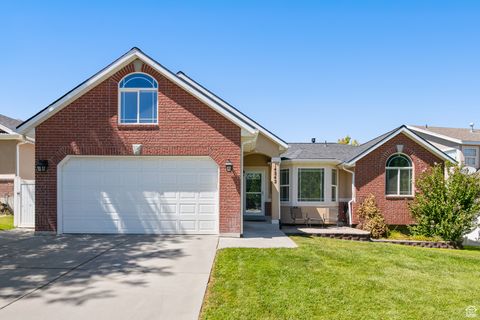
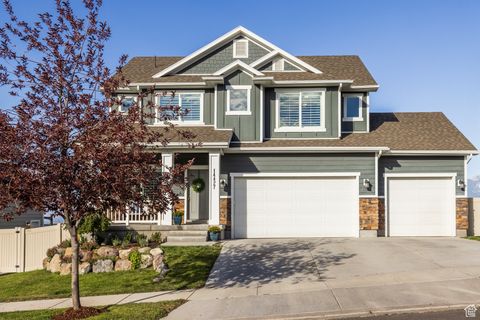
Active
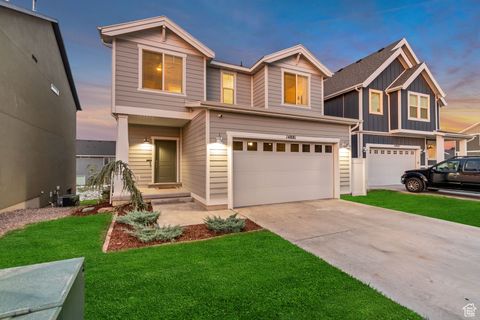
$594,900
5
bds
|
4
ba
|
2,658
sqft
|
built
2018
14881 S Beckenbauer Ave, Herriman, UT 84096
$-1,535
Cash flow
-13.5%
Cash-on-Cash Return
2.6%
Cap rate
0.4%
Rent to Value Ratio
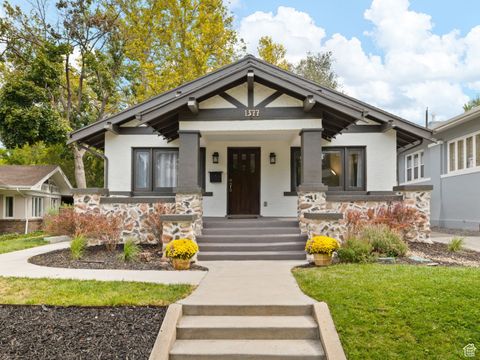
Active
$1,350,000
4
bds
|
3
ba
|
4,248
sqft
|
built
1916
1377 E Butler Ave, Salt Lake City, UT 84102
$-2,972
Cash flow
-11.5%
Cash-on-Cash Return
3.0%
Cap rate
0.4%
Rent to Value Ratio
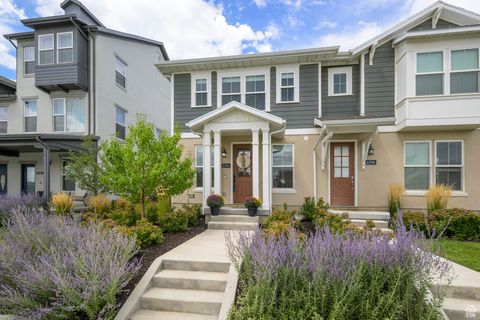
Active
$467,000
3
bds
|
3
ba
|
1,400
sqft
|
built
2022
11714 S Watercourse Rd, South Jordan, UT 84009
$-1,191
Cash flow
-13.3%
Cash-on-Cash Return
2.6%
Cap rate
0.5%
Rent to Value Ratio
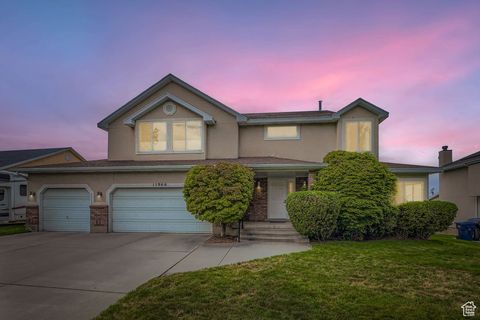
Active
$1,035,000
4
bds
|
4
ba
|
3,965
sqft
|
built
1990
11966 S Bluff View Dr, Sandy, UT 84092
$-3,056
Cash flow
-15.4%
Cash-on-Cash Return
2.1%
Cap rate
0.3%
Rent to Value Ratio
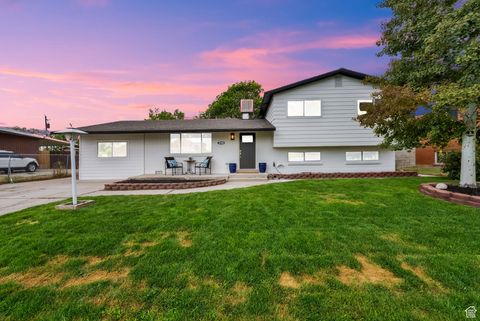
Active
$530,000
6
bds
|
3
ba
|
2,464
sqft
|
built
1968
2784 W 2890 S, Salt Lake City, UT 84119
$-1,113
Cash flow
-11.0%
Cash-on-Cash Return
3.2%
Cap rate
0.4%
Rent to Value Ratio
Active
$650,000
4
bds
|
4
ba
|
1,551
sqft
|
built
1902
1881 S 1100 E, Salt Lake City, UT 84105
$-1,797
Cash flow
-14.4%
Cash-on-Cash Return
2.4%
Cap rate
0.3%
Rent to Value Ratio
Active
$769,000
4
bds
|
2
ba
|
2,369
sqft
|
built
1914
714 S 600 E, Salt Lake City, UT 84102
$-1,708
Cash flow
-11.6%
Cash-on-Cash Return
3.0%
Cap rate
0.4%
Rent to Value Ratio
Active
$629,000
6
bds
|
3
ba
|
2,446
sqft
|
built
2002
14242 S Crown Rose Dr, Herriman, UT 84096
$-1,502
Cash flow
-12.5%
Cash-on-Cash Return
2.8%
Cap rate
0.4%
Rent to Value Ratio
Active
$849,900
7
bds
|
4
ba
|
3,134
sqft
|
built
1921
182 E Kelsey Ave, Salt Lake City, UT 84111
$-2,517
Cash flow
-15.5%
Cash-on-Cash Return
2.1%
Cap rate
0.3%
Rent to Value Ratio
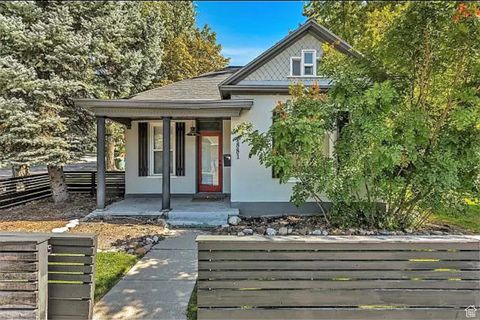
Active
$550,000
2
bds
|
1
ba
|
1,312
sqft
|
built
1902
1172 E Bryan Ave, Salt Lake City, UT 84105
$-1,106
Cash flow
-10.5%
Cash-on-Cash Return
3.3%
Cap rate
0.5%
Rent to Value Ratio
Active
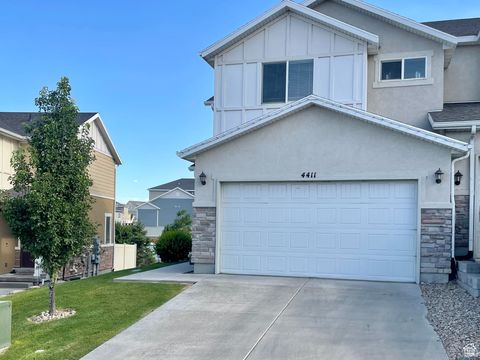
$459,900
3
bds
|
3
ba
|
2,060
sqft
|
built
2016
4411 W Meadow Path Ln, Herriman, UT 84096
$-978
Cash flow
-11.1%
Cash-on-Cash Return
3.1%
Cap rate
0.5%
Rent to Value Ratio
Active
$849,000
3
bds
|
3
ba
|
2,236
sqft
|
built
1964
4856 S Colony Dr, Holladay, UT 84117
$-2,328
Cash flow
-14.3%
Cash-on-Cash Return
2.4%
Cap rate
0.3%
Rent to Value Ratio
Active
$1,300,000
5
bds
|
4
ba
|
4,362
sqft
|
built
1981
4972 S Boabab Cir, Holladay, UT 84117
$-2,285
Cash flow
-9.2%
Cash-on-Cash Return
3.6%
Cap rate
0.5%
Rent to Value Ratio
Active
$933,000
5
bds
|
4
ba
|
5,048
sqft
|
built
2018
14944 S Tilton Dr, Herriman, UT 84096
$-2,688
Cash flow
-15.0%
Cash-on-Cash Return
2.2%
Cap rate
0.3%
Rent to Value Ratio
Active
$548,500
3
bds
|
3
ba
|
1,889
sqft
|
built
2024
11721 S Gannet Way, South Jordan, UT 84009
$-1,336
Cash flow
-12.7%
Cash-on-Cash Return
2.8%
Cap rate
0.5%
Rent to Value Ratio
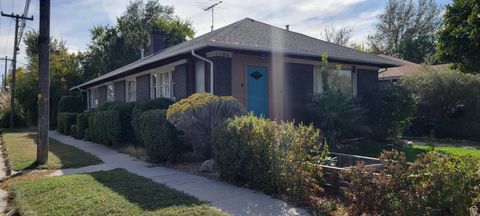
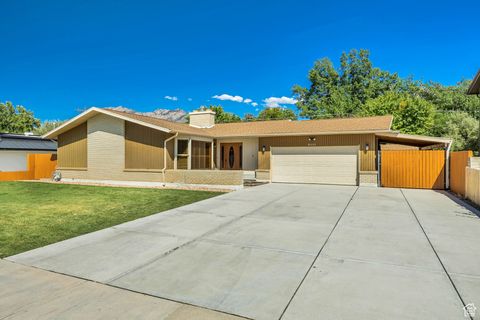
Active
$499,000
3
bds
|
1
ba
|
2,146
sqft
|
built
1962
932 E Tritoma Ave, Sandy, UT 84094
$-906
Cash flow
-9.5%
Cash-on-Cash Return
3.5%
Cap rate
0.5%
Rent to Value Ratio
Active
$960,000
4
bds
|
5
ba
|
3,852
sqft
|
built
1981
2099 E 10180 S, Sandy, UT 84092
$-2,056
Cash flow
-11.2%
Cash-on-Cash Return
3.1%
Cap rate
0.4%
Rent to Value Ratio
Active
$739,900
4
bds
|
2
ba
|
1,872
sqft
|
built
1900
374 E 6th Ave, Salt Lake City, UT 84103
$-1,903
Cash flow
-13.4%
Cash-on-Cash Return
2.6%
Cap rate
0.4%
Rent to Value Ratio
Active
$850,000
4
bds
|
2
ba
|
2,320
sqft
|
built
1959
4275 S Monarch Way, Holladay, UT 84124
$-2,762
Cash flow
-17.0%
Cash-on-Cash Return
1.8%
Cap rate
0.3%
Rent to Value Ratio
Active
$1,475,000
4
bds
|
4
ba
|
3,558
sqft
|
built
1966
2341 E Neffs Ln, Salt Lake City, UT 84109
$-5,623
Cash flow
-19.9%
Cash-on-Cash Return
1.1%
Cap rate
0.2%
Rent to Value Ratio
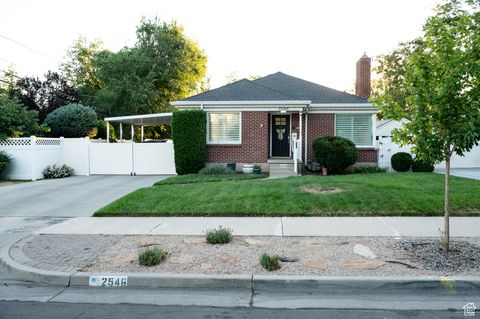
Active
$715,000
3
bds
|
2
ba
|
2,050
sqft
|
built
1948
2546 S 1800 E, Salt Lake City, UT 84106
$-2,263
Cash flow
-16.5%
Cash-on-Cash Return
1.9%
Cap rate
0.3%
Rent to Value Ratio
Active
$1,849,000
4
bds
|
5
ba
|
3,924
sqft
|
built
1982
825 N Juniperpoint Ct, Salt Lake City, UT 84103
$-5,429
Cash flow
-15.3%
Cash-on-Cash Return
2.2%
Cap rate
0.4%
Rent to Value Ratio
Active
$550,000
5
bds
|
4
ba
|
2,260
sqft
|
built
1986
10125 S Birnam Woods Way, South Jordan, UT 84009
$-1,293
Cash flow
-12.3%
Cash-on-Cash Return
2.9%
Cap rate
0.4%
Rent to Value Ratio
Active
$839,000
5
bds
|
4
ba
|
3,606
sqft
|
built
2016
10403 S Abbott Way, South Jordan, UT 84009
$-2,429
Cash flow
-15.1%
Cash-on-Cash Return
2.2%
Cap rate
0.3%
Rent to Value Ratio
Active
$535,000
4
bds
|
2
ba
|
1,971
sqft
|
built
1970
9770 S 1600 W, South Jordan, UT 84095
$-1,015
Cash flow
-9.9%
Cash-on-Cash Return
3.4%
Cap rate
0.5%
Rent to Value Ratio
Active
$4,695,000
6
bds
|
6
ba
|
8,218
sqft
|
built
2023
2138 E Pheasant Ln, Holladay, UT 84121
$-20,913
Cash flow
-23.2%
Cash-on-Cash Return
0.3%
Cap rate
0.1%
Rent to Value Ratio
Active
$695,000
5
bds
|
3
ba
|
2,916
sqft
|
built
1972
8131 S Viscounti Dr, Sandy, UT 84093
$-1,997
Cash flow
-15.0%
Cash-on-Cash Return
2.2%
Cap rate
0.3%
Rent to Value Ratio
Active
$725,000
4
bds
|
4
ba
|
3,168
sqft
|
built
2014
14427 S Attleboro Dr, Herriman, UT 84096
$-1,368
Cash flow
-9.8%
Cash-on-Cash Return
3.4%
Cap rate
0.5%
Rent to Value Ratio
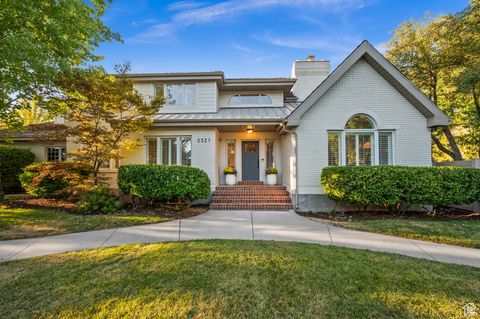
Active
$2,100,000
6
bds
|
4
ba
|
5,562
sqft
|
built
1987
2321 E Wrenhaven Ln, Holladay, UT 84121
$-6,167
Cash flow
-15.3%
Cash-on-Cash Return
2.2%
Cap rate
0.3%
Rent to Value Ratio
Active
$870,000
4
bds
|
2
ba
|
2,103
sqft
|
built
1918
1336 E Roosevelt Ave, Salt Lake City, UT 84105
$-1,694
Cash flow
-10.2%
Cash-on-Cash Return
3.3%
Cap rate
0.5%
Rent to Value Ratio
Active
$829,000
4
bds
|
3
ba
|
3,709
sqft
|
built
2009
14333 S Fort Pierce Way, Herriman, UT 84096
$-2,111
Cash flow
-13.3%
Cash-on-Cash Return
2.6%
Cap rate
0.4%
Rent to Value Ratio
Active
$449,000
2
bds
|
2
ba
|
1,220
sqft
|
built
1980
4785 S Dipo Pl, Holladay, UT 84117
$-1,480
Cash flow
-17.2%
Cash-on-Cash Return
1.7%
Cap rate
0.4%
Rent to Value Ratio
Active
$1,149,900
5
bds
|
4
ba
|
2,808
sqft
|
built
1960
4529 S Westview Dr, Salt Lake City, UT 84124
$-2,965
Cash flow
-13.5%
Cash-on-Cash Return
2.6%
Cap rate
0.3%
Rent to Value Ratio
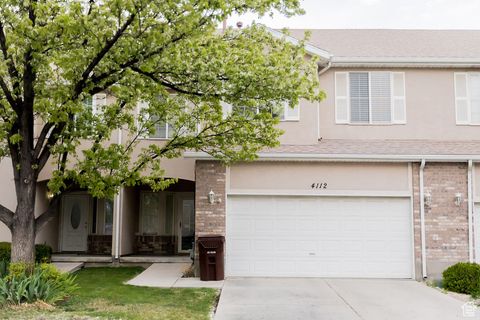
Active
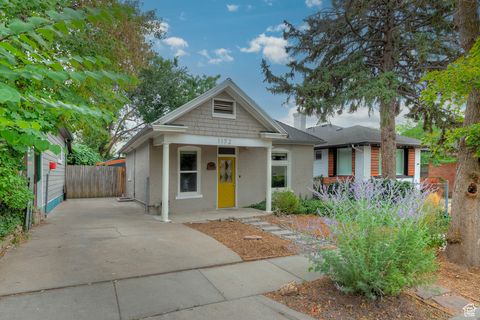
$399,900
3
bds
|
3
ba
|
1,552
sqft
|
built
1999
4112 W 4645 S, Salt Lake City, UT 84120
$-927
Cash flow
-12.1%
Cash-on-Cash Return
2.9%
Cap rate
0.5%
Rent to Value Ratio
Active
$389,900
3
bds
|
2
ba
|
1,347
sqft
|
built
1964
2203 E Carriage Ln, Holladay, UT 84117
$-997
Cash flow
-13.3%
Cash-on-Cash Return
2.6%
Cap rate
0.5%
Rent to Value Ratio
Active
$724,999
4
bds
|
3
ba
|
2,628
sqft
|
built
1979
1760 E Sunrise Meadow Dr, Sandy, UT 84093
$-2,104
Cash flow
-15.1%
Cash-on-Cash Return
2.2%
Cap rate
0.3%
Rent to Value Ratio
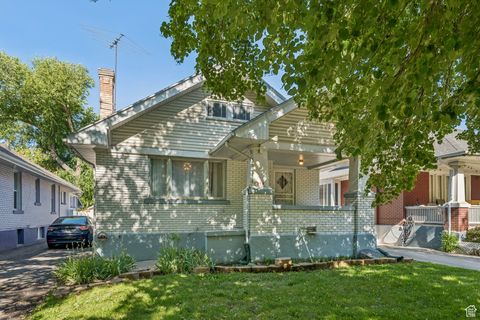
Active
$1,125,000
5
bds
|
3
ba
|
2,677
sqft
|
built
1927
1791 S 1600 E, Salt Lake City, UT 84105
$-1,920
Cash flow
-8.9%
Cash-on-Cash Return
3.6%
Cap rate
0.5%
Rent to Value Ratio