Salt Lake County Investment Properties for Sale
Browse homes for sale and investment properties in Salt Lake County. Refine your search by price, property type, or more.
Best cash flowing properties in Salt Lake County
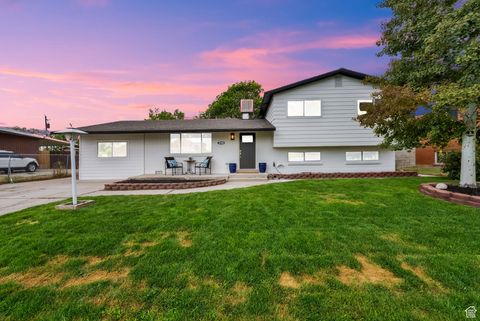
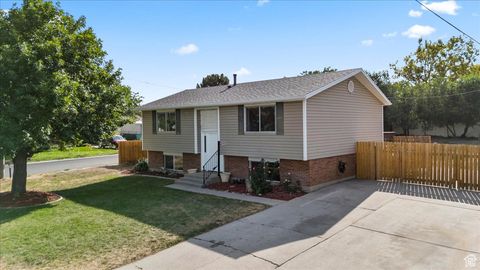
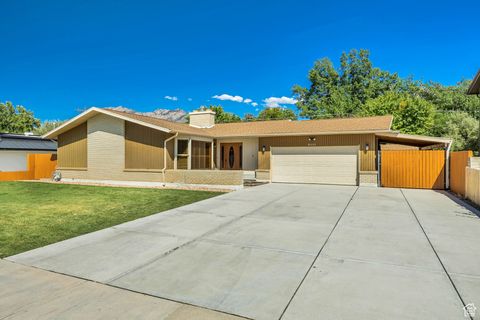
Active
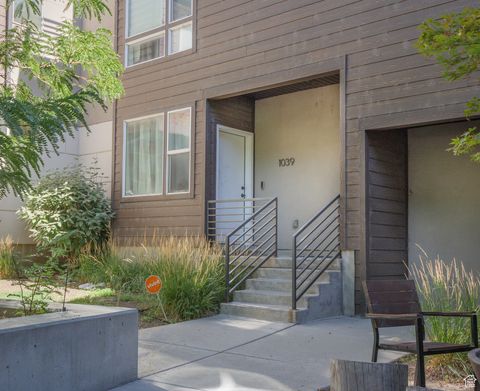
$460,000
3
bds
|
2
ba
|
1,684
sqft
|
built
2012
1039 W Rooftop Dr, Midvale, UT 84047
$-904
Cash flow
-10.3%
Cash-on-Cash Return
3.3%
Cap rate
0.5%
Rent to Value Ratio
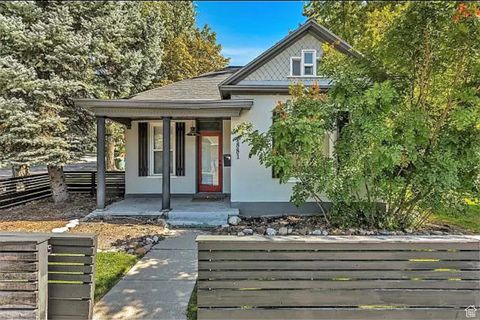
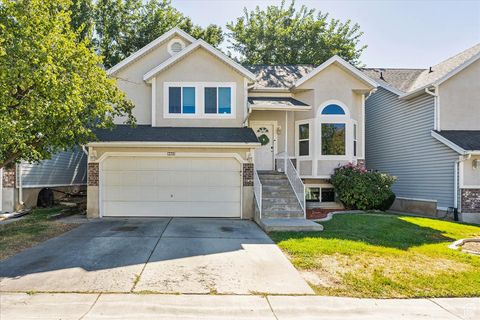
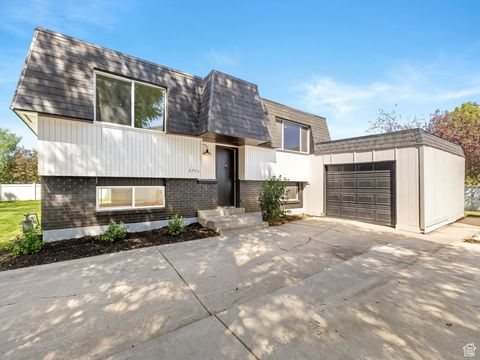
Active
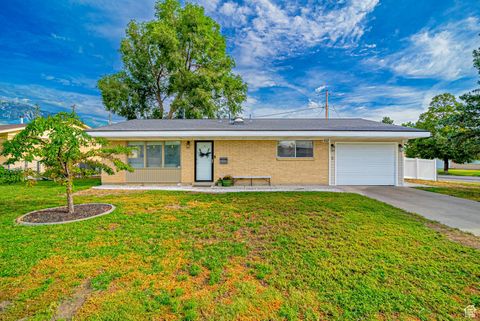
$499,000
3
bds
|
1
ba
|
2,146
sqft
|
built
1962
932 E Tritoma Ave, Sandy, UT 84094
$-906
Cash flow
-9.5%
Cash-on-Cash Return
3.5%
Cap rate
0.5%
Rent to Value Ratio
1,295 out of 1,623 properties for sale in Salt Lake County
Limited Results Shown
Create a free account, or log in to reveal all property listings and enjoy the complete experience.
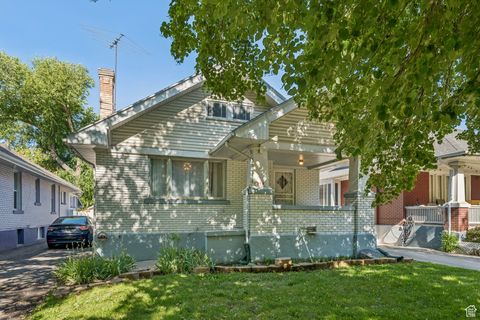
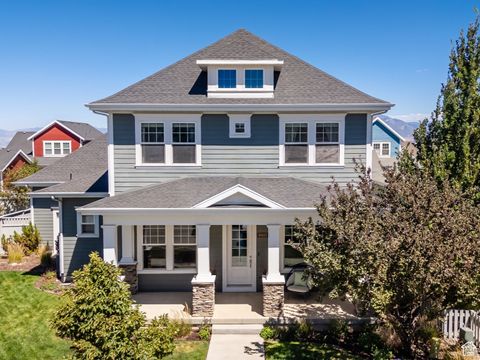
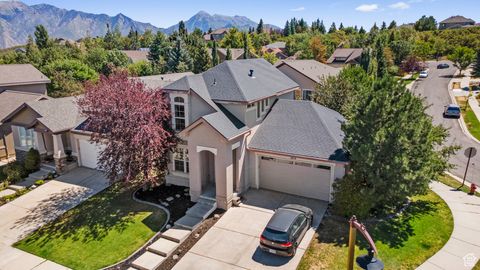
Active
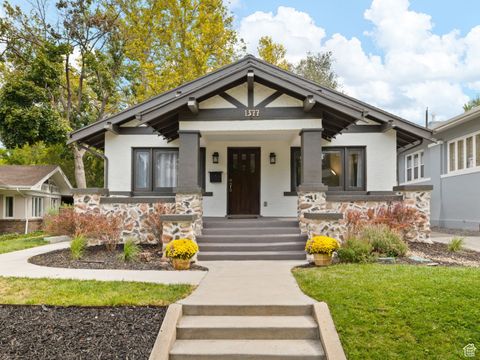
$1,350,000
4
bds
|
3
ba
|
4,248
sqft
|
built
1916
1377 E Butler Ave, Salt Lake City, UT 84102
$-2,972
Cash flow
-11.5%
Cash-on-Cash Return
3.0%
Cap rate
0.4%
Rent to Value Ratio
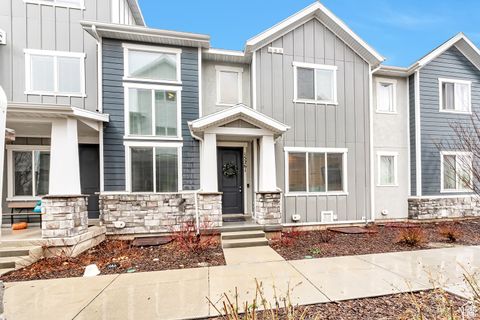
Active
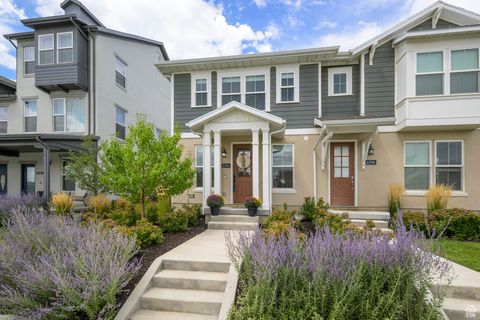
$467,000
3
bds
|
3
ba
|
1,400
sqft
|
built
2022
11714 S Watercourse Rd, South Jordan, UT 84009
$-1,191
Cash flow
-13.3%
Cash-on-Cash Return
2.6%
Cap rate
0.5%
Rent to Value Ratio
Active
$530,000
6
bds
|
3
ba
|
2,464
sqft
|
built
1968
2784 W 2890 S, Salt Lake City, UT 84119
$-1,113
Cash flow
-11.0%
Cash-on-Cash Return
3.2%
Cap rate
0.4%
Rent to Value Ratio
Active
$650,000
4
bds
|
4
ba
|
1,551
sqft
|
built
1902
1881 S 1100 E, Salt Lake City, UT 84105
$-1,797
Cash flow
-14.4%
Cash-on-Cash Return
2.4%
Cap rate
0.3%
Rent to Value Ratio
Active
$769,000
4
bds
|
2
ba
|
2,369
sqft
|
built
1914
714 S 600 E, Salt Lake City, UT 84102
$-1,708
Cash flow
-11.6%
Cash-on-Cash Return
3.0%
Cap rate
0.4%
Rent to Value Ratio
Active
$475,000
3
bds
|
4
ba
|
2,244
sqft
|
built
2020
15261 S Reins Way, Bluffdale, UT 84065
$-1,023
Cash flow
-11.2%
Cash-on-Cash Return
3.1%
Cap rate
0.5%
Rent to Value Ratio
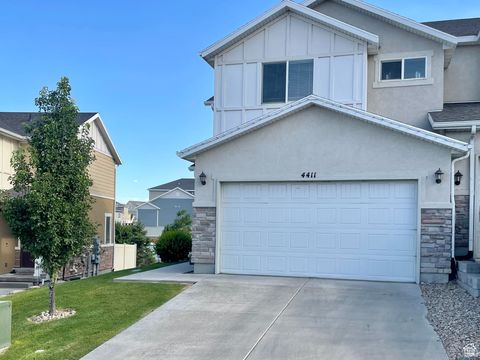
Active
$459,900
3
bds
|
3
ba
|
2,060
sqft
|
built
2016
4411 W Meadow Path Ln, Herriman, UT 84096
$-978
Cash flow
-11.1%
Cash-on-Cash Return
3.1%
Cap rate
0.5%
Rent to Value Ratio
Active
$849,900
7
bds
|
4
ba
|
3,134
sqft
|
built
1921
182 E Kelsey Ave, Salt Lake City, UT 84111
$-2,517
Cash flow
-15.5%
Cash-on-Cash Return
2.1%
Cap rate
0.3%
Rent to Value Ratio
Active
$500,000
3
bds
|
4
ba
|
2,088
sqft
|
built
2001
239 E 7350 S, Midvale, UT 84047
$-1,284
Cash flow
-13.4%
Cash-on-Cash Return
2.6%
Cap rate
0.4%
Rent to Value Ratio
Active
$849,000
3
bds
|
3
ba
|
2,236
sqft
|
built
1964
4856 S Colony Dr, Holladay, UT 84117
$-2,328
Cash flow
-14.3%
Cash-on-Cash Return
2.4%
Cap rate
0.3%
Rent to Value Ratio
Active
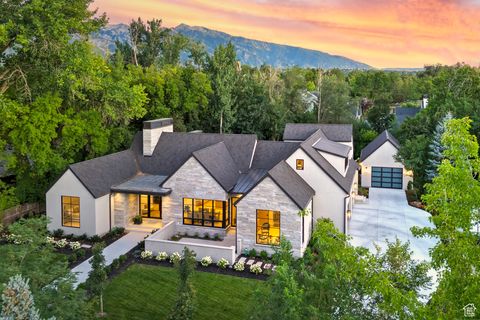
$1,300,000
5
bds
|
4
ba
|
4,362
sqft
|
built
1981
4972 S Boabab Cir, Holladay, UT 84117
$-2,285
Cash flow
-9.2%
Cash-on-Cash Return
3.6%
Cap rate
0.5%
Rent to Value Ratio
Active
$1,125,000
8
bds
|
4
ba
|
3,600
sqft
|
built
1973
2739 S Buccaneer Dr, Magna, UT 84044
$-4,154
Cash flow
-19.3%
Cash-on-Cash Return
1.2%
Cap rate
0.2%
Rent to Value Ratio
Active
$933,000
5
bds
|
4
ba
|
5,048
sqft
|
built
2018
14944 S Tilton Dr, Herriman, UT 84096
$-2,688
Cash flow
-15.0%
Cash-on-Cash Return
2.2%
Cap rate
0.3%
Rent to Value Ratio
Active
$850,000
4
bds
|
2
ba
|
2,320
sqft
|
built
1959
4275 S Monarch Way, Holladay, UT 84124
$-2,762
Cash flow
-17.0%
Cash-on-Cash Return
1.8%
Cap rate
0.3%
Rent to Value Ratio
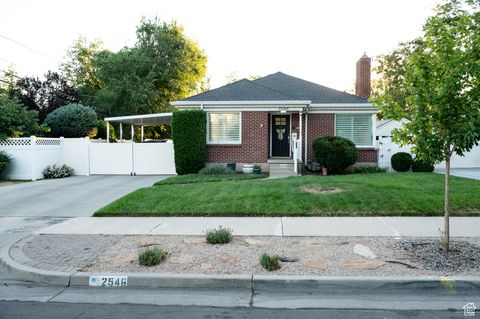
Active
$715,000
3
bds
|
2
ba
|
2,050
sqft
|
built
1948
2546 S 1800 E, Salt Lake City, UT 84106
$-2,263
Cash flow
-16.5%
Cash-on-Cash Return
1.9%
Cap rate
0.3%
Rent to Value Ratio
Active
$1,849,000
4
bds
|
5
ba
|
3,924
sqft
|
built
1982
825 N Juniperpoint Ct, Salt Lake City, UT 84103
$-5,429
Cash flow
-15.3%
Cash-on-Cash Return
2.2%
Cap rate
0.4%
Rent to Value Ratio
Active
$500,000
3
bds
|
1
ba
|
1,520
sqft
|
built
1942
118 W 8600 S, Midvale, UT 84047
$-1,612
Cash flow
-16.8%
Cash-on-Cash Return
1.8%
Cap rate
0.3%
Rent to Value Ratio
Active
$960,000
4
bds
|
5
ba
|
3,852
sqft
|
built
1981
2099 E 10180 S, Sandy, UT 84092
$-2,056
Cash flow
-11.2%
Cash-on-Cash Return
3.1%
Cap rate
0.4%
Rent to Value Ratio
Active
$4,695,000
6
bds
|
6
ba
|
8,218
sqft
|
built
2023
2138 E Pheasant Ln, Holladay, UT 84121
$-20,913
Cash flow
-23.2%
Cash-on-Cash Return
0.3%
Cap rate
0.1%
Rent to Value Ratio
Active
$839,000
5
bds
|
4
ba
|
3,606
sqft
|
built
2016
10403 S Abbott Way, South Jordan, UT 84009
$-2,429
Cash flow
-15.1%
Cash-on-Cash Return
2.2%
Cap rate
0.3%
Rent to Value Ratio
Active
$535,000
4
bds
|
2
ba
|
1,971
sqft
|
built
1970
9770 S 1600 W, South Jordan, UT 84095
$-1,015
Cash flow
-9.9%
Cash-on-Cash Return
3.4%
Cap rate
0.5%
Rent to Value Ratio
Active
$479,000
3
bds
|
2
ba
|
1,896
sqft
|
built
1992
574 E Downing St, Midvale, UT 84047
$-1,044
Cash flow
-11.4%
Cash-on-Cash Return
3.1%
Cap rate
0.5%
Rent to Value Ratio
Active
$695,000
5
bds
|
3
ba
|
2,916
sqft
|
built
1972
8131 S Viscounti Dr, Sandy, UT 84093
$-1,997
Cash flow
-15.0%
Cash-on-Cash Return
2.2%
Cap rate
0.3%
Rent to Value Ratio
Active
$499,000
4
bds
|
2
ba
|
1,757
sqft
|
built
1973
3770 W Carolina Dr, West Jordan, UT 84084
$-1,372
Cash flow
-14.3%
Cash-on-Cash Return
2.4%
Cap rate
0.3%
Rent to Value Ratio
Active
$590,000
4
bds
|
4
ba
|
1,972
sqft
|
built
2000
1870 E Oak Bend Dr, Draper, UT 84020
$-1,391
Cash flow
-12.3%
Cash-on-Cash Return
2.8%
Cap rate
0.4%
Rent to Value Ratio
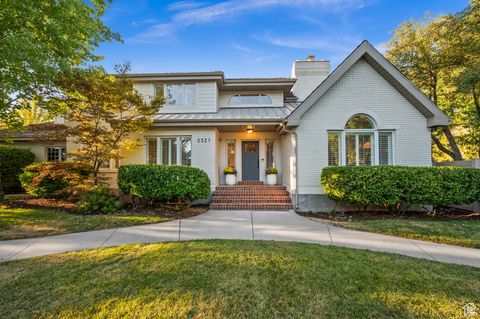
Active
$2,100,000
6
bds
|
4
ba
|
5,562
sqft
|
built
1987
2321 E Wrenhaven Ln, Holladay, UT 84121
$-6,167
Cash flow
-15.3%
Cash-on-Cash Return
2.2%
Cap rate
0.3%
Rent to Value Ratio
Active
$395,900
2
bds
|
2
ba
|
1,320
sqft
|
built
1976
657 E 4065 S, Murray, UT 84107
$-1,287
Cash flow
-17.0%
Cash-on-Cash Return
1.8%
Cap rate
0.4%
Rent to Value Ratio
Active
$725,000
4
bds
|
4
ba
|
3,168
sqft
|
built
2014
14427 S Attleboro Dr, Herriman, UT 84096
$-1,368
Cash flow
-9.8%
Cash-on-Cash Return
3.4%
Cap rate
0.5%
Rent to Value Ratio
Active
$734,000
4
bds
|
3
ba
|
2,212
sqft
|
built
1965
6557 S 2600 E, Cottonwood Heights, UT 84121
$-1,073
Cash flow
-7.6%
Cash-on-Cash Return
3.9%
Cap rate
0.5%
Rent to Value Ratio
Active
$870,000
4
bds
|
2
ba
|
2,103
sqft
|
built
1918
1336 E Roosevelt Ave, Salt Lake City, UT 84105
$-1,694
Cash flow
-10.2%
Cash-on-Cash Return
3.3%
Cap rate
0.5%
Rent to Value Ratio
Active
$829,000
4
bds
|
3
ba
|
3,709
sqft
|
built
2009
14333 S Fort Pierce Way, Herriman, UT 84096
$-2,111
Cash flow
-13.3%
Cash-on-Cash Return
2.6%
Cap rate
0.4%
Rent to Value Ratio
Active
$1,199,000
5
bds
|
4
ba
|
3,248
sqft
|
built
1978
9072 S Greenhills Dr, Cottonwood Heights, UT 84093
$-3,989
Cash flow
-17.4%
Cash-on-Cash Return
1.7%
Cap rate
0.2%
Rent to Value Ratio
Active
$1,100,000
5
bds
|
4
ba
|
3,406
sqft
|
built
2011
1958 E Cecelia Cir, Holladay, UT 84121
$-3,503
Cash flow
-16.6%
Cash-on-Cash Return
1.9%
Cap rate
0.3%
Rent to Value Ratio
Active
$770,000
4
bds
|
3
ba
|
2,103
sqft
|
built
1909
1220 E 600 S, Salt Lake City, UT 84102
$-1,425
Cash flow
-9.7%
Cash-on-Cash Return
3.5%
Cap rate
0.5%
Rent to Value Ratio
Active
$425,000
3
bds
|
3
ba
|
1,602
sqft
|
built
1976
582 E 4010 S, Murray, UT 84107
$-1,090
Cash flow
-13.4%
Cash-on-Cash Return
2.6%
Cap rate
0.5%
Rent to Value Ratio
Active
$650,000
6
bds
|
4
ba
|
3,159
sqft
|
built
1998
4678 W Emmons Dr, West Jordan, UT 84088
$-1,627
Cash flow
-13.1%
Cash-on-Cash Return
2.7%
Cap rate
0.4%
Rent to Value Ratio
Active
$1,149,900
5
bds
|
4
ba
|
2,808
sqft
|
built
1960
4529 S Westview Dr, Salt Lake City, UT 84124
$-2,965
Cash flow
-13.5%
Cash-on-Cash Return
2.6%
Cap rate
0.3%
Rent to Value Ratio
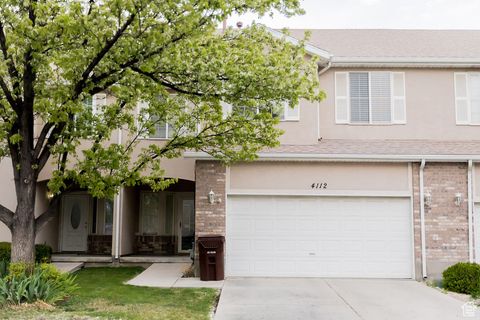
Active
$399,900
3
bds
|
3
ba
|
1,552
sqft
|
built
1999
4112 W 4645 S, Salt Lake City, UT 84120
$-927
Cash flow
-12.1%
Cash-on-Cash Return
2.9%
Cap rate
0.5%
Rent to Value Ratio