Weber County Investment Properties for Sale
Browse homes for sale and investment properties in Weber County. Refine your search by price, property type, or more.
Best cash flowing properties in Weber County
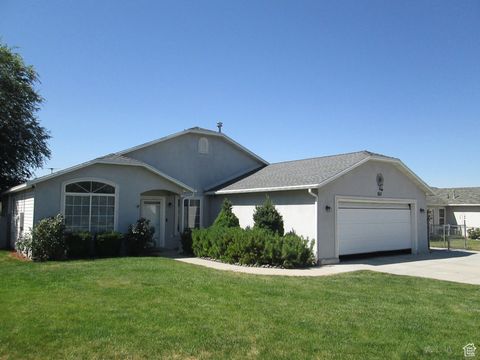
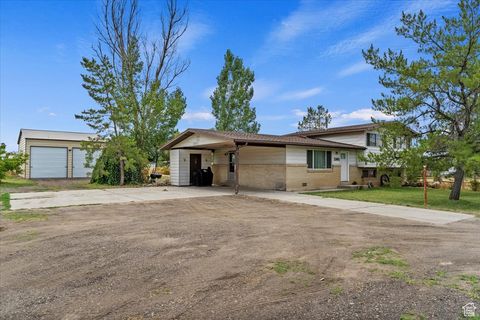
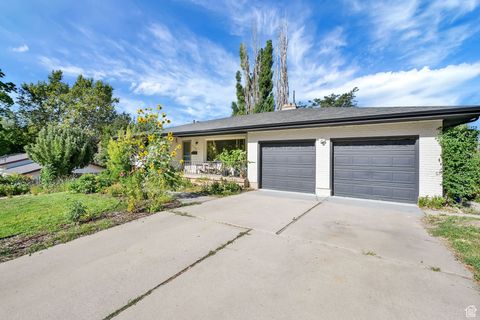
Active
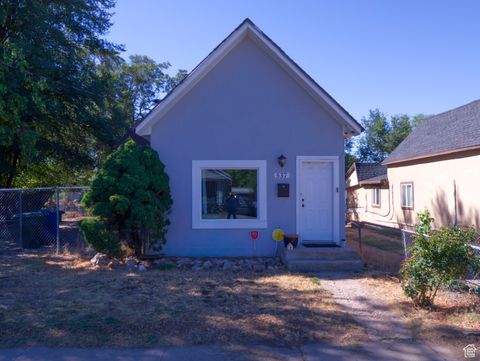
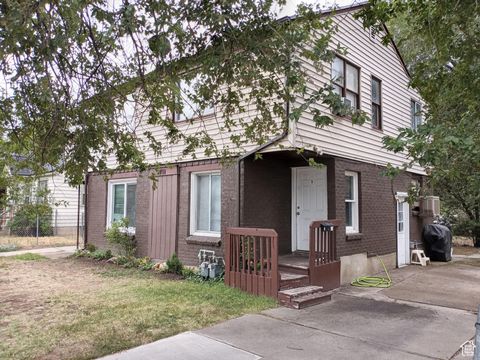
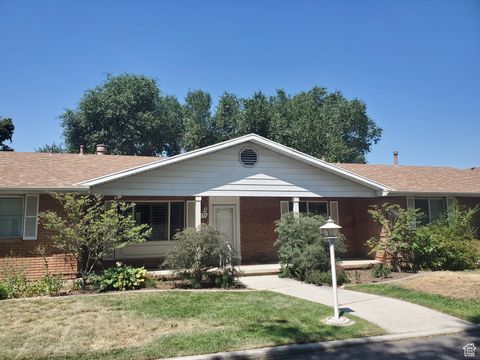
$334,900
3
bds
|
1
ba
|
1,360
sqft
|
built
1926
537 Cook St, Ogden, UT 84404
$-516
Cash flow
-8.0%
Cash-on-Cash Return
3.8%
Cap rate
0.5%
Rent to Value Ratio

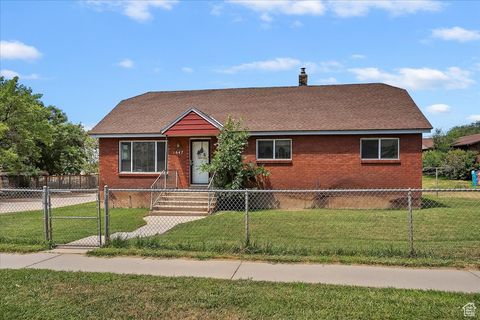
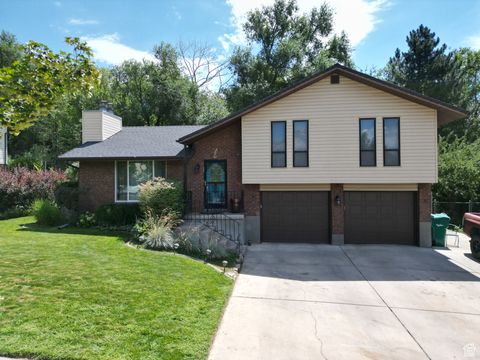
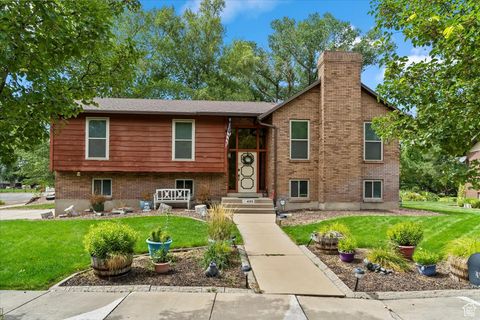
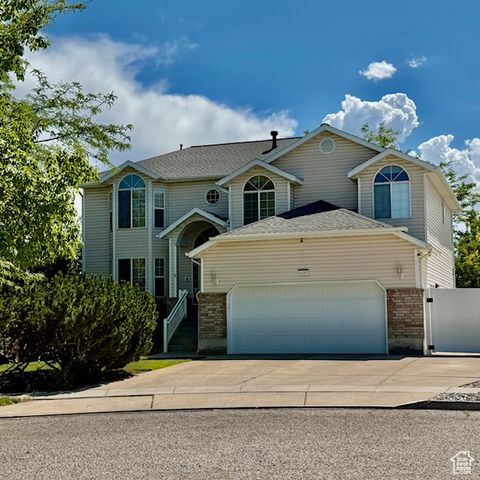
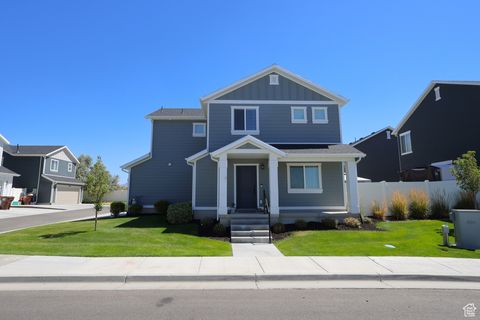
Active
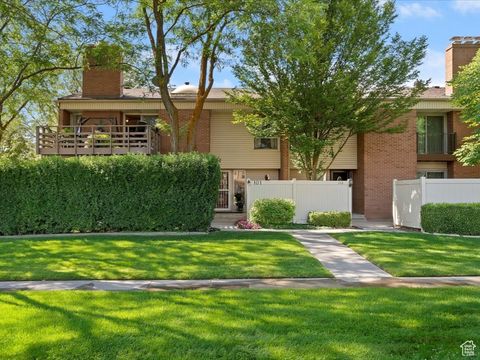
$415,000
5
bds
|
2
ba
|
2,116
sqft
|
built
1986
3923 W 5700 S, Roy, UT 84067
$-560
Cash flow
-7.0%
Cash-on-Cash Return
4.1%
Cap rate
0.6%
Rent to Value Ratio
525 out of 642 properties for sale in Weber County
Limited Results Shown
Create a free account, or log in to reveal all property listings and enjoy the complete experience.

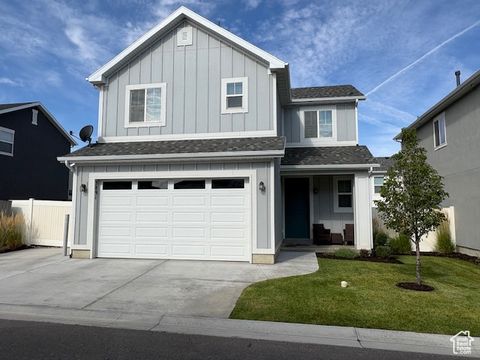
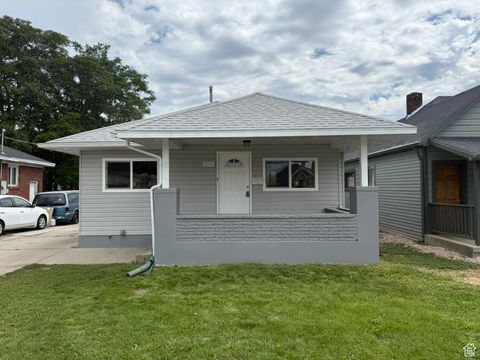
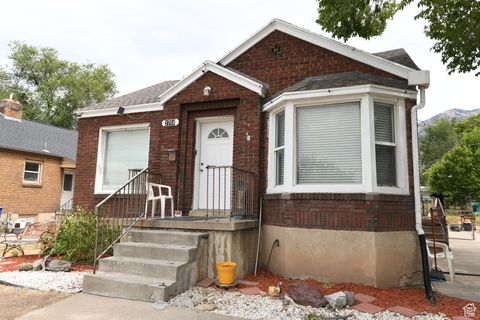
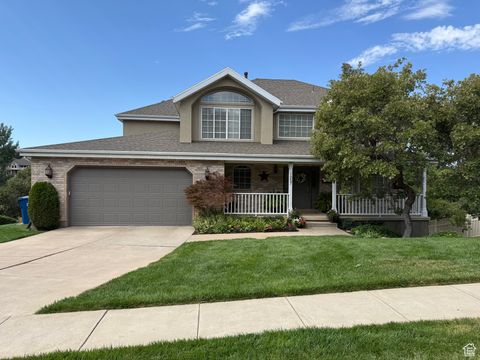
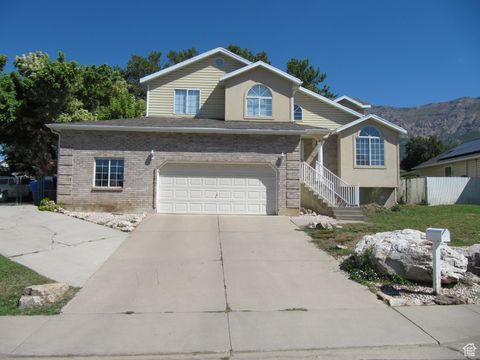
Active
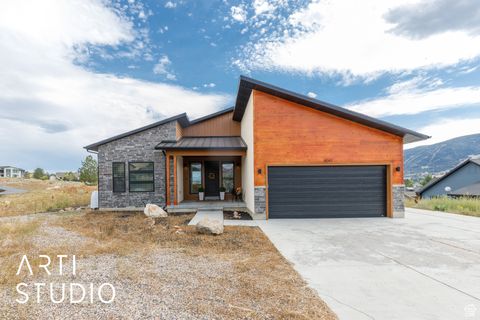
$549,900
3
bds
|
2
ba
|
2,312
sqft
|
built
1949
197 W 2nd St, Ogden, UT 84404
$-1,309
Cash flow
-12.4%
Cash-on-Cash Return
2.8%
Cap rate
0.4%
Rent to Value Ratio
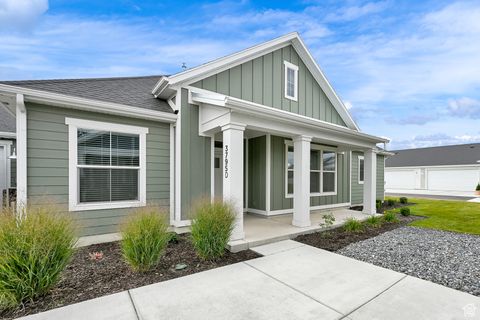
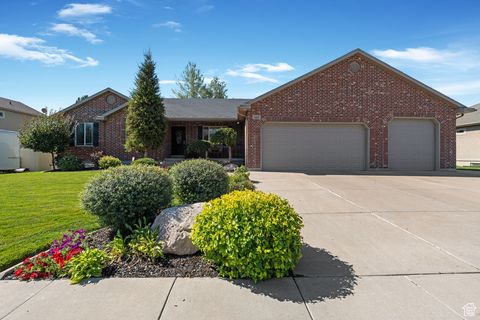
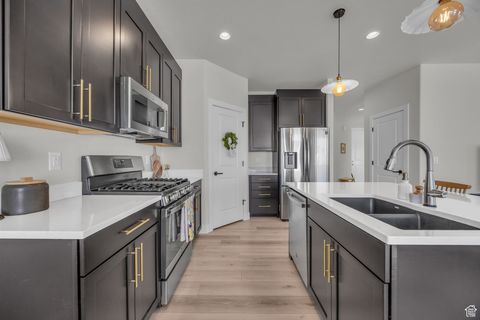
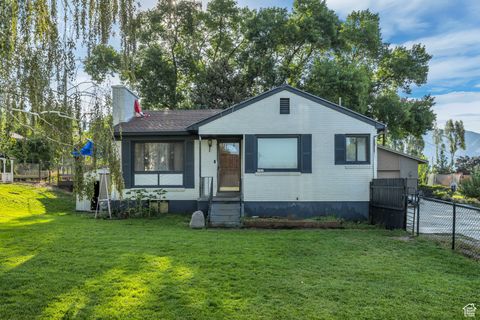
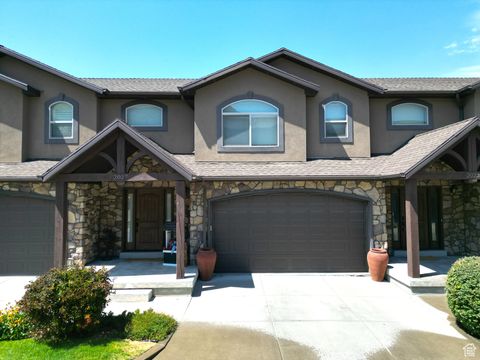
Active
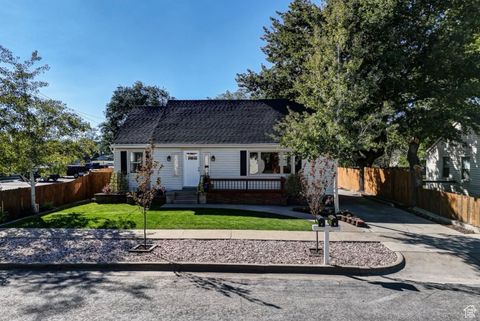
$430,000
3
bds
|
1
ba
|
1,392
sqft
|
built
1945
1647 N Washington Blvd, Ogden, UT 84404
$-986
Cash flow
-12.0%
Cash-on-Cash Return
2.9%
Cap rate
0.4%
Rent to Value Ratio
Active
$454,900
3
bds
|
3
ba
|
1,460
sqft
|
built
2020
3891 S 2940 W, West Haven, UT 84401
$-1,022
Cash flow
-11.7%
Cash-on-Cash Return
3.0%
Cap rate
0.4%
Rent to Value Ratio
Active
$519,000
3
bds
|
2
ba
|
1,818
sqft
|
built
2023
3795 S 4250 W, West Haven, UT 84401
$-1,595
Cash flow
-16.0%
Cash-on-Cash Return
2.0%
Cap rate
0.3%
Rent to Value Ratio
Active
$425,000
3
bds
|
2
ba
|
1,511
sqft
|
built
1999
853 E 725 N, Ogden, UT 84404
$-923
Cash flow
-11.3%
Cash-on-Cash Return
3.1%
Cap rate
0.4%
Rent to Value Ratio
Active
$549,900
4
bds
|
3
ba
|
2,028
sqft
|
built
1979
1047 E 800 N, Ogden, UT 84404
$-1,339
Cash flow
-12.7%
Cash-on-Cash Return
2.8%
Cap rate
0.4%
Rent to Value Ratio
Active
$349,900
3
bds
|
2
ba
|
1,064
sqft
|
built
1921
3216 Ogden Ave, Ogden, UT 84401
$-827
Cash flow
-12.3%
Cash-on-Cash Return
2.8%
Cap rate
0.4%
Rent to Value Ratio
Active
$705,000
6
bds
|
4
ba
|
3,673
sqft
|
built
2003
641 W 3550 S, Riverdale, UT 84405
$-1,492
Cash flow
-11.0%
Cash-on-Cash Return
3.1%
Cap rate
0.4%
Rent to Value Ratio
Active
$539,900
3
bds
|
2
ba
|
1,760
sqft
|
built
1967
5345 W 4000 S, Hooper, UT 84315
$-1,532
Cash flow
-14.8%
Cash-on-Cash Return
2.3%
Cap rate
0.3%
Rent to Value Ratio
Active
$479,999
4
bds
|
3
ba
|
2,602
sqft
|
built
1983
4189 S 600 W, Riverdale, UT 84405
$-912
Cash flow
-9.9%
Cash-on-Cash Return
3.4%
Cap rate
0.5%
Rent to Value Ratio
Active
$349,000
4
bds
|
2
ba
|
1,814
sqft
|
built
1940
2764 Fowler Ave, Ogden, UT 84403
$-615
Cash flow
-9.2%
Cash-on-Cash Return
3.6%
Cap rate
0.5%
Rent to Value Ratio
Active
$440,000
4
bds
|
3
ba
|
1,806
sqft
|
built
2022
3835 S 3250 W, West Haven, UT 84401
$-971
Cash flow
-11.5%
Cash-on-Cash Return
3.0%
Cap rate
0.5%
Rent to Value Ratio
Active
$268,900
2
bds
|
2
ba
|
1,045
sqft
|
built
2019
154 7th St, Ogden, UT 84404
$-601
Cash flow
-11.7%
Cash-on-Cash Return
3.0%
Cap rate
0.6%
Rent to Value Ratio
Active
$379,900
3
bds
|
3
ba
|
1,544
sqft
|
built
2019
2695 S 2300 W, West Haven, UT 84401
$-758
Cash flow
-10.4%
Cash-on-Cash Return
3.3%
Cap rate
0.5%
Rent to Value Ratio
Active
$749,500
4
bds
|
3
ba
|
2,090
sqft
|
built
1995
2869 N 5150 W, Plain City, UT 84404
$-2,177
Cash flow
-15.2%
Cash-on-Cash Return
2.2%
Cap rate
0.3%
Rent to Value Ratio
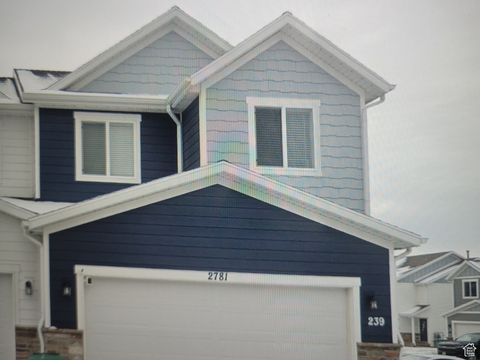
Active
$419,500
3
bds
|
4
ba
|
2,190
sqft
|
built
2021
2781 W 4140 S, Roy, UT 84067
$-913
Cash flow
-11.4%
Cash-on-Cash Return
3.1%
Cap rate
0.5%
Rent to Value Ratio
Active
$1,100,000
5
bds
|
4
ba
|
4,306
sqft
|
built
2014
1130 Fawn Dr, Pleasant View, UT 84414
$-2,515
Cash flow
-11.9%
Cash-on-Cash Return
2.9%
Cap rate
0.4%
Rent to Value Ratio
Active
$429,000
4
bds
|
2
ba
|
1,903
sqft
|
built
1976
1812 N 625 E, North Ogden, UT 84414
$-1,040
Cash flow
-12.6%
Cash-on-Cash Return
2.8%
Cap rate
0.4%
Rent to Value Ratio
Active
$495,000
6
bds
|
3
ba
|
2,511
sqft
|
built
1976
6559 W 4600 S, Hooper, UT 84315
$-722
Cash flow
-7.6%
Cash-on-Cash Return
3.9%
Cap rate
0.6%
Rent to Value Ratio
Active
$589,900
4
bds
|
3
ba
|
2,385
sqft
|
built
2022
4335 W 3490 S, West Haven, UT 84401
$-1,470
Cash flow
-13.0%
Cash-on-Cash Return
2.7%
Cap rate
0.4%
Rent to Value Ratio
Active
$599,900
4
bds
|
3
ba
|
3,024
sqft
|
built
1967
3173 Tyler Ave, Ogden, UT 84403
$-1,179
Cash flow
-10.3%
Cash-on-Cash Return
3.3%
Cap rate
0.5%
Rent to Value Ratio
Active
$650,000
5
bds
|
4
ba
|
3,435
sqft
|
built
1999
4097 W 4750 S, Roy, UT 84067
$-1,625
Cash flow
-13.0%
Cash-on-Cash Return
2.7%
Cap rate
0.4%
Rent to Value Ratio
Active
$719,000
6
bds
|
4
ba
|
3,542
sqft
|
built
1989
1057 E 5150 S, South Ogden, UT 84403
$-1,787
Cash flow
-13.0%
Cash-on-Cash Return
2.7%
Cap rate
0.4%
Rent to Value Ratio
Active
$510,000
4
bds
|
2
ba
|
1,990
sqft
|
built
1957
242 E 2900 N, Ogden, UT 84414
$-1,113
Cash flow
-11.4%
Cash-on-Cash Return
3.1%
Cap rate
0.4%
Rent to Value Ratio
Active
$500,000
7
bds
|
3
ba
|
3,024
sqft
|
built
1947
2711 Liberty Ave, Ogden, UT 84403
$-1,229
Cash flow
-12.8%
Cash-on-Cash Return
2.7%
Cap rate
0.4%
Rent to Value Ratio
Active
$464,900
3
bds
|
3
ba
|
1,445
sqft
|
built
2022
2919 W 3885 S, West Haven, UT 84401
$-861
Cash flow
-9.7%
Cash-on-Cash Return
3.5%
Cap rate
0.5%
Rent to Value Ratio
Active
$580,000
5
bds
|
3
ba
|
2,394
sqft
|
built
1993
544 E 3100 N, North Ogden, UT 84414
$-1,351
Cash flow
-12.2%
Cash-on-Cash Return
2.9%
Cap rate
0.4%
Rent to Value Ratio
Active
$399,000
3
bds
|
3
ba
|
2,464
sqft
|
built
2010
2027 Tyler View Way, Ogden, UT 84401
$-800
Cash flow
-10.5%
Cash-on-Cash Return
3.3%
Cap rate
0.6%
Rent to Value Ratio
Active
$299,000
4
bds
|
2
ba
|
2,170
sqft
|
built
1975
1177 S 885 E, Ogden, UT 84404
$-758
Cash flow
-13.2%
Cash-on-Cash Return
2.6%
Cap rate
0.5%
Rent to Value Ratio
Active
$365,000
4
bds
|
3
ba
|
2,256
sqft
|
built
1974
1825 W 4500 S, Roy, UT 84067
$-931
Cash flow
-13.3%
Cash-on-Cash Return
2.6%
Cap rate
0.5%
Rent to Value Ratio
Active
$1,120,000
5
bds
|
3
ba
|
3,974
sqft
|
built
2022
4041 E 4475 N, Eden, UT 84310
$-2,053
Cash flow
-9.6%
Cash-on-Cash Return
3.5%
Cap rate
0.5%
Rent to Value Ratio
Active
$449,900
4
bds
|
2
ba
|
2,056
sqft
|
built
1949
505 Kiesel Ave, Ogden, UT 84404
$-596
Cash flow
-6.9%
Cash-on-Cash Return
4.1%
Cap rate
0.6%
Rent to Value Ratio
Active
$465,000
5
bds
|
3
ba
|
2,622
sqft
|
built
1968
4615 Monroe Blvd, South Ogden, UT 84403
$-719
Cash flow
-8.1%
Cash-on-Cash Return
3.8%
Cap rate
0.5%
Rent to Value Ratio
Active
$1,499,000
4
bds
|
5
ba
|
3,483
sqft
|
built
2018
997 S Quail Ln, Huntsville, UT 84317
$-3,333
Cash flow
-11.6%
Cash-on-Cash Return
3.0%
Cap rate
0.4%
Rent to Value Ratio
Active
$353,000
3
bds
|
3
ba
|
1,298
sqft
|
built
2022
630 Plum Creek Ln, Ogden, UT 84404
$-747
Cash flow
-11.0%
Cash-on-Cash Return
3.1%
Cap rate
0.5%
Rent to Value Ratio
Active
$409,900
3
bds
|
2
ba
|
1,800
sqft
|
built
1958
2148 W 4850 S, Roy, UT 84067
$-869
Cash flow
-11.1%
Cash-on-Cash Return
3.1%
Cap rate
0.4%
Rent to Value Ratio
Active
$524,900
4
bds
|
3
ba
|
2,375
sqft
|
built
2000
4635 S 2950 W, Roy, UT 84067
$-1,029
Cash flow
-10.2%
Cash-on-Cash Return
3.3%
Cap rate
0.5%
Rent to Value Ratio
Active
$750,000
6
bds
|
3
ba
|
2,663
sqft
|
built
1999
4357 S 3700 W, West Haven, UT 84401
$-2,138
Cash flow
-14.9%
Cash-on-Cash Return
2.3%
Cap rate
0.3%
Rent to Value Ratio